

Key Insights
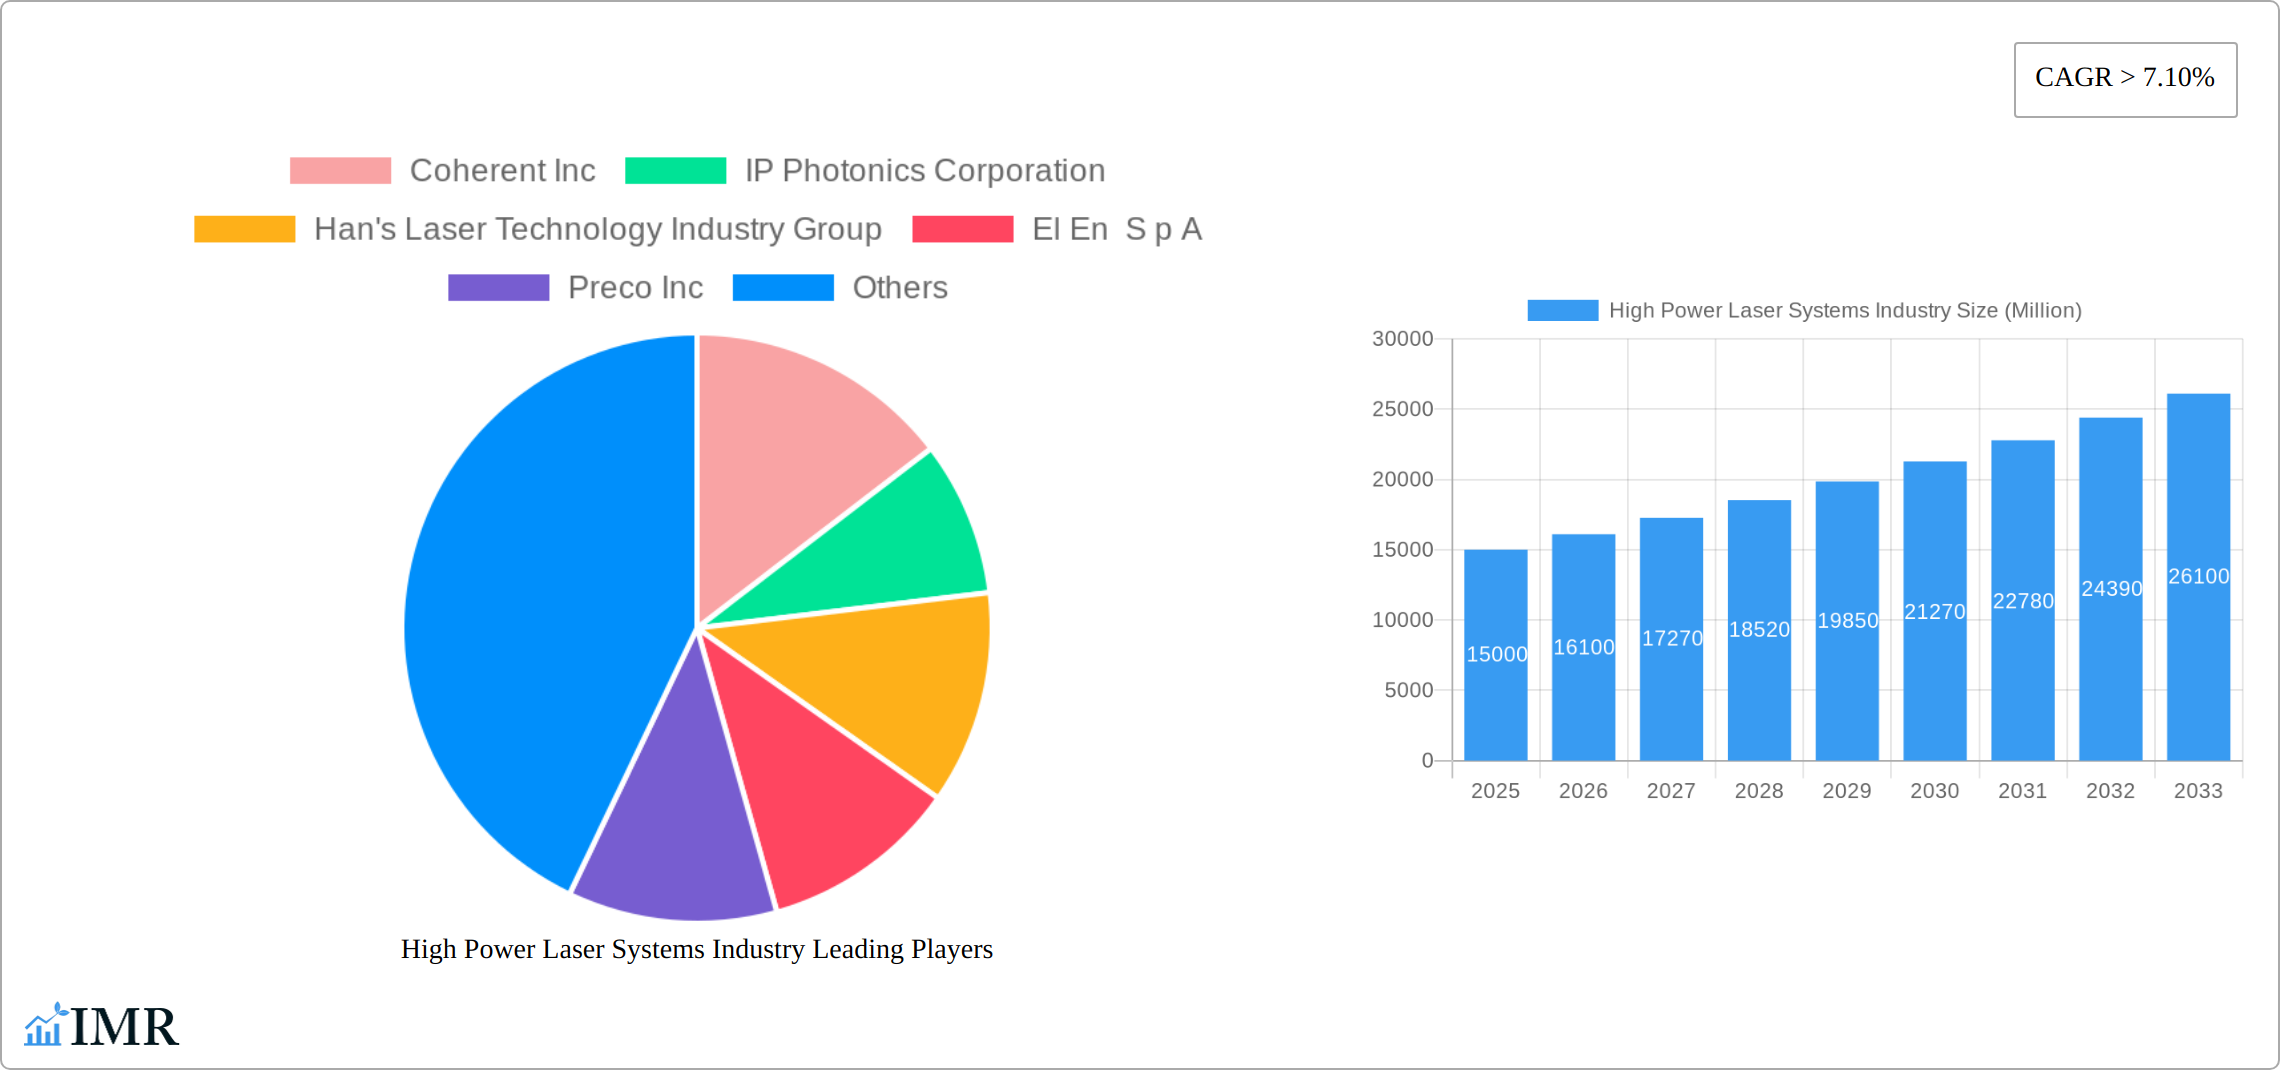
The high-power laser systems market is experiencing robust growth, projected to maintain a Compound Annual Growth Rate (CAGR) exceeding 7.10% from 2025 to 2033. This expansion is fueled by several key drivers. The increasing automation in manufacturing necessitates precise and efficient cutting, welding, and drilling solutions, driving demand for high-power lasers across various sectors. Furthermore, advancements in laser technology, particularly in fiber lasers, are leading to improved efficiency, reduced operational costs, and enhanced performance, making them attractive for diverse applications. The healthcare industry's adoption of laser-assisted surgeries and medical procedures is another significant contributor to market growth. Defense and research sectors also contribute substantially, utilizing high-power lasers in sophisticated systems and cutting-edge research projects. While challenges exist, such as high initial investment costs and the need for skilled operators, the overall market outlook remains positive due to the continued technological advancements and expanding applications across diverse industries.
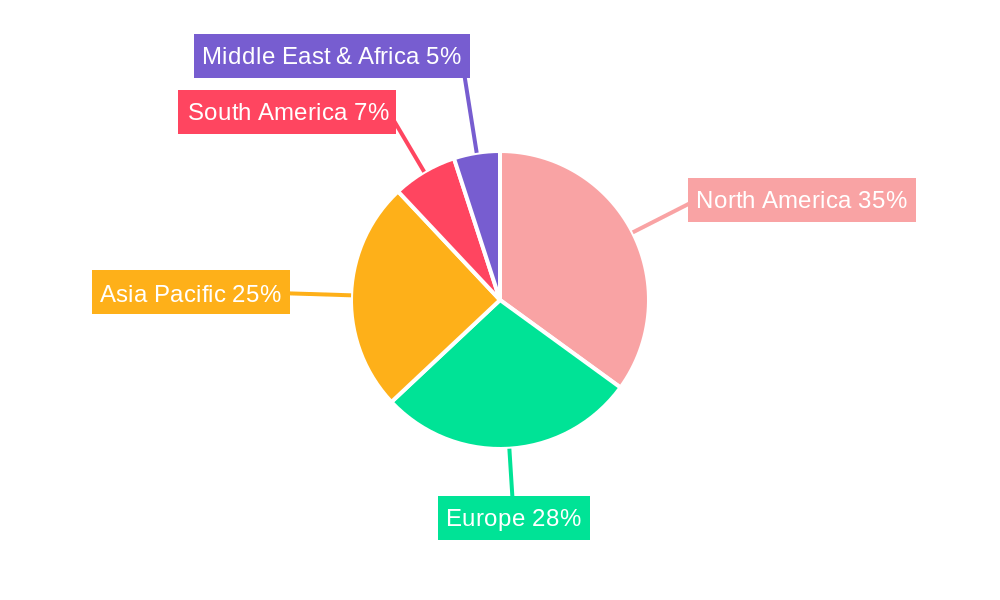
Segment-wise, the fiber laser type dominates the market due to its superior efficiency and versatility compared to CO2, excimer, and diode lasers. The manufacturing industry currently holds the largest market share, driven by the increasing adoption of laser-based solutions for material processing. However, growth in the healthcare and defense sectors is anticipated to be particularly strong in the coming years. Geographically, North America and Asia-Pacific are projected to be the leading regions, owing to substantial investments in advanced manufacturing and technological advancements, with China and the United States representing major growth pockets. Europe also demonstrates consistent growth fueled by strong industrial sectors and government initiatives promoting technological innovation. Competition in the market is intense, with major players such as Coherent Inc, IP Photonics Corporation, and TRUMPF SE + Co KG leading the charge, alongside several regional players. The market's future will likely be shaped by the ongoing development of even more powerful and efficient laser systems, along with the exploration of new applications across diverse fields.
High Power Laser Systems Industry Market Report: 2019-2033
This comprehensive report provides an in-depth analysis of the High Power Laser Systems market, encompassing market dynamics, growth trends, regional dominance, product landscape, key players, and future outlook. The study period spans 2019-2033, with 2025 as the base and estimated year. The report covers the parent market of industrial lasers and the child market segments of high power laser systems used across diverse applications. The market size is presented in million units.
High Power Laser Systems Industry Market Dynamics & Structure
This section analyzes the competitive landscape of the high-power laser systems market, considering factors like market concentration, technological advancements, regulatory influences, and market dynamics. The report delves into the impact of mergers and acquisitions (M&A) activity on market structure. The global market size was valued at xx million units in 2024 and is projected to reach xx million units by 2033.
- Market Concentration: The high-power laser systems market exhibits a moderately concentrated structure, with key players holding significant market share. The top 5 players account for approximately xx% of the global market (2024).
- Technological Innovation: Continuous innovation in laser technology, particularly in fiber lasers and high-power diode lasers, is a major driver. The development of more efficient and cost-effective laser sources is crucial.
- Regulatory Frameworks: Government regulations regarding safety and environmental standards influence market growth. Stringent safety regulations in certain industries (e.g., healthcare) can impact adoption rates.
- Competitive Product Substitutes: Alternative technologies, such as ultra-short pulse lasers and other machining methods, offer competitive pressures.
- End-User Demographics: The primary end-users are diverse, encompassing manufacturing, healthcare, defense, and research institutions. Growth in specific sectors such as automotive manufacturing and medical device manufacturing directly influences demand.
- M&A Trends: The high-power laser systems industry has witnessed a moderate number of M&A deals in recent years (xx deals in 2019-2024), primarily focused on consolidating market share and expanding technological capabilities. Larger players are actively acquiring smaller, specialized companies. Further consolidation is expected in the forecast period.
High Power Laser Systems Industry Growth Trends & Insights
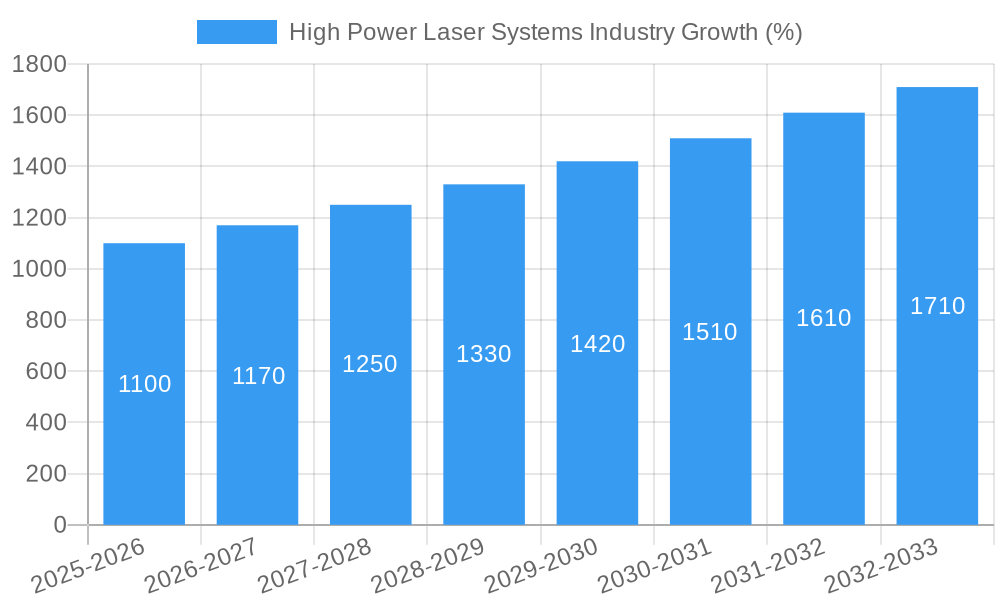
This section provides a detailed analysis of the historical and projected growth of the high-power laser systems market. Key growth drivers such as increasing automation in manufacturing, advancements in medical laser applications, and rising defense budgets are analyzed, along with the impact of technological disruptions and shifting consumer preferences. The market is expected to witness a CAGR of xx% during the forecast period (2025-2033). Market penetration in key end-user industries is expected to increase significantly, particularly in emerging economies.
The report details the evolving market size, the adoption rate across different sectors, the impact of disruptive technologies (e.g., advancements in laser beam quality and control systems), and changes in consumer behaviour. This in-depth analysis offers crucial insights into the market's trajectory and potential growth opportunities. Specific metrics, including CAGR, market penetration rates by industry segment, and regional adoption analysis, provide a comprehensive understanding of market dynamics.
Dominant Regions, Countries, or Segments in High Power Laser Systems Industry
This section pinpoints the leading regions, countries, and segments within the high-power laser systems market based on power output, laser type, industry application, and geographic distribution. It emphasizes factors driving market growth in these dominant areas, including economic conditions, technological advancements, government regulations, and industrial dynamics.
- Dominant Region: North America and Asia-Pacific are the leading regions, fueled by strong industrial growth and significant investments in advanced technologies.
- Dominant Laser Type: Fiber lasers dominate the market due to their high efficiency, reliability, and versatility.
- Dominant Industry: The manufacturing sector (automotive, electronics, metal fabrication) represents the largest end-use industry segment.
- Key Growth Drivers:
- Strong economic growth in key regions (e.g., China, USA, Germany).
- Government initiatives promoting automation and technological advancement.
- Increased demand for high-precision laser processing technologies across various sectors.
- Growing adoption of laser technology in emerging applications (e.g., additive manufacturing, 3D printing).
Analysis of market share and growth potential for each dominant region and segment provides a complete picture of the market's geographic distribution and segment-wise growth.
High Power Laser Systems Industry Product Landscape
High-power laser systems are characterized by diverse laser types (fiber, CO2, excimer, diode), varying power outputs (reaching up to xx kW), and applications across multiple sectors. Recent innovations focus on increasing power efficiency, beam quality, and system integration. Key selling points include higher precision, faster processing speeds, and increased operational reliability, impacting the overall production efficiency and reducing operational costs. Advancements include automated systems, integrated control software, and more user-friendly interfaces.
Key Drivers, Barriers & Challenges in High Power Laser Systems Industry
Key Drivers:
- Technological advancements in laser technology, improving efficiency and cost-effectiveness.
- Growing demand for automated manufacturing processes in diverse industries.
- Increasing adoption of laser systems in medical applications (e.g., laser surgery).
- Rising defense budgets driving demand for high-power laser systems in military applications.
Key Challenges and Restraints:
- High initial investment costs associated with high-power laser systems can hinder widespread adoption, particularly in smaller companies.
- Safety regulations and operational complexities need to be addressed to ensure safe and reliable operation.
- Potential supply chain disruptions can impact manufacturing and delivery times. The impact of this was seen in 2022-2023, with xx% reported delays in specific component deliveries.
- Intense competition among established players leads to pricing pressure and margin compression.
Emerging Opportunities in High Power Laser Systems Industry
- Expansion into emerging markets in Asia and South America offers substantial growth potential.
- Development of new applications in areas like micromachining and advanced materials processing.
- Growing demand for laser-based solutions in renewable energy applications (e.g., solar cell manufacturing).
- Increased focus on developing more environmentally friendly and energy-efficient laser systems.
Growth Accelerators in the High Power Laser Systems Industry Industry
Long-term growth in the high-power laser systems market is driven by continuous technological innovation, strategic partnerships, and expansion into new applications. Breakthroughs in laser technology, such as the development of higher-power, more efficient laser sources, will remain crucial. Strategic alliances between laser manufacturers and system integrators will broaden market reach and accelerate adoption. Expansion into new markets and applications, particularly in emerging economies and areas with significant industrialization, will further boost market growth.
Key Players Shaping the High Power Laser Systems Industry Market
- Coherent Inc
- IP Photonics Corporation
- Han's Laser Technology Industry Group
- El En S p A
- Preco Inc
- TRUMPF SE + Co KG
- Prima Industrie S p A
- Bystronic Laser AG
- HSG Laser
Notable Milestones in High Power Laser Systems Industry Sector
- April 2022: Bystronic Group launched flagship laser cutting systems with 20 kW laser power, significantly improving productivity and efficiency in sheet metal processing.
- June 2021: Han's Laser Smart Equipment Group commenced operations at its Tianjin plant, aiming to manufacture over 1000 laser equipment sets within 3-5 years.
In-Depth High Power Laser Systems Industry Market Outlook
The high-power laser systems market holds significant future potential, driven by continuous technological advancements, expanding applications across various industries, and increasing investment in automation and high-precision manufacturing. Strategic partnerships, expansion into emerging markets, and development of innovative laser-based solutions will shape market growth in the coming years. The market is poised for continued expansion, with strong growth expected across key segments. Opportunities lie in leveraging advanced technologies and expanding applications to meet the growing needs of diverse industries.
High Power Laser Systems Industry Segmentation
- 1. Cutting
- 2. Welding
- 3. Others (
- 4. China
- 5. Japan
- 6. Europe
- 7. North America
- 8. Rest of the World
High Power Laser Systems Industry Segmentation By Geography
-
1. North America
- 1.1. United States
- 1.2. Canada
- 1.3. Mexico
-
2. South America
- 2.1. Brazil
- 2.2. Argentina
- 2.3. Rest of South America
-
3. Europe
- 3.1. United Kingdom
- 3.2. Germany
- 3.3. France
- 3.4. Italy
- 3.5. Spain
- 3.6. Russia
- 3.7. Benelux
- 3.8. Nordics
- 3.9. Rest of Europe
-
4. Middle East & Africa
- 4.1. Turkey
- 4.2. Israel
- 4.3. GCC
- 4.4. North Africa
- 4.5. South Africa
- 4.6. Rest of Middle East & Africa
-
5. Asia Pacific
- 5.1. China
- 5.2. India
- 5.3. Japan
- 5.4. South Korea
- 5.5. ASEAN
- 5.6. Oceania
- 5.7. Rest of Asia Pacific
High Power Laser Systems Industry REPORT HIGHLIGHTS
| Aspects | Details |
|---|---|
| Study Period | 2019-2033 |
| Base Year | 2024 |
| Estimated Year | 2025 |
| Forecast Period | 2025-2033 |
| Historical Period | 2019-2024 |
| Growth Rate | CAGR of > 7.10% from 2019-2033 |
| Segmentation |
|
Table of Contents
- 1. Introduction
- 1.1. Research Scope
- 1.2. Market Segmentation
- 1.3. Research Methodology
- 1.4. Definitions and Assumptions
- 2. Executive Summary
- 2.1. Introduction
- 3. Market Dynamics
- 3.1. Introduction
- 3.2. Market Drivers
- 3.2.1. Growing demand for Fixed Broadband Services; Rising demand for 5G; Growth of IoT usage in Telecom
- 3.3. Market Restrains
- 3.3.1. Relatively Low Levels of Awareness and Regulatory Challenges
- 3.4. Market Trends
- 3.4.1. Welding Segment is Expected to Hold a Major Market Share
- 4. Market Factor Analysis
- 4.1. Porters Five Forces
- 4.2. Supply/Value Chain
- 4.3. PESTEL analysis
- 4.4. Market Entropy
- 4.5. Patent/Trademark Analysis
- 5. Global High Power Laser Systems Industry Analysis, Insights and Forecast, 2019-2031
- 5.1. Market Analysis, Insights and Forecast - by Cutting
- 5.2. Market Analysis, Insights and Forecast - by Welding
- 5.3. Market Analysis, Insights and Forecast - by Others (
- 5.4. Market Analysis, Insights and Forecast - by China
- 5.5. Market Analysis, Insights and Forecast - by Japan
- 5.6. Market Analysis, Insights and Forecast - by Europe
- 5.7. Market Analysis, Insights and Forecast - by North America
- 5.8. Market Analysis, Insights and Forecast - by Rest of the World
- 5.9. Market Analysis, Insights and Forecast - by Region
- 5.9.1. North America
- 5.9.2. South America
- 5.9.3. Europe
- 5.9.4. Middle East & Africa
- 5.9.5. Asia Pacific
- 5.1. Market Analysis, Insights and Forecast - by Cutting
- 6. North America High Power Laser Systems Industry Analysis, Insights and Forecast, 2019-2031
- 6.1. Market Analysis, Insights and Forecast - by Cutting
- 6.2. Market Analysis, Insights and Forecast - by Welding
- 6.3. Market Analysis, Insights and Forecast - by Others (
- 6.4. Market Analysis, Insights and Forecast - by China
- 6.5. Market Analysis, Insights and Forecast - by Japan
- 6.6. Market Analysis, Insights and Forecast - by Europe
- 6.7. Market Analysis, Insights and Forecast - by North America
- 6.8. Market Analysis, Insights and Forecast - by Rest of the World
- 6.1. Market Analysis, Insights and Forecast - by Cutting
- 7. South America High Power Laser Systems Industry Analysis, Insights and Forecast, 2019-2031
- 7.1. Market Analysis, Insights and Forecast - by Cutting
- 7.2. Market Analysis, Insights and Forecast - by Welding
- 7.3. Market Analysis, Insights and Forecast - by Others (
- 7.4. Market Analysis, Insights and Forecast - by China
- 7.5. Market Analysis, Insights and Forecast - by Japan
- 7.6. Market Analysis, Insights and Forecast - by Europe
- 7.7. Market Analysis, Insights and Forecast - by North America
- 7.8. Market Analysis, Insights and Forecast - by Rest of the World
- 7.1. Market Analysis, Insights and Forecast - by Cutting
- 8. Europe High Power Laser Systems Industry Analysis, Insights and Forecast, 2019-2031
- 8.1. Market Analysis, Insights and Forecast - by Cutting
- 8.2. Market Analysis, Insights and Forecast - by Welding
- 8.3. Market Analysis, Insights and Forecast - by Others (
- 8.4. Market Analysis, Insights and Forecast - by China
- 8.5. Market Analysis, Insights and Forecast - by Japan
- 8.6. Market Analysis, Insights and Forecast - by Europe
- 8.7. Market Analysis, Insights and Forecast - by North America
- 8.8. Market Analysis, Insights and Forecast - by Rest of the World
- 8.1. Market Analysis, Insights and Forecast - by Cutting
- 9. Middle East & Africa High Power Laser Systems Industry Analysis, Insights and Forecast, 2019-2031
- 9.1. Market Analysis, Insights and Forecast - by Cutting
- 9.2. Market Analysis, Insights and Forecast - by Welding
- 9.3. Market Analysis, Insights and Forecast - by Others (
- 9.4. Market Analysis, Insights and Forecast - by China
- 9.5. Market Analysis, Insights and Forecast - by Japan
- 9.6. Market Analysis, Insights and Forecast - by Europe
- 9.7. Market Analysis, Insights and Forecast - by North America
- 9.8. Market Analysis, Insights and Forecast - by Rest of the World
- 9.1. Market Analysis, Insights and Forecast - by Cutting
- 10. Asia Pacific High Power Laser Systems Industry Analysis, Insights and Forecast, 2019-2031
- 10.1. Market Analysis, Insights and Forecast - by Cutting
- 10.2. Market Analysis, Insights and Forecast - by Welding
- 10.3. Market Analysis, Insights and Forecast - by Others (
- 10.4. Market Analysis, Insights and Forecast - by China
- 10.5. Market Analysis, Insights and Forecast - by Japan
- 10.6. Market Analysis, Insights and Forecast - by Europe
- 10.7. Market Analysis, Insights and Forecast - by North America
- 10.8. Market Analysis, Insights and Forecast - by Rest of the World
- 10.1. Market Analysis, Insights and Forecast - by Cutting
- 11. North America High Power Laser Systems Industry Analysis, Insights and Forecast, 2019-2031
- 11.1. Market Analysis, Insights and Forecast - By Country/Sub-region
- 11.1.1 United States
- 11.1.2 Canada
- 11.1.3 Mexico
- 12. Asia Pacific High Power Laser Systems Industry Analysis, Insights and Forecast, 2019-2031
- 12.1. Market Analysis, Insights and Forecast - By Country/Sub-region
- 12.1.1 China
- 12.1.2 Japan
- 12.1.3 India
- 12.1.4 South Korea
- 12.1.5 Taiwan
- 12.1.6 Australia
- 12.1.7 Rest of Asia-Pacific
- 13. Europe High Power Laser Systems Industry Analysis, Insights and Forecast, 2019-2031
- 13.1. Market Analysis, Insights and Forecast - By Country/Sub-region
- 13.1.1 Germany
- 13.1.2 France
- 13.1.3 Italy
- 13.1.4 United Kingdom
- 13.1.5 Netherlands
- 13.1.6 Rest of Europe
- 14. South America High Power Laser Systems Industry Analysis, Insights and Forecast, 2019-2031
- 14.1. Market Analysis, Insights and Forecast - By Country/Sub-region
- 14.1.1 Brazil
- 14.1.2 Argentina
- 14.1.3 Rest of South America
- 15. Middle East & Africa High Power Laser Systems Industry Analysis, Insights and Forecast, 2019-2031
- 15.1. Market Analysis, Insights and Forecast - By Country/Sub-region
- 15.1.1 UAE
- 15.1.2 South Africa
- 15.1.3 Saudi Arabia
- 15.1.4 Rest of MEA
- 16. Competitive Analysis
- 16.1. Global Market Share Analysis 2024
- 16.2. Company Profiles
- 16.2.1 Coherent Inc
- 16.2.1.1. Overview
- 16.2.1.2. Products
- 16.2.1.3. SWOT Analysis
- 16.2.1.4. Recent Developments
- 16.2.1.5. Financials (Based on Availability)
- 16.2.2 IP Photonics Corporation
- 16.2.2.1. Overview
- 16.2.2.2. Products
- 16.2.2.3. SWOT Analysis
- 16.2.2.4. Recent Developments
- 16.2.2.5. Financials (Based on Availability)
- 16.2.3 Han's Laser Technology Industry Group
- 16.2.3.1. Overview
- 16.2.3.2. Products
- 16.2.3.3. SWOT Analysis
- 16.2.3.4. Recent Developments
- 16.2.3.5. Financials (Based on Availability)
- 16.2.4 El En S p A
- 16.2.4.1. Overview
- 16.2.4.2. Products
- 16.2.4.3. SWOT Analysis
- 16.2.4.4. Recent Developments
- 16.2.4.5. Financials (Based on Availability)
- 16.2.5 Preco Inc
- 16.2.5.1. Overview
- 16.2.5.2. Products
- 16.2.5.3. SWOT Analysis
- 16.2.5.4. Recent Developments
- 16.2.5.5. Financials (Based on Availability)
- 16.2.6 TRUMPF SE + Co KG
- 16.2.6.1. Overview
- 16.2.6.2. Products
- 16.2.6.3. SWOT Analysis
- 16.2.6.4. Recent Developments
- 16.2.6.5. Financials (Based on Availability)
- 16.2.7 Prima Industrie S p A
- 16.2.7.1. Overview
- 16.2.7.2. Products
- 16.2.7.3. SWOT Analysis
- 16.2.7.4. Recent Developments
- 16.2.7.5. Financials (Based on Availability)
- 16.2.8 Bystronic Laser AG
- 16.2.8.1. Overview
- 16.2.8.2. Products
- 16.2.8.3. SWOT Analysis
- 16.2.8.4. Recent Developments
- 16.2.8.5. Financials (Based on Availability)
- 16.2.9 HSG Laser*List Not Exhaustive
- 16.2.9.1. Overview
- 16.2.9.2. Products
- 16.2.9.3. SWOT Analysis
- 16.2.9.4. Recent Developments
- 16.2.9.5. Financials (Based on Availability)
- 16.2.1 Coherent Inc
List of Figures
- Figure 1: Global High Power Laser Systems Industry Revenue Breakdown (Million, %) by Region 2024 & 2032
- Figure 2: North America High Power Laser Systems Industry Revenue (Million), by Country 2024 & 2032
- Figure 3: North America High Power Laser Systems Industry Revenue Share (%), by Country 2024 & 2032
- Figure 4: Asia Pacific High Power Laser Systems Industry Revenue (Million), by Country 2024 & 2032
- Figure 5: Asia Pacific High Power Laser Systems Industry Revenue Share (%), by Country 2024 & 2032
- Figure 6: Europe High Power Laser Systems Industry Revenue (Million), by Country 2024 & 2032
- Figure 7: Europe High Power Laser Systems Industry Revenue Share (%), by Country 2024 & 2032
- Figure 8: South America High Power Laser Systems Industry Revenue (Million), by Country 2024 & 2032
- Figure 9: South America High Power Laser Systems Industry Revenue Share (%), by Country 2024 & 2032
- Figure 10: Middle East & Africa High Power Laser Systems Industry Revenue (Million), by Country 2024 & 2032
- Figure 11: Middle East & Africa High Power Laser Systems Industry Revenue Share (%), by Country 2024 & 2032
- Figure 12: North America High Power Laser Systems Industry Revenue (Million), by Cutting 2024 & 2032
- Figure 13: North America High Power Laser Systems Industry Revenue Share (%), by Cutting 2024 & 2032
- Figure 14: North America High Power Laser Systems Industry Revenue (Million), by Welding 2024 & 2032
- Figure 15: North America High Power Laser Systems Industry Revenue Share (%), by Welding 2024 & 2032
- Figure 16: North America High Power Laser Systems Industry Revenue (Million), by Others ( 2024 & 2032
- Figure 17: North America High Power Laser Systems Industry Revenue Share (%), by Others ( 2024 & 2032
- Figure 18: North America High Power Laser Systems Industry Revenue (Million), by China 2024 & 2032
- Figure 19: North America High Power Laser Systems Industry Revenue Share (%), by China 2024 & 2032
- Figure 20: North America High Power Laser Systems Industry Revenue (Million), by Japan 2024 & 2032
- Figure 21: North America High Power Laser Systems Industry Revenue Share (%), by Japan 2024 & 2032
- Figure 22: North America High Power Laser Systems Industry Revenue (Million), by Europe 2024 & 2032
- Figure 23: North America High Power Laser Systems Industry Revenue Share (%), by Europe 2024 & 2032
- Figure 24: North America High Power Laser Systems Industry Revenue (Million), by North America 2024 & 2032
- Figure 25: North America High Power Laser Systems Industry Revenue Share (%), by North America 2024 & 2032
- Figure 26: North America High Power Laser Systems Industry Revenue (Million), by Rest of the World 2024 & 2032
- Figure 27: North America High Power Laser Systems Industry Revenue Share (%), by Rest of the World 2024 & 2032
- Figure 28: North America High Power Laser Systems Industry Revenue (Million), by Country 2024 & 2032
- Figure 29: North America High Power Laser Systems Industry Revenue Share (%), by Country 2024 & 2032
- Figure 30: South America High Power Laser Systems Industry Revenue (Million), by Cutting 2024 & 2032
- Figure 31: South America High Power Laser Systems Industry Revenue Share (%), by Cutting 2024 & 2032
- Figure 32: South America High Power Laser Systems Industry Revenue (Million), by Welding 2024 & 2032
- Figure 33: South America High Power Laser Systems Industry Revenue Share (%), by Welding 2024 & 2032
- Figure 34: South America High Power Laser Systems Industry Revenue (Million), by Others ( 2024 & 2032
- Figure 35: South America High Power Laser Systems Industry Revenue Share (%), by Others ( 2024 & 2032
- Figure 36: South America High Power Laser Systems Industry Revenue (Million), by China 2024 & 2032
- Figure 37: South America High Power Laser Systems Industry Revenue Share (%), by China 2024 & 2032
- Figure 38: South America High Power Laser Systems Industry Revenue (Million), by Japan 2024 & 2032
- Figure 39: South America High Power Laser Systems Industry Revenue Share (%), by Japan 2024 & 2032
- Figure 40: South America High Power Laser Systems Industry Revenue (Million), by Europe 2024 & 2032
- Figure 41: South America High Power Laser Systems Industry Revenue Share (%), by Europe 2024 & 2032
- Figure 42: South America High Power Laser Systems Industry Revenue (Million), by North America 2024 & 2032
- Figure 43: South America High Power Laser Systems Industry Revenue Share (%), by North America 2024 & 2032
- Figure 44: South America High Power Laser Systems Industry Revenue (Million), by Rest of the World 2024 & 2032
- Figure 45: South America High Power Laser Systems Industry Revenue Share (%), by Rest of the World 2024 & 2032
- Figure 46: South America High Power Laser Systems Industry Revenue (Million), by Country 2024 & 2032
- Figure 47: South America High Power Laser Systems Industry Revenue Share (%), by Country 2024 & 2032
- Figure 48: Europe High Power Laser Systems Industry Revenue (Million), by Cutting 2024 & 2032
- Figure 49: Europe High Power Laser Systems Industry Revenue Share (%), by Cutting 2024 & 2032
- Figure 50: Europe High Power Laser Systems Industry Revenue (Million), by Welding 2024 & 2032
- Figure 51: Europe High Power Laser Systems Industry Revenue Share (%), by Welding 2024 & 2032
- Figure 52: Europe High Power Laser Systems Industry Revenue (Million), by Others ( 2024 & 2032
- Figure 53: Europe High Power Laser Systems Industry Revenue Share (%), by Others ( 2024 & 2032
- Figure 54: Europe High Power Laser Systems Industry Revenue (Million), by China 2024 & 2032
- Figure 55: Europe High Power Laser Systems Industry Revenue Share (%), by China 2024 & 2032
- Figure 56: Europe High Power Laser Systems Industry Revenue (Million), by Japan 2024 & 2032
- Figure 57: Europe High Power Laser Systems Industry Revenue Share (%), by Japan 2024 & 2032
- Figure 58: Europe High Power Laser Systems Industry Revenue (Million), by Europe 2024 & 2032
- Figure 59: Europe High Power Laser Systems Industry Revenue Share (%), by Europe 2024 & 2032
- Figure 60: Europe High Power Laser Systems Industry Revenue (Million), by North America 2024 & 2032
- Figure 61: Europe High Power Laser Systems Industry Revenue Share (%), by North America 2024 & 2032
- Figure 62: Europe High Power Laser Systems Industry Revenue (Million), by Rest of the World 2024 & 2032
- Figure 63: Europe High Power Laser Systems Industry Revenue Share (%), by Rest of the World 2024 & 2032
- Figure 64: Europe High Power Laser Systems Industry Revenue (Million), by Country 2024 & 2032
- Figure 65: Europe High Power Laser Systems Industry Revenue Share (%), by Country 2024 & 2032
- Figure 66: Middle East & Africa High Power Laser Systems Industry Revenue (Million), by Cutting 2024 & 2032
- Figure 67: Middle East & Africa High Power Laser Systems Industry Revenue Share (%), by Cutting 2024 & 2032
- Figure 68: Middle East & Africa High Power Laser Systems Industry Revenue (Million), by Welding 2024 & 2032
- Figure 69: Middle East & Africa High Power Laser Systems Industry Revenue Share (%), by Welding 2024 & 2032
- Figure 70: Middle East & Africa High Power Laser Systems Industry Revenue (Million), by Others ( 2024 & 2032
- Figure 71: Middle East & Africa High Power Laser Systems Industry Revenue Share (%), by Others ( 2024 & 2032
- Figure 72: Middle East & Africa High Power Laser Systems Industry Revenue (Million), by China 2024 & 2032
- Figure 73: Middle East & Africa High Power Laser Systems Industry Revenue Share (%), by China 2024 & 2032
- Figure 74: Middle East & Africa High Power Laser Systems Industry Revenue (Million), by Japan 2024 & 2032
- Figure 75: Middle East & Africa High Power Laser Systems Industry Revenue Share (%), by Japan 2024 & 2032
- Figure 76: Middle East & Africa High Power Laser Systems Industry Revenue (Million), by Europe 2024 & 2032
- Figure 77: Middle East & Africa High Power Laser Systems Industry Revenue Share (%), by Europe 2024 & 2032
- Figure 78: Middle East & Africa High Power Laser Systems Industry Revenue (Million), by North America 2024 & 2032
- Figure 79: Middle East & Africa High Power Laser Systems Industry Revenue Share (%), by North America 2024 & 2032
- Figure 80: Middle East & Africa High Power Laser Systems Industry Revenue (Million), by Rest of the World 2024 & 2032
- Figure 81: Middle East & Africa High Power Laser Systems Industry Revenue Share (%), by Rest of the World 2024 & 2032
- Figure 82: Middle East & Africa High Power Laser Systems Industry Revenue (Million), by Country 2024 & 2032
- Figure 83: Middle East & Africa High Power Laser Systems Industry Revenue Share (%), by Country 2024 & 2032
- Figure 84: Asia Pacific High Power Laser Systems Industry Revenue (Million), by Cutting 2024 & 2032
- Figure 85: Asia Pacific High Power Laser Systems Industry Revenue Share (%), by Cutting 2024 & 2032
- Figure 86: Asia Pacific High Power Laser Systems Industry Revenue (Million), by Welding 2024 & 2032
- Figure 87: Asia Pacific High Power Laser Systems Industry Revenue Share (%), by Welding 2024 & 2032
- Figure 88: Asia Pacific High Power Laser Systems Industry Revenue (Million), by Others ( 2024 & 2032
- Figure 89: Asia Pacific High Power Laser Systems Industry Revenue Share (%), by Others ( 2024 & 2032
- Figure 90: Asia Pacific High Power Laser Systems Industry Revenue (Million), by China 2024 & 2032
- Figure 91: Asia Pacific High Power Laser Systems Industry Revenue Share (%), by China 2024 & 2032
- Figure 92: Asia Pacific High Power Laser Systems Industry Revenue (Million), by Japan 2024 & 2032
- Figure 93: Asia Pacific High Power Laser Systems Industry Revenue Share (%), by Japan 2024 & 2032
- Figure 94: Asia Pacific High Power Laser Systems Industry Revenue (Million), by Europe 2024 & 2032
- Figure 95: Asia Pacific High Power Laser Systems Industry Revenue Share (%), by Europe 2024 & 2032
- Figure 96: Asia Pacific High Power Laser Systems Industry Revenue (Million), by North America 2024 & 2032
- Figure 97: Asia Pacific High Power Laser Systems Industry Revenue Share (%), by North America 2024 & 2032
- Figure 98: Asia Pacific High Power Laser Systems Industry Revenue (Million), by Rest of the World 2024 & 2032
- Figure 99: Asia Pacific High Power Laser Systems Industry Revenue Share (%), by Rest of the World 2024 & 2032
- Figure 100: Asia Pacific High Power Laser Systems Industry Revenue (Million), by Country 2024 & 2032
- Figure 101: Asia Pacific High Power Laser Systems Industry Revenue Share (%), by Country 2024 & 2032
List of Tables
- Table 1: Global High Power Laser Systems Industry Revenue Million Forecast, by Region 2019 & 2032
- Table 2: Global High Power Laser Systems Industry Revenue Million Forecast, by Cutting 2019 & 2032
- Table 3: Global High Power Laser Systems Industry Revenue Million Forecast, by Welding 2019 & 2032
- Table 4: Global High Power Laser Systems Industry Revenue Million Forecast, by Others ( 2019 & 2032
- Table 5: Global High Power Laser Systems Industry Revenue Million Forecast, by China 2019 & 2032
- Table 6: Global High Power Laser Systems Industry Revenue Million Forecast, by Japan 2019 & 2032
- Table 7: Global High Power Laser Systems Industry Revenue Million Forecast, by Europe 2019 & 2032
- Table 8: Global High Power Laser Systems Industry Revenue Million Forecast, by North America 2019 & 2032
- Table 9: Global High Power Laser Systems Industry Revenue Million Forecast, by Rest of the World 2019 & 2032
- Table 10: Global High Power Laser Systems Industry Revenue Million Forecast, by Region 2019 & 2032
- Table 11: Global High Power Laser Systems Industry Revenue Million Forecast, by Country 2019 & 2032
- Table 12: United States High Power Laser Systems Industry Revenue (Million) Forecast, by Application 2019 & 2032
- Table 13: Canada High Power Laser Systems Industry Revenue (Million) Forecast, by Application 2019 & 2032
- Table 14: Mexico High Power Laser Systems Industry Revenue (Million) Forecast, by Application 2019 & 2032
- Table 15: Global High Power Laser Systems Industry Revenue Million Forecast, by Country 2019 & 2032
- Table 16: China High Power Laser Systems Industry Revenue (Million) Forecast, by Application 2019 & 2032
- Table 17: Japan High Power Laser Systems Industry Revenue (Million) Forecast, by Application 2019 & 2032
- Table 18: India High Power Laser Systems Industry Revenue (Million) Forecast, by Application 2019 & 2032
- Table 19: South Korea High Power Laser Systems Industry Revenue (Million) Forecast, by Application 2019 & 2032
- Table 20: Taiwan High Power Laser Systems Industry Revenue (Million) Forecast, by Application 2019 & 2032
- Table 21: Australia High Power Laser Systems Industry Revenue (Million) Forecast, by Application 2019 & 2032
- Table 22: Rest of Asia-Pacific High Power Laser Systems Industry Revenue (Million) Forecast, by Application 2019 & 2032
- Table 23: Global High Power Laser Systems Industry Revenue Million Forecast, by Country 2019 & 2032
- Table 24: Germany High Power Laser Systems Industry Revenue (Million) Forecast, by Application 2019 & 2032
- Table 25: France High Power Laser Systems Industry Revenue (Million) Forecast, by Application 2019 & 2032
- Table 26: Italy High Power Laser Systems Industry Revenue (Million) Forecast, by Application 2019 & 2032
- Table 27: United Kingdom High Power Laser Systems Industry Revenue (Million) Forecast, by Application 2019 & 2032
- Table 28: Netherlands High Power Laser Systems Industry Revenue (Million) Forecast, by Application 2019 & 2032
- Table 29: Rest of Europe High Power Laser Systems Industry Revenue (Million) Forecast, by Application 2019 & 2032
- Table 30: Global High Power Laser Systems Industry Revenue Million Forecast, by Country 2019 & 2032
- Table 31: Brazil High Power Laser Systems Industry Revenue (Million) Forecast, by Application 2019 & 2032
- Table 32: Argentina High Power Laser Systems Industry Revenue (Million) Forecast, by Application 2019 & 2032
- Table 33: Rest of South America High Power Laser Systems Industry Revenue (Million) Forecast, by Application 2019 & 2032
- Table 34: Global High Power Laser Systems Industry Revenue Million Forecast, by Country 2019 & 2032
- Table 35: UAE High Power Laser Systems Industry Revenue (Million) Forecast, by Application 2019 & 2032
- Table 36: South Africa High Power Laser Systems Industry Revenue (Million) Forecast, by Application 2019 & 2032
- Table 37: Saudi Arabia High Power Laser Systems Industry Revenue (Million) Forecast, by Application 2019 & 2032
- Table 38: Rest of MEA High Power Laser Systems Industry Revenue (Million) Forecast, by Application 2019 & 2032
- Table 39: Global High Power Laser Systems Industry Revenue Million Forecast, by Cutting 2019 & 2032
- Table 40: Global High Power Laser Systems Industry Revenue Million Forecast, by Welding 2019 & 2032
- Table 41: Global High Power Laser Systems Industry Revenue Million Forecast, by Others ( 2019 & 2032
- Table 42: Global High Power Laser Systems Industry Revenue Million Forecast, by China 2019 & 2032
- Table 43: Global High Power Laser Systems Industry Revenue Million Forecast, by Japan 2019 & 2032
- Table 44: Global High Power Laser Systems Industry Revenue Million Forecast, by Europe 2019 & 2032
- Table 45: Global High Power Laser Systems Industry Revenue Million Forecast, by North America 2019 & 2032
- Table 46: Global High Power Laser Systems Industry Revenue Million Forecast, by Rest of the World 2019 & 2032
- Table 47: Global High Power Laser Systems Industry Revenue Million Forecast, by Country 2019 & 2032
- Table 48: United States High Power Laser Systems Industry Revenue (Million) Forecast, by Application 2019 & 2032
- Table 49: Canada High Power Laser Systems Industry Revenue (Million) Forecast, by Application 2019 & 2032
- Table 50: Mexico High Power Laser Systems Industry Revenue (Million) Forecast, by Application 2019 & 2032
- Table 51: Global High Power Laser Systems Industry Revenue Million Forecast, by Cutting 2019 & 2032
- Table 52: Global High Power Laser Systems Industry Revenue Million Forecast, by Welding 2019 & 2032
- Table 53: Global High Power Laser Systems Industry Revenue Million Forecast, by Others ( 2019 & 2032
- Table 54: Global High Power Laser Systems Industry Revenue Million Forecast, by China 2019 & 2032
- Table 55: Global High Power Laser Systems Industry Revenue Million Forecast, by Japan 2019 & 2032
- Table 56: Global High Power Laser Systems Industry Revenue Million Forecast, by Europe 2019 & 2032
- Table 57: Global High Power Laser Systems Industry Revenue Million Forecast, by North America 2019 & 2032
- Table 58: Global High Power Laser Systems Industry Revenue Million Forecast, by Rest of the World 2019 & 2032
- Table 59: Global High Power Laser Systems Industry Revenue Million Forecast, by Country 2019 & 2032
- Table 60: Brazil High Power Laser Systems Industry Revenue (Million) Forecast, by Application 2019 & 2032
- Table 61: Argentina High Power Laser Systems Industry Revenue (Million) Forecast, by Application 2019 & 2032
- Table 62: Rest of South America High Power Laser Systems Industry Revenue (Million) Forecast, by Application 2019 & 2032
- Table 63: Global High Power Laser Systems Industry Revenue Million Forecast, by Cutting 2019 & 2032
- Table 64: Global High Power Laser Systems Industry Revenue Million Forecast, by Welding 2019 & 2032
- Table 65: Global High Power Laser Systems Industry Revenue Million Forecast, by Others ( 2019 & 2032
- Table 66: Global High Power Laser Systems Industry Revenue Million Forecast, by China 2019 & 2032
- Table 67: Global High Power Laser Systems Industry Revenue Million Forecast, by Japan 2019 & 2032
- Table 68: Global High Power Laser Systems Industry Revenue Million Forecast, by Europe 2019 & 2032
- Table 69: Global High Power Laser Systems Industry Revenue Million Forecast, by North America 2019 & 2032
- Table 70: Global High Power Laser Systems Industry Revenue Million Forecast, by Rest of the World 2019 & 2032
- Table 71: Global High Power Laser Systems Industry Revenue Million Forecast, by Country 2019 & 2032
- Table 72: United Kingdom High Power Laser Systems Industry Revenue (Million) Forecast, by Application 2019 & 2032
- Table 73: Germany High Power Laser Systems Industry Revenue (Million) Forecast, by Application 2019 & 2032
- Table 74: France High Power Laser Systems Industry Revenue (Million) Forecast, by Application 2019 & 2032
- Table 75: Italy High Power Laser Systems Industry Revenue (Million) Forecast, by Application 2019 & 2032
- Table 76: Spain High Power Laser Systems Industry Revenue (Million) Forecast, by Application 2019 & 2032
- Table 77: Russia High Power Laser Systems Industry Revenue (Million) Forecast, by Application 2019 & 2032
- Table 78: Benelux High Power Laser Systems Industry Revenue (Million) Forecast, by Application 2019 & 2032
- Table 79: Nordics High Power Laser Systems Industry Revenue (Million) Forecast, by Application 2019 & 2032
- Table 80: Rest of Europe High Power Laser Systems Industry Revenue (Million) Forecast, by Application 2019 & 2032
- Table 81: Global High Power Laser Systems Industry Revenue Million Forecast, by Cutting 2019 & 2032
- Table 82: Global High Power Laser Systems Industry Revenue Million Forecast, by Welding 2019 & 2032
- Table 83: Global High Power Laser Systems Industry Revenue Million Forecast, by Others ( 2019 & 2032
- Table 84: Global High Power Laser Systems Industry Revenue Million Forecast, by China 2019 & 2032
- Table 85: Global High Power Laser Systems Industry Revenue Million Forecast, by Japan 2019 & 2032
- Table 86: Global High Power Laser Systems Industry Revenue Million Forecast, by Europe 2019 & 2032
- Table 87: Global High Power Laser Systems Industry Revenue Million Forecast, by North America 2019 & 2032
- Table 88: Global High Power Laser Systems Industry Revenue Million Forecast, by Rest of the World 2019 & 2032
- Table 89: Global High Power Laser Systems Industry Revenue Million Forecast, by Country 2019 & 2032
- Table 90: Turkey High Power Laser Systems Industry Revenue (Million) Forecast, by Application 2019 & 2032
- Table 91: Israel High Power Laser Systems Industry Revenue (Million) Forecast, by Application 2019 & 2032
- Table 92: GCC High Power Laser Systems Industry Revenue (Million) Forecast, by Application 2019 & 2032
- Table 93: North Africa High Power Laser Systems Industry Revenue (Million) Forecast, by Application 2019 & 2032
- Table 94: South Africa High Power Laser Systems Industry Revenue (Million) Forecast, by Application 2019 & 2032
- Table 95: Rest of Middle East & Africa High Power Laser Systems Industry Revenue (Million) Forecast, by Application 2019 & 2032
- Table 96: Global High Power Laser Systems Industry Revenue Million Forecast, by Cutting 2019 & 2032
- Table 97: Global High Power Laser Systems Industry Revenue Million Forecast, by Welding 2019 & 2032
- Table 98: Global High Power Laser Systems Industry Revenue Million Forecast, by Others ( 2019 & 2032
- Table 99: Global High Power Laser Systems Industry Revenue Million Forecast, by China 2019 & 2032
- Table 100: Global High Power Laser Systems Industry Revenue Million Forecast, by Japan 2019 & 2032
- Table 101: Global High Power Laser Systems Industry Revenue Million Forecast, by Europe 2019 & 2032
- Table 102: Global High Power Laser Systems Industry Revenue Million Forecast, by North America 2019 & 2032
- Table 103: Global High Power Laser Systems Industry Revenue Million Forecast, by Rest of the World 2019 & 2032
- Table 104: Global High Power Laser Systems Industry Revenue Million Forecast, by Country 2019 & 2032
- Table 105: China High Power Laser Systems Industry Revenue (Million) Forecast, by Application 2019 & 2032
- Table 106: India High Power Laser Systems Industry Revenue (Million) Forecast, by Application 2019 & 2032
- Table 107: Japan High Power Laser Systems Industry Revenue (Million) Forecast, by Application 2019 & 2032
- Table 108: South Korea High Power Laser Systems Industry Revenue (Million) Forecast, by Application 2019 & 2032
- Table 109: ASEAN High Power Laser Systems Industry Revenue (Million) Forecast, by Application 2019 & 2032
- Table 110: Oceania High Power Laser Systems Industry Revenue (Million) Forecast, by Application 2019 & 2032
- Table 111: Rest of Asia Pacific High Power Laser Systems Industry Revenue (Million) Forecast, by Application 2019 & 2032
Frequently Asked Questions
1. What is the projected Compound Annual Growth Rate (CAGR) of the High Power Laser Systems Industry?
The projected CAGR is approximately > 7.10%.
2. Which companies are prominent players in the High Power Laser Systems Industry?
Key companies in the market include Coherent Inc, IP Photonics Corporation, Han's Laser Technology Industry Group, El En S p A, Preco Inc, TRUMPF SE + Co KG, Prima Industrie S p A, Bystronic Laser AG, HSG Laser*List Not Exhaustive.
3. What are the main segments of the High Power Laser Systems Industry?
The market segments include Cutting, Welding, Others (, China, Japan, Europe, North America, Rest of the World.
4. Can you provide details about the market size?
The market size is estimated to be USD XX Million as of 2022.
5. What are some drivers contributing to market growth?
Growing demand for Fixed Broadband Services; Rising demand for 5G; Growth of IoT usage in Telecom.
6. What are the notable trends driving market growth?
Welding Segment is Expected to Hold a Major Market Share.
7. Are there any restraints impacting market growth?
Relatively Low Levels of Awareness and Regulatory Challenges.
8. Can you provide examples of recent developments in the market?
April 2022 - Bystronic Group's flagship laser cutting systems were made available with 20 kilowatts of laser power and an optimized cutting process. The high-end fiber laser represents high-precision Bystronic technology, a reliable cutting process with extremely high laser outputs, and a wide range of applications. This enables sheet metal processing companies to take another significant step forward in productivity and efficiency, as claimed by the company.
9. What pricing options are available for accessing the report?
Pricing options include single-user, multi-user, and enterprise licenses priced at USD 4750, USD 5250, and USD 8750 respectively.
10. Is the market size provided in terms of value or volume?
The market size is provided in terms of value, measured in Million.
11. Are there any specific market keywords associated with the report?
Yes, the market keyword associated with the report is "High Power Laser Systems Industry," which aids in identifying and referencing the specific market segment covered.
12. How do I determine which pricing option suits my needs best?
The pricing options vary based on user requirements and access needs. Individual users may opt for single-user licenses, while businesses requiring broader access may choose multi-user or enterprise licenses for cost-effective access to the report.
13. Are there any additional resources or data provided in the High Power Laser Systems Industry report?
While the report offers comprehensive insights, it's advisable to review the specific contents or supplementary materials provided to ascertain if additional resources or data are available.
14. How can I stay updated on further developments or reports in the High Power Laser Systems Industry?
To stay informed about further developments, trends, and reports in the High Power Laser Systems Industry, consider subscribing to industry newsletters, following relevant companies and organizations, or regularly checking reputable industry news sources and publications.
Methodology
Step 1 - Identification of Relevant Samples Size from Population Database


Step 2 - Approaches for Defining Global Market Size (Value, Volume* & Price*)

Note*: In applicable scenarios
Step 3 - Data Sources
Primary Research
- Web Analytics
- Survey Reports
- Research Institute
- Latest Research Reports
- Opinion Leaders
Secondary Research
- Annual Reports
- White Paper
- Latest Press Release
- Industry Association
- Paid Database
- Investor Presentations

Step 4 - Data Triangulation
Involves using different sources of information in order to increase the validity of a study
These sources are likely to be stakeholders in a program - participants, other researchers, program staff, other community members, and so on.
Then we put all data in single framework & apply various statistical tools to find out the dynamic on the market.
During the analysis stage, feedback from the stakeholder groups would be compared to determine areas of agreement as well as areas of divergence
