

Key Insights
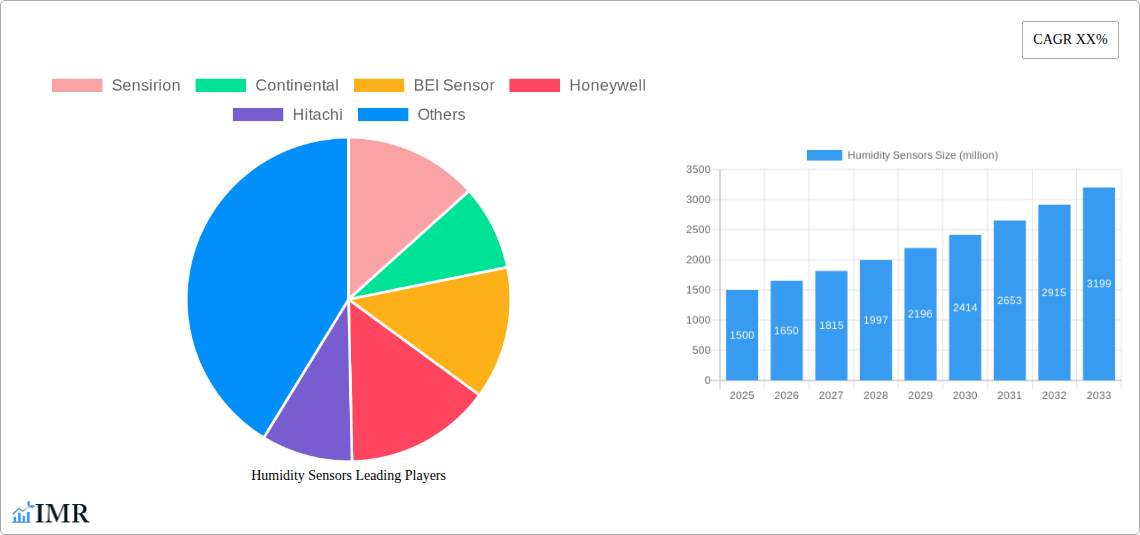
The global humidity sensor market is experiencing robust growth, driven by increasing demand across diverse sectors. The market's expansion is fueled by several key factors, including the proliferation of smart devices, the rise of IoT applications in diverse sectors (like healthcare, agriculture, and automotive), and the growing need for precise environmental monitoring in various industrial processes. Advancements in sensor technology, leading to improved accuracy, miniaturization, and lower power consumption, further contribute to market expansion. While challenges remain, such as cost constraints for certain advanced sensor types and the need for robust data security in connected applications, the overall market outlook remains positive. The projected Compound Annual Growth Rate (CAGR) indicates a substantial increase in market value over the forecast period (2025-2033). This growth is expected to be distributed across various segments, including capacitive, resistive, and other humidity sensor types. Leading market players, such as Sensirion, Continental, and Honeywell, are actively engaged in innovation and strategic partnerships to maintain their competitive edge. The regional distribution of the market is likely to show significant contributions from North America and Europe, driven by established technological infrastructure and high adoption rates across multiple industries.
The competitive landscape is highly dynamic, with established players continuously innovating to offer high-performance, cost-effective solutions. The market is segmented based on sensor type, application, and geography. The growing adoption of cloud-based data analytics platforms further complements the growth of humidity sensors. This facilitates better data management and insights, allowing businesses to optimize their operations and make better informed decisions. Future growth will be significantly influenced by government regulations promoting energy efficiency and environmental monitoring, as well as the development of advanced sensor technologies, including those with improved sensitivity and reliability in harsh environmental conditions. The integration of AI and machine learning capabilities into humidity sensors promises further market expansion by enabling advanced data analysis and predictive maintenance.
Humidity Sensors Market Report: 2019-2033
This comprehensive report provides an in-depth analysis of the global humidity sensors market, encompassing market dynamics, growth trends, regional segmentation, product landscape, key players, and future outlook. The study period covers 2019-2033, with 2025 as the base and estimated year. The forecast period is 2025-2033, and the historical period is 2019-2024. This report is invaluable for industry professionals, investors, and anyone seeking to understand this rapidly evolving market. The market is expected to reach xx million units by 2033.
Humidity Sensors Market Dynamics & Structure
The humidity sensor market is characterized by moderate concentration, with key players like Sensirion, Honeywell, and Bosch Sensortec holding significant market share. Technological innovation, particularly in miniaturization, low-power consumption, and improved accuracy, are key drivers. Stringent regulatory frameworks concerning environmental monitoring and industrial safety influence market growth. Competitive substitutes include capacitive and resistive sensors, impacting market share dynamics. End-user demographics are diverse, spanning automotive, consumer electronics, industrial automation, and healthcare. M&A activity is moderate, with xx deals recorded between 2019-2024, primarily focused on expanding product portfolios and geographic reach.
- Market Concentration: Moderately concentrated, with top 5 players holding approximately xx% market share in 2024.
- Technological Innovation: Miniaturization, improved accuracy (+/- xx%), and low power consumption are key drivers.
- Regulatory Landscape: Stringent environmental regulations in specific regions influence adoption rates.
- Competitive Substitutes: Capacitive and resistive sensors present competition, impacting market segmentation.
- M&A Activity: xx M&A deals recorded between 2019-2024, primarily for portfolio expansion.
Humidity Sensors Growth Trends & Insights
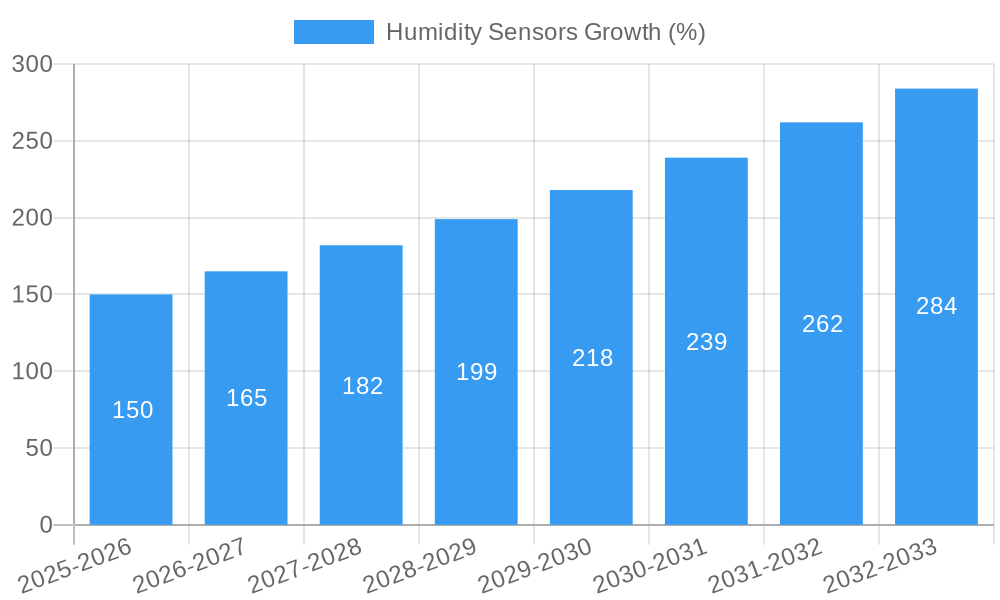
The global humidity sensors market experienced significant growth during the historical period (2019-2024), driven by increasing demand across various end-user industries. The market size witnessed a CAGR of xx% during this period, reaching xx million units in 2024. This growth is attributed to rising adoption in smart homes, wearables, and industrial automation. Technological advancements, like the integration of MEMS technology and the development of more energy-efficient sensors, further fueled market expansion. Consumer behavior shifts towards smart and connected devices also contribute to the positive market outlook. The forecast period (2025-2033) projects continued growth, with a projected CAGR of xx%, driven by factors such as the proliferation of IoT devices and increasing investments in advanced manufacturing. Market penetration is expected to reach xx% by 2033 across key segments.
Dominant Regions, Countries, or Segments in Humidity Sensors
North America currently holds the largest market share in the humidity sensors market, driven by high technological advancements and robust industrial infrastructure. Asia Pacific is experiencing the fastest growth rate, fueled by rapidly expanding electronics and automotive industries in countries like China, Japan, and South Korea. The consumer electronics segment is the largest contributor to overall market growth, driven by the increasing popularity of smart home devices and wearables.
- North America: High adoption rates in automotive and industrial applications.
- Asia Pacific: Rapid growth driven by increasing electronics and automotive manufacturing.
- Europe: Steady growth across multiple segments, driven by smart building adoption.
- Consumer Electronics: Largest segment, driven by smart home devices and wearables.
- Automotive: Significant growth driven by advanced driver-assistance systems (ADAS).
Humidity Sensors Product Landscape
The humidity sensors market encompasses a wide range of products, including capacitive, resistive, and electrochemical sensors. Recent innovations focus on miniaturization, improved accuracy, and lower power consumption. Unique selling propositions often include enhanced temperature compensation, wider operating temperature ranges, and integrated signal processing capabilities. Technological advancements in MEMS technology and nanomaterials have enabled the development of highly sensitive and reliable sensors with superior performance metrics.
Key Drivers, Barriers & Challenges in Humidity Sensors
Key Drivers: The increasing adoption of IoT devices across various sectors is a significant driver, alongside rising demand for accurate environmental monitoring in industrial and consumer applications. Technological advancements in sensor technology, such as improved accuracy and lower power consumption, are also contributing to market growth. Government initiatives promoting energy efficiency and environmental monitoring further bolster market expansion.
Key Challenges: Supply chain disruptions can impact production and delivery timelines. Stringent regulatory compliance requirements can pose a barrier to entry for new players. Intense competition among established players can exert downward pressure on pricing. The cost of advanced sensors can also limit adoption in price-sensitive markets.
Emerging Opportunities in Humidity Sensors
Significant opportunities exist in emerging markets with growing infrastructure development and increasing disposable incomes. Innovative applications in precision agriculture, smart healthcare, and environmental monitoring present exciting possibilities. The evolving consumer preference for connected devices and smart homes creates considerable growth potential. The development of low-cost, high-performance sensors can expand market reach to a broader audience.
Growth Accelerators in the Humidity Sensors Industry
Strategic partnerships between sensor manufacturers and technology integrators are accelerating market growth. Technological breakthroughs, such as the development of highly sensitive and energy-efficient sensors, are driving innovation. Market expansion strategies, including the entry into new geographic regions and the development of niche applications, are playing a key role in increasing market reach.
Key Players Shaping the Humidity Sensors Market
- Sensirion
- Continental
- BEI Sensor
- Honeywell
- Hitachi
- Infineon Technologies
- Delphi
- Melexis Microelectronic
- Bosch Sensortec
- Humirel
- Syhitech
Notable Milestones in Humidity Sensors Sector
- 2020-Q4: Sensirion launched a new high-accuracy humidity sensor for industrial applications.
- 2021-Q2: Honeywell acquired a smaller sensor company, expanding its product portfolio.
- 2022-Q3: Bosch Sensortec released a miniaturized humidity sensor for wearable devices.
- 2023-Q1: A significant patent related to humidity sensor technology was filed.
In-Depth Humidity Sensors Market Outlook
The humidity sensors market is poised for continued growth, driven by the increasing adoption of IoT devices and the expansion of smart home technology. Future market potential is considerable, with significant opportunities in emerging economies and new application areas. Strategic partnerships and continued technological innovation will be crucial for maintaining this growth trajectory, making this sector an attractive investment opportunity for the long term.
Humidity Sensors Segmentation
-
1. Application
- 1.1. Petrochemical Industry
- 1.2. Pharmaceutical Industry
- 1.3. Food Industry
- 1.4. Other Industries
-
2. Types
- 2.1. Relative Humidity Sensor
- 2.2. Absolute Humidity Sensor
Humidity Sensors Segmentation By Geography
-
1. North America
- 1.1. United States
- 1.2. Canada
- 1.3. Mexico
-
2. South America
- 2.1. Brazil
- 2.2. Argentina
- 2.3. Rest of South America
-
3. Europe
- 3.1. United Kingdom
- 3.2. Germany
- 3.3. France
- 3.4. Italy
- 3.5. Spain
- 3.6. Russia
- 3.7. Benelux
- 3.8. Nordics
- 3.9. Rest of Europe
-
4. Middle East & Africa
- 4.1. Turkey
- 4.2. Israel
- 4.3. GCC
- 4.4. North Africa
- 4.5. South Africa
- 4.6. Rest of Middle East & Africa
-
5. Asia Pacific
- 5.1. China
- 5.2. India
- 5.3. Japan
- 5.4. South Korea
- 5.5. ASEAN
- 5.6. Oceania
- 5.7. Rest of Asia Pacific

Humidity Sensors REPORT HIGHLIGHTS
| Aspects | Details |
|---|---|
| Study Period | 2019-2033 |
| Base Year | 2024 |
| Estimated Year | 2025 |
| Forecast Period | 2025-2033 |
| Historical Period | 2019-2024 |
| Growth Rate | CAGR of XX% from 2019-2033 |
| Segmentation |
|
Table of Contents
- 1. Introduction
- 1.1. Research Scope
- 1.2. Market Segmentation
- 1.3. Research Methodology
- 1.4. Definitions and Assumptions
- 2. Executive Summary
- 2.1. Introduction
- 3. Market Dynamics
- 3.1. Introduction
- 3.2. Market Drivers
- 3.3. Market Restrains
- 3.4. Market Trends
- 4. Market Factor Analysis
- 4.1. Porters Five Forces
- 4.2. Supply/Value Chain
- 4.3. PESTEL analysis
- 4.4. Market Entropy
- 4.5. Patent/Trademark Analysis
- 5. Global Humidity Sensors Analysis, Insights and Forecast, 2019-2031
- 5.1. Market Analysis, Insights and Forecast - by Application
- 5.1.1. Petrochemical Industry
- 5.1.2. Pharmaceutical Industry
- 5.1.3. Food Industry
- 5.1.4. Other Industries
- 5.2. Market Analysis, Insights and Forecast - by Types
- 5.2.1. Relative Humidity Sensor
- 5.2.2. Absolute Humidity Sensor
- 5.3. Market Analysis, Insights and Forecast - by Region
- 5.3.1. North America
- 5.3.2. South America
- 5.3.3. Europe
- 5.3.4. Middle East & Africa
- 5.3.5. Asia Pacific
- 5.1. Market Analysis, Insights and Forecast - by Application
- 6. North America Humidity Sensors Analysis, Insights and Forecast, 2019-2031
- 6.1. Market Analysis, Insights and Forecast - by Application
- 6.1.1. Petrochemical Industry
- 6.1.2. Pharmaceutical Industry
- 6.1.3. Food Industry
- 6.1.4. Other Industries
- 6.2. Market Analysis, Insights and Forecast - by Types
- 6.2.1. Relative Humidity Sensor
- 6.2.2. Absolute Humidity Sensor
- 6.1. Market Analysis, Insights and Forecast - by Application
- 7. South America Humidity Sensors Analysis, Insights and Forecast, 2019-2031
- 7.1. Market Analysis, Insights and Forecast - by Application
- 7.1.1. Petrochemical Industry
- 7.1.2. Pharmaceutical Industry
- 7.1.3. Food Industry
- 7.1.4. Other Industries
- 7.2. Market Analysis, Insights and Forecast - by Types
- 7.2.1. Relative Humidity Sensor
- 7.2.2. Absolute Humidity Sensor
- 7.1. Market Analysis, Insights and Forecast - by Application
- 8. Europe Humidity Sensors Analysis, Insights and Forecast, 2019-2031
- 8.1. Market Analysis, Insights and Forecast - by Application
- 8.1.1. Petrochemical Industry
- 8.1.2. Pharmaceutical Industry
- 8.1.3. Food Industry
- 8.1.4. Other Industries
- 8.2. Market Analysis, Insights and Forecast - by Types
- 8.2.1. Relative Humidity Sensor
- 8.2.2. Absolute Humidity Sensor
- 8.1. Market Analysis, Insights and Forecast - by Application
- 9. Middle East & Africa Humidity Sensors Analysis, Insights and Forecast, 2019-2031
- 9.1. Market Analysis, Insights and Forecast - by Application
- 9.1.1. Petrochemical Industry
- 9.1.2. Pharmaceutical Industry
- 9.1.3. Food Industry
- 9.1.4. Other Industries
- 9.2. Market Analysis, Insights and Forecast - by Types
- 9.2.1. Relative Humidity Sensor
- 9.2.2. Absolute Humidity Sensor
- 9.1. Market Analysis, Insights and Forecast - by Application
- 10. Asia Pacific Humidity Sensors Analysis, Insights and Forecast, 2019-2031
- 10.1. Market Analysis, Insights and Forecast - by Application
- 10.1.1. Petrochemical Industry
- 10.1.2. Pharmaceutical Industry
- 10.1.3. Food Industry
- 10.1.4. Other Industries
- 10.2. Market Analysis, Insights and Forecast - by Types
- 10.2.1. Relative Humidity Sensor
- 10.2.2. Absolute Humidity Sensor
- 10.1. Market Analysis, Insights and Forecast - by Application
- 11. Competitive Analysis
- 11.1. Global Market Share Analysis 2024
- 11.2. Company Profiles
- 11.2.1 Sensirion
- 11.2.1.1. Overview
- 11.2.1.2. Products
- 11.2.1.3. SWOT Analysis
- 11.2.1.4. Recent Developments
- 11.2.1.5. Financials (Based on Availability)
- 11.2.2 Continental
- 11.2.2.1. Overview
- 11.2.2.2. Products
- 11.2.2.3. SWOT Analysis
- 11.2.2.4. Recent Developments
- 11.2.2.5. Financials (Based on Availability)
- 11.2.3 BEI Sensor
- 11.2.3.1. Overview
- 11.2.3.2. Products
- 11.2.3.3. SWOT Analysis
- 11.2.3.4. Recent Developments
- 11.2.3.5. Financials (Based on Availability)
- 11.2.4 Honeywell
- 11.2.4.1. Overview
- 11.2.4.2. Products
- 11.2.4.3. SWOT Analysis
- 11.2.4.4. Recent Developments
- 11.2.4.5. Financials (Based on Availability)
- 11.2.5 Hitachi
- 11.2.5.1. Overview
- 11.2.5.2. Products
- 11.2.5.3. SWOT Analysis
- 11.2.5.4. Recent Developments
- 11.2.5.5. Financials (Based on Availability)
- 11.2.6 Infineon Technologies
- 11.2.6.1. Overview
- 11.2.6.2. Products
- 11.2.6.3. SWOT Analysis
- 11.2.6.4. Recent Developments
- 11.2.6.5. Financials (Based on Availability)
- 11.2.7 Delphi
- 11.2.7.1. Overview
- 11.2.7.2. Products
- 11.2.7.3. SWOT Analysis
- 11.2.7.4. Recent Developments
- 11.2.7.5. Financials (Based on Availability)
- 11.2.8 Melexis Microelectronic
- 11.2.8.1. Overview
- 11.2.8.2. Products
- 11.2.8.3. SWOT Analysis
- 11.2.8.4. Recent Developments
- 11.2.8.5. Financials (Based on Availability)
- 11.2.9 Bosch Sensortec
- 11.2.9.1. Overview
- 11.2.9.2. Products
- 11.2.9.3. SWOT Analysis
- 11.2.9.4. Recent Developments
- 11.2.9.5. Financials (Based on Availability)
- 11.2.10 Humirel
- 11.2.10.1. Overview
- 11.2.10.2. Products
- 11.2.10.3. SWOT Analysis
- 11.2.10.4. Recent Developments
- 11.2.10.5. Financials (Based on Availability)
- 11.2.11 Syhitech
- 11.2.11.1. Overview
- 11.2.11.2. Products
- 11.2.11.3. SWOT Analysis
- 11.2.11.4. Recent Developments
- 11.2.11.5. Financials (Based on Availability)
- 11.2.1 Sensirion
List of Figures
- Figure 1: Global Humidity Sensors Revenue Breakdown (million, %) by Region 2024 & 2032
- Figure 2: Global Humidity Sensors Volume Breakdown (K, %) by Region 2024 & 2032
- Figure 3: North America Humidity Sensors Revenue (million), by Application 2024 & 2032
- Figure 4: North America Humidity Sensors Volume (K), by Application 2024 & 2032
- Figure 5: North America Humidity Sensors Revenue Share (%), by Application 2024 & 2032
- Figure 6: North America Humidity Sensors Volume Share (%), by Application 2024 & 2032
- Figure 7: North America Humidity Sensors Revenue (million), by Types 2024 & 2032
- Figure 8: North America Humidity Sensors Volume (K), by Types 2024 & 2032
- Figure 9: North America Humidity Sensors Revenue Share (%), by Types 2024 & 2032
- Figure 10: North America Humidity Sensors Volume Share (%), by Types 2024 & 2032
- Figure 11: North America Humidity Sensors Revenue (million), by Country 2024 & 2032
- Figure 12: North America Humidity Sensors Volume (K), by Country 2024 & 2032
- Figure 13: North America Humidity Sensors Revenue Share (%), by Country 2024 & 2032
- Figure 14: North America Humidity Sensors Volume Share (%), by Country 2024 & 2032
- Figure 15: South America Humidity Sensors Revenue (million), by Application 2024 & 2032
- Figure 16: South America Humidity Sensors Volume (K), by Application 2024 & 2032
- Figure 17: South America Humidity Sensors Revenue Share (%), by Application 2024 & 2032
- Figure 18: South America Humidity Sensors Volume Share (%), by Application 2024 & 2032
- Figure 19: South America Humidity Sensors Revenue (million), by Types 2024 & 2032
- Figure 20: South America Humidity Sensors Volume (K), by Types 2024 & 2032
- Figure 21: South America Humidity Sensors Revenue Share (%), by Types 2024 & 2032
- Figure 22: South America Humidity Sensors Volume Share (%), by Types 2024 & 2032
- Figure 23: South America Humidity Sensors Revenue (million), by Country 2024 & 2032
- Figure 24: South America Humidity Sensors Volume (K), by Country 2024 & 2032
- Figure 25: South America Humidity Sensors Revenue Share (%), by Country 2024 & 2032
- Figure 26: South America Humidity Sensors Volume Share (%), by Country 2024 & 2032
- Figure 27: Europe Humidity Sensors Revenue (million), by Application 2024 & 2032
- Figure 28: Europe Humidity Sensors Volume (K), by Application 2024 & 2032
- Figure 29: Europe Humidity Sensors Revenue Share (%), by Application 2024 & 2032
- Figure 30: Europe Humidity Sensors Volume Share (%), by Application 2024 & 2032
- Figure 31: Europe Humidity Sensors Revenue (million), by Types 2024 & 2032
- Figure 32: Europe Humidity Sensors Volume (K), by Types 2024 & 2032
- Figure 33: Europe Humidity Sensors Revenue Share (%), by Types 2024 & 2032
- Figure 34: Europe Humidity Sensors Volume Share (%), by Types 2024 & 2032
- Figure 35: Europe Humidity Sensors Revenue (million), by Country 2024 & 2032
- Figure 36: Europe Humidity Sensors Volume (K), by Country 2024 & 2032
- Figure 37: Europe Humidity Sensors Revenue Share (%), by Country 2024 & 2032
- Figure 38: Europe Humidity Sensors Volume Share (%), by Country 2024 & 2032
- Figure 39: Middle East & Africa Humidity Sensors Revenue (million), by Application 2024 & 2032
- Figure 40: Middle East & Africa Humidity Sensors Volume (K), by Application 2024 & 2032
- Figure 41: Middle East & Africa Humidity Sensors Revenue Share (%), by Application 2024 & 2032
- Figure 42: Middle East & Africa Humidity Sensors Volume Share (%), by Application 2024 & 2032
- Figure 43: Middle East & Africa Humidity Sensors Revenue (million), by Types 2024 & 2032
- Figure 44: Middle East & Africa Humidity Sensors Volume (K), by Types 2024 & 2032
- Figure 45: Middle East & Africa Humidity Sensors Revenue Share (%), by Types 2024 & 2032
- Figure 46: Middle East & Africa Humidity Sensors Volume Share (%), by Types 2024 & 2032
- Figure 47: Middle East & Africa Humidity Sensors Revenue (million), by Country 2024 & 2032
- Figure 48: Middle East & Africa Humidity Sensors Volume (K), by Country 2024 & 2032
- Figure 49: Middle East & Africa Humidity Sensors Revenue Share (%), by Country 2024 & 2032
- Figure 50: Middle East & Africa Humidity Sensors Volume Share (%), by Country 2024 & 2032
- Figure 51: Asia Pacific Humidity Sensors Revenue (million), by Application 2024 & 2032
- Figure 52: Asia Pacific Humidity Sensors Volume (K), by Application 2024 & 2032
- Figure 53: Asia Pacific Humidity Sensors Revenue Share (%), by Application 2024 & 2032
- Figure 54: Asia Pacific Humidity Sensors Volume Share (%), by Application 2024 & 2032
- Figure 55: Asia Pacific Humidity Sensors Revenue (million), by Types 2024 & 2032
- Figure 56: Asia Pacific Humidity Sensors Volume (K), by Types 2024 & 2032
- Figure 57: Asia Pacific Humidity Sensors Revenue Share (%), by Types 2024 & 2032
- Figure 58: Asia Pacific Humidity Sensors Volume Share (%), by Types 2024 & 2032
- Figure 59: Asia Pacific Humidity Sensors Revenue (million), by Country 2024 & 2032
- Figure 60: Asia Pacific Humidity Sensors Volume (K), by Country 2024 & 2032
- Figure 61: Asia Pacific Humidity Sensors Revenue Share (%), by Country 2024 & 2032
- Figure 62: Asia Pacific Humidity Sensors Volume Share (%), by Country 2024 & 2032
List of Tables
- Table 1: Global Humidity Sensors Revenue million Forecast, by Region 2019 & 2032
- Table 2: Global Humidity Sensors Volume K Forecast, by Region 2019 & 2032
- Table 3: Global Humidity Sensors Revenue million Forecast, by Application 2019 & 2032
- Table 4: Global Humidity Sensors Volume K Forecast, by Application 2019 & 2032
- Table 5: Global Humidity Sensors Revenue million Forecast, by Types 2019 & 2032
- Table 6: Global Humidity Sensors Volume K Forecast, by Types 2019 & 2032
- Table 7: Global Humidity Sensors Revenue million Forecast, by Region 2019 & 2032
- Table 8: Global Humidity Sensors Volume K Forecast, by Region 2019 & 2032
- Table 9: Global Humidity Sensors Revenue million Forecast, by Application 2019 & 2032
- Table 10: Global Humidity Sensors Volume K Forecast, by Application 2019 & 2032
- Table 11: Global Humidity Sensors Revenue million Forecast, by Types 2019 & 2032
- Table 12: Global Humidity Sensors Volume K Forecast, by Types 2019 & 2032
- Table 13: Global Humidity Sensors Revenue million Forecast, by Country 2019 & 2032
- Table 14: Global Humidity Sensors Volume K Forecast, by Country 2019 & 2032
- Table 15: United States Humidity Sensors Revenue (million) Forecast, by Application 2019 & 2032
- Table 16: United States Humidity Sensors Volume (K) Forecast, by Application 2019 & 2032
- Table 17: Canada Humidity Sensors Revenue (million) Forecast, by Application 2019 & 2032
- Table 18: Canada Humidity Sensors Volume (K) Forecast, by Application 2019 & 2032
- Table 19: Mexico Humidity Sensors Revenue (million) Forecast, by Application 2019 & 2032
- Table 20: Mexico Humidity Sensors Volume (K) Forecast, by Application 2019 & 2032
- Table 21: Global Humidity Sensors Revenue million Forecast, by Application 2019 & 2032
- Table 22: Global Humidity Sensors Volume K Forecast, by Application 2019 & 2032
- Table 23: Global Humidity Sensors Revenue million Forecast, by Types 2019 & 2032
- Table 24: Global Humidity Sensors Volume K Forecast, by Types 2019 & 2032
- Table 25: Global Humidity Sensors Revenue million Forecast, by Country 2019 & 2032
- Table 26: Global Humidity Sensors Volume K Forecast, by Country 2019 & 2032
- Table 27: Brazil Humidity Sensors Revenue (million) Forecast, by Application 2019 & 2032
- Table 28: Brazil Humidity Sensors Volume (K) Forecast, by Application 2019 & 2032
- Table 29: Argentina Humidity Sensors Revenue (million) Forecast, by Application 2019 & 2032
- Table 30: Argentina Humidity Sensors Volume (K) Forecast, by Application 2019 & 2032
- Table 31: Rest of South America Humidity Sensors Revenue (million) Forecast, by Application 2019 & 2032
- Table 32: Rest of South America Humidity Sensors Volume (K) Forecast, by Application 2019 & 2032
- Table 33: Global Humidity Sensors Revenue million Forecast, by Application 2019 & 2032
- Table 34: Global Humidity Sensors Volume K Forecast, by Application 2019 & 2032
- Table 35: Global Humidity Sensors Revenue million Forecast, by Types 2019 & 2032
- Table 36: Global Humidity Sensors Volume K Forecast, by Types 2019 & 2032
- Table 37: Global Humidity Sensors Revenue million Forecast, by Country 2019 & 2032
- Table 38: Global Humidity Sensors Volume K Forecast, by Country 2019 & 2032
- Table 39: United Kingdom Humidity Sensors Revenue (million) Forecast, by Application 2019 & 2032
- Table 40: United Kingdom Humidity Sensors Volume (K) Forecast, by Application 2019 & 2032
- Table 41: Germany Humidity Sensors Revenue (million) Forecast, by Application 2019 & 2032
- Table 42: Germany Humidity Sensors Volume (K) Forecast, by Application 2019 & 2032
- Table 43: France Humidity Sensors Revenue (million) Forecast, by Application 2019 & 2032
- Table 44: France Humidity Sensors Volume (K) Forecast, by Application 2019 & 2032
- Table 45: Italy Humidity Sensors Revenue (million) Forecast, by Application 2019 & 2032
- Table 46: Italy Humidity Sensors Volume (K) Forecast, by Application 2019 & 2032
- Table 47: Spain Humidity Sensors Revenue (million) Forecast, by Application 2019 & 2032
- Table 48: Spain Humidity Sensors Volume (K) Forecast, by Application 2019 & 2032
- Table 49: Russia Humidity Sensors Revenue (million) Forecast, by Application 2019 & 2032
- Table 50: Russia Humidity Sensors Volume (K) Forecast, by Application 2019 & 2032
- Table 51: Benelux Humidity Sensors Revenue (million) Forecast, by Application 2019 & 2032
- Table 52: Benelux Humidity Sensors Volume (K) Forecast, by Application 2019 & 2032
- Table 53: Nordics Humidity Sensors Revenue (million) Forecast, by Application 2019 & 2032
- Table 54: Nordics Humidity Sensors Volume (K) Forecast, by Application 2019 & 2032
- Table 55: Rest of Europe Humidity Sensors Revenue (million) Forecast, by Application 2019 & 2032
- Table 56: Rest of Europe Humidity Sensors Volume (K) Forecast, by Application 2019 & 2032
- Table 57: Global Humidity Sensors Revenue million Forecast, by Application 2019 & 2032
- Table 58: Global Humidity Sensors Volume K Forecast, by Application 2019 & 2032
- Table 59: Global Humidity Sensors Revenue million Forecast, by Types 2019 & 2032
- Table 60: Global Humidity Sensors Volume K Forecast, by Types 2019 & 2032
- Table 61: Global Humidity Sensors Revenue million Forecast, by Country 2019 & 2032
- Table 62: Global Humidity Sensors Volume K Forecast, by Country 2019 & 2032
- Table 63: Turkey Humidity Sensors Revenue (million) Forecast, by Application 2019 & 2032
- Table 64: Turkey Humidity Sensors Volume (K) Forecast, by Application 2019 & 2032
- Table 65: Israel Humidity Sensors Revenue (million) Forecast, by Application 2019 & 2032
- Table 66: Israel Humidity Sensors Volume (K) Forecast, by Application 2019 & 2032
- Table 67: GCC Humidity Sensors Revenue (million) Forecast, by Application 2019 & 2032
- Table 68: GCC Humidity Sensors Volume (K) Forecast, by Application 2019 & 2032
- Table 69: North Africa Humidity Sensors Revenue (million) Forecast, by Application 2019 & 2032
- Table 70: North Africa Humidity Sensors Volume (K) Forecast, by Application 2019 & 2032
- Table 71: South Africa Humidity Sensors Revenue (million) Forecast, by Application 2019 & 2032
- Table 72: South Africa Humidity Sensors Volume (K) Forecast, by Application 2019 & 2032
- Table 73: Rest of Middle East & Africa Humidity Sensors Revenue (million) Forecast, by Application 2019 & 2032
- Table 74: Rest of Middle East & Africa Humidity Sensors Volume (K) Forecast, by Application 2019 & 2032
- Table 75: Global Humidity Sensors Revenue million Forecast, by Application 2019 & 2032
- Table 76: Global Humidity Sensors Volume K Forecast, by Application 2019 & 2032
- Table 77: Global Humidity Sensors Revenue million Forecast, by Types 2019 & 2032
- Table 78: Global Humidity Sensors Volume K Forecast, by Types 2019 & 2032
- Table 79: Global Humidity Sensors Revenue million Forecast, by Country 2019 & 2032
- Table 80: Global Humidity Sensors Volume K Forecast, by Country 2019 & 2032
- Table 81: China Humidity Sensors Revenue (million) Forecast, by Application 2019 & 2032
- Table 82: China Humidity Sensors Volume (K) Forecast, by Application 2019 & 2032
- Table 83: India Humidity Sensors Revenue (million) Forecast, by Application 2019 & 2032
- Table 84: India Humidity Sensors Volume (K) Forecast, by Application 2019 & 2032
- Table 85: Japan Humidity Sensors Revenue (million) Forecast, by Application 2019 & 2032
- Table 86: Japan Humidity Sensors Volume (K) Forecast, by Application 2019 & 2032
- Table 87: South Korea Humidity Sensors Revenue (million) Forecast, by Application 2019 & 2032
- Table 88: South Korea Humidity Sensors Volume (K) Forecast, by Application 2019 & 2032
- Table 89: ASEAN Humidity Sensors Revenue (million) Forecast, by Application 2019 & 2032
- Table 90: ASEAN Humidity Sensors Volume (K) Forecast, by Application 2019 & 2032
- Table 91: Oceania Humidity Sensors Revenue (million) Forecast, by Application 2019 & 2032
- Table 92: Oceania Humidity Sensors Volume (K) Forecast, by Application 2019 & 2032
- Table 93: Rest of Asia Pacific Humidity Sensors Revenue (million) Forecast, by Application 2019 & 2032
- Table 94: Rest of Asia Pacific Humidity Sensors Volume (K) Forecast, by Application 2019 & 2032
Frequently Asked Questions
1. What is the projected Compound Annual Growth Rate (CAGR) of the Humidity Sensors?
The projected CAGR is approximately XX%.
2. Which companies are prominent players in the Humidity Sensors?
Key companies in the market include Sensirion, Continental, BEI Sensor, Honeywell, Hitachi, Infineon Technologies, Delphi, Melexis Microelectronic, Bosch Sensortec, Humirel, Syhitech.
3. What are the main segments of the Humidity Sensors?
The market segments include Application, Types.
4. Can you provide details about the market size?
The market size is estimated to be USD XXX million as of 2022.
5. What are some drivers contributing to market growth?
N/A
6. What are the notable trends driving market growth?
N/A
7. Are there any restraints impacting market growth?
N/A
8. Can you provide examples of recent developments in the market?
N/A
9. What pricing options are available for accessing the report?
Pricing options include single-user, multi-user, and enterprise licenses priced at USD 3350.00, USD 5025.00, and USD 6700.00 respectively.
10. Is the market size provided in terms of value or volume?
The market size is provided in terms of value, measured in million and volume, measured in K.
11. Are there any specific market keywords associated with the report?
Yes, the market keyword associated with the report is "Humidity Sensors," which aids in identifying and referencing the specific market segment covered.
12. How do I determine which pricing option suits my needs best?
The pricing options vary based on user requirements and access needs. Individual users may opt for single-user licenses, while businesses requiring broader access may choose multi-user or enterprise licenses for cost-effective access to the report.
13. Are there any additional resources or data provided in the Humidity Sensors report?
While the report offers comprehensive insights, it's advisable to review the specific contents or supplementary materials provided to ascertain if additional resources or data are available.
14. How can I stay updated on further developments or reports in the Humidity Sensors?
To stay informed about further developments, trends, and reports in the Humidity Sensors, consider subscribing to industry newsletters, following relevant companies and organizations, or regularly checking reputable industry news sources and publications.
Methodology
Step 1 - Identification of Relevant Samples Size from Population Database


Step 2 - Approaches for Defining Global Market Size (Value, Volume* & Price*)

Note*: In applicable scenarios
Step 3 - Data Sources
Primary Research
- Web Analytics
- Survey Reports
- Research Institute
- Latest Research Reports
- Opinion Leaders
Secondary Research
- Annual Reports
- White Paper
- Latest Press Release
- Industry Association
- Paid Database
- Investor Presentations

Step 4 - Data Triangulation
Involves using different sources of information in order to increase the validity of a study
These sources are likely to be stakeholders in a program - participants, other researchers, program staff, other community members, and so on.
Then we put all data in single framework & apply various statistical tools to find out the dynamic on the market.
During the analysis stage, feedback from the stakeholder groups would be compared to determine areas of agreement as well as areas of divergence
