

Key Insights
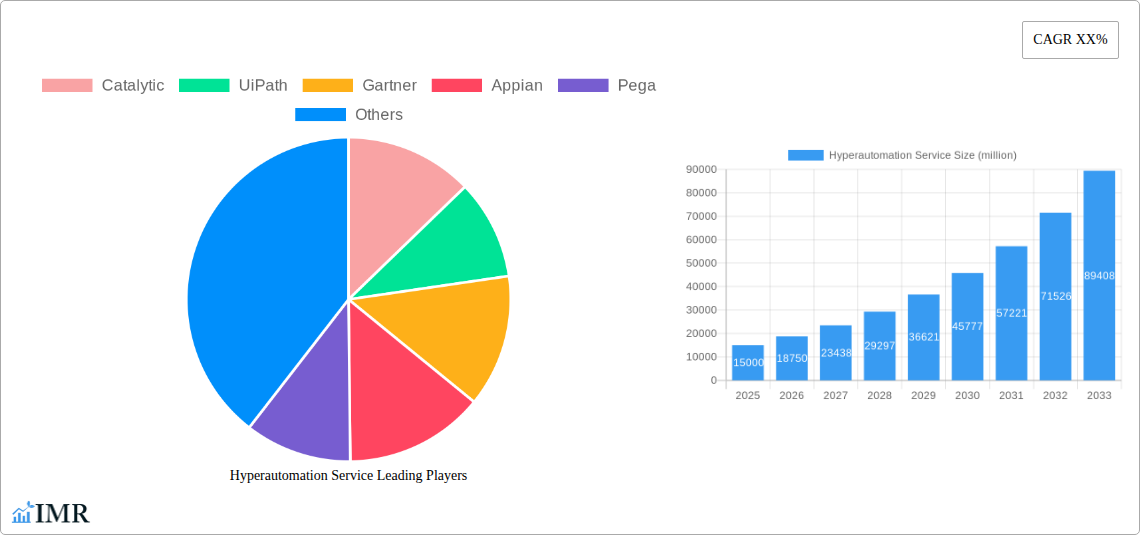
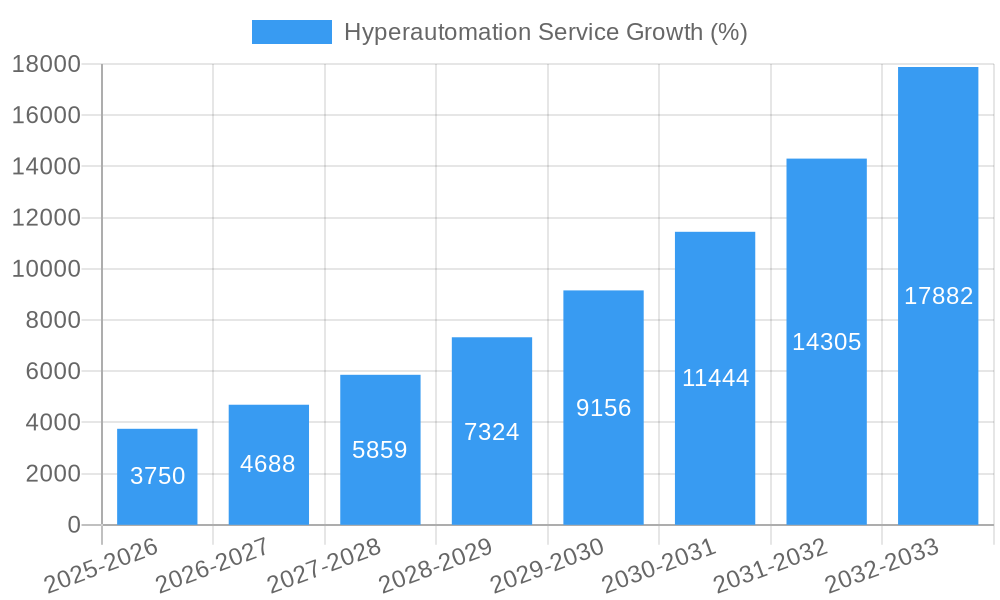
The hyperautomation services market is experiencing robust growth, driven by the increasing need for enhanced operational efficiency and digital transformation across diverse industries. The market's expansion is fueled by several key factors, including the rising adoption of cloud-based solutions, the proliferation of AI and machine learning capabilities within automation tools, and a growing demand for improved customer experience. Companies are increasingly seeking to automate complex, end-to-end business processes, leading to a surge in demand for comprehensive hyperautomation solutions. While the initial investment can be significant, the long-term cost savings and improved productivity realized through streamlined operations are driving adoption. We estimate the market size in 2025 to be $15 billion, based on observed growth in related sectors and expert analysis. A compound annual growth rate (CAGR) of 25% is projected for the forecast period (2025-2033), indicating a substantial market expansion opportunity. This growth will be further propelled by the integration of emerging technologies such as robotic process automation (RPA), intelligent business process management suites (iBPMS), and artificial intelligence (AI).
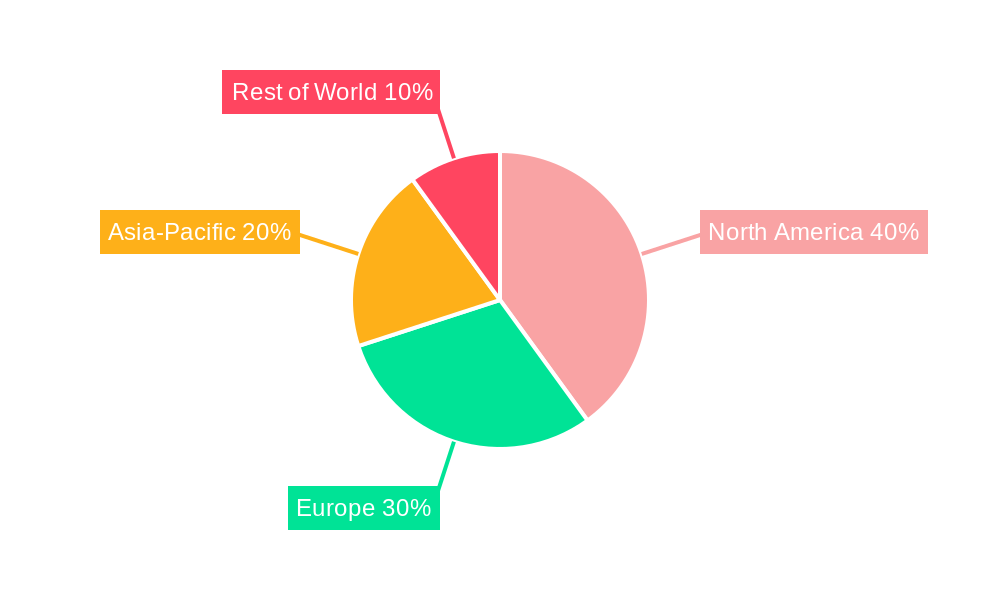
Significant restraints on market growth include the need for skilled professionals to implement and manage complex hyperautomation systems, the potential for security vulnerabilities, and the considerable upfront investment required. However, the rising availability of user-friendly platforms and managed services is gradually mitigating these challenges. The market is segmented by deployment mode (cloud-based, on-premise), industry (BFSI, healthcare, manufacturing, etc.), and component (software, services). Key players like UiPath, Automation Anywhere, and Pega are actively shaping the market landscape through continuous innovation and strategic partnerships. The competitive landscape is characterized by both large established players and agile startups, leading to a dynamic and innovative market environment. Geographic growth is expected to be most prominent in North America and Europe initially, followed by rapid expansion in Asia-Pacific and other regions as digital transformation initiatives gather pace globally.
Hyperautomation Service Market Report: 2019-2033
This comprehensive report provides a detailed analysis of the Hyperautomation Service market, offering invaluable insights for industry professionals, investors, and strategic decision-makers. Covering the period 2019-2033, with a base year of 2025 and a forecast period of 2025-2033, this report leverages extensive market research and data analysis to present a clear picture of market dynamics, growth trends, and future prospects. The market is segmented into various industry verticals, with a specific focus on the parent market of enterprise software and the child market of Robotic Process Automation (RPA). The report’s value is estimated at xx million units.
Hyperautomation Service Market Dynamics & Structure
The hyperautomation service market is characterized by a moderately concentrated structure, with key players like UiPath, Appian, and Pega holding significant market share (estimated at a combined xx% in 2025). Technological innovation, particularly in areas like AI, ML, and cloud computing, is a significant driver of growth. However, regulatory frameworks concerning data privacy and security present challenges. Competitive product substitutes, such as traditional business process management (BPM) solutions, are gradually losing ground to hyperautomation's enhanced capabilities. The end-user demographic spans diverse industries, with a growing preference for cloud-based solutions. The M&A landscape has seen a surge in activity (xx deals in the historical period), indicating a consolidation trend amongst providers.
- Market Concentration: Moderately concentrated, with top 5 players holding xx% market share in 2025.
- Technological Innovation: AI, ML, and cloud computing are key drivers.
- Regulatory Frameworks: GDPR, CCPA, and similar regulations impact adoption.
- Competitive Substitutes: Traditional BPM systems facing pressure from hyperautomation.
- End-User Demographics: Diverse industry adoption, with increasing preference for SaaS solutions.
- M&A Trends: xx M&A deals between 2019-2024, indicating market consolidation.
Hyperautomation Service Growth Trends & Insights
The global hyperautomation service market experienced significant growth during the historical period (2019-2024), with a CAGR of xx%. This growth trajectory is projected to continue throughout the forecast period (2025-2033), driven by increasing digital transformation initiatives across industries. The market size is estimated at xx million units in 2025 and is expected to reach xx million units by 2033. Market penetration is currently at xx% and is expected to reach xx% by 2033. Technological disruptions, such as the rise of low-code/no-code platforms and the increasing sophistication of AI capabilities, are further fueling market expansion. Shifting consumer behavior towards automation and efficiency has created a strong demand for hyperautomation services.
Dominant Regions, Countries, or Segments in Hyperautomation Service
North America currently dominates the hyperautomation service market, holding the largest market share (xx% in 2025) due to high technological adoption, strong digital infrastructure, and a robust presence of key players. Europe and Asia-Pacific are also witnessing significant growth, driven by factors such as increasing government investments in digital infrastructure and a rising demand for process automation across industries.
- North America: Strong technological adoption, robust digital infrastructure, and high concentration of key players.
- Europe: Growing adoption driven by increased digital transformation initiatives and government support.
- Asia-Pacific: Rapid economic growth and rising demand for automation across various sectors.
Hyperautomation Service Product Landscape
The hyperautomation service market features a diverse range of products, including Robotic Process Automation (RPA), intelligent business process management suites (iBPMS), and AI-powered decision automation tools. These solutions offer unique selling propositions like improved efficiency, reduced operational costs, enhanced accuracy, and improved customer experience. Technological advancements are continuously driving innovation, leading to more sophisticated and user-friendly platforms.
Key Drivers, Barriers & Challenges in Hyperautomation Service
Key Drivers:
- Increasing demand for operational efficiency and cost reduction.
- Growing adoption of cloud-based solutions.
- Advancements in AI and machine learning technologies.
- Rising need for data-driven decision-making.
Challenges & Restraints:
- High initial investment costs for implementation.
- Lack of skilled professionals for implementation and maintenance.
- Concerns about data security and privacy.
- Integration challenges with legacy systems. Estimated loss due to integration issues and data security concerns is approximately xx million units annually.
Emerging Opportunities in Hyperautomation Service
- Untapped potential in small and medium-sized enterprises (SMEs).
- Growing demand for hyperautomation in niche industries.
- Integration with emerging technologies like blockchain and IoT.
- Development of hyperautomation-as-a-service (HaaS) models.
Growth Accelerators in the Hyperautomation Service Industry
Strategic partnerships between technology vendors and service providers are accelerating market growth. Furthermore, the development of advanced AI capabilities and the expansion into new industry verticals are significant catalysts. Continuous innovation and improvements in user experience will ensure the continued adoption of hyperautomation services across various sectors.
Key Players Shaping the Hyperautomation Service Market
Notable Milestones in Hyperautomation Service Sector
- 2020: UiPath goes public.
- 2021: Appian launches its low-code platform.
- 2022: Significant investments in AI-powered hyperautomation solutions.
- 2023: Increased focus on hyperautomation solutions for the healthcare industry.
- 2024: Several mergers and acquisitions within the hyperautomation space.
In-Depth Hyperautomation Service Market Outlook
The hyperautomation service market is poised for sustained growth, driven by the continuous evolution of technology and a growing recognition of its benefits across various industries. Strategic partnerships, technological advancements, and expansion into untapped markets will significantly contribute to market expansion. This report projects a positive outlook, with substantial opportunities for both established players and new entrants to capitalize on this rapidly evolving market.
Hyperautomation Service Segmentation
-
1. Application
- 1.1. Commercial
- 1.2. Medical
- 1.3. Military
- 1.4. Others
-
2. Types
- 2.1. Cloud-based
- 2.2. On Premise
Hyperautomation Service Segmentation By Geography
-
1. North America
- 1.1. United States
- 1.2. Canada
- 1.3. Mexico
-
2. South America
- 2.1. Brazil
- 2.2. Argentina
- 2.3. Rest of South America
-
3. Europe
- 3.1. United Kingdom
- 3.2. Germany
- 3.3. France
- 3.4. Italy
- 3.5. Spain
- 3.6. Russia
- 3.7. Benelux
- 3.8. Nordics
- 3.9. Rest of Europe
-
4. Middle East & Africa
- 4.1. Turkey
- 4.2. Israel
- 4.3. GCC
- 4.4. North Africa
- 4.5. South Africa
- 4.6. Rest of Middle East & Africa
-
5. Asia Pacific
- 5.1. China
- 5.2. India
- 5.3. Japan
- 5.4. South Korea
- 5.5. ASEAN
- 5.6. Oceania
- 5.7. Rest of Asia Pacific
Hyperautomation Service REPORT HIGHLIGHTS
| Aspects | Details |
|---|---|
| Study Period | 2019-2033 |
| Base Year | 2024 |
| Estimated Year | 2025 |
| Forecast Period | 2025-2033 |
| Historical Period | 2019-2024 |
| Growth Rate | CAGR of XX% from 2019-2033 |
| Segmentation |
|
Table of Contents
- 1. Introduction
- 1.1. Research Scope
- 1.2. Market Segmentation
- 1.3. Research Methodology
- 1.4. Definitions and Assumptions
- 2. Executive Summary
- 2.1. Introduction
- 3. Market Dynamics
- 3.1. Introduction
- 3.2. Market Drivers
- 3.3. Market Restrains
- 3.4. Market Trends
- 4. Market Factor Analysis
- 4.1. Porters Five Forces
- 4.2. Supply/Value Chain
- 4.3. PESTEL analysis
- 4.4. Market Entropy
- 4.5. Patent/Trademark Analysis
- 5. Global Hyperautomation Service Analysis, Insights and Forecast, 2019-2031
- 5.1. Market Analysis, Insights and Forecast - by Application
- 5.1.1. Commercial
- 5.1.2. Medical
- 5.1.3. Military
- 5.1.4. Others
- 5.2. Market Analysis, Insights and Forecast - by Types
- 5.2.1. Cloud-based
- 5.2.2. On Premise
- 5.3. Market Analysis, Insights and Forecast - by Region
- 5.3.1. North America
- 5.3.2. South America
- 5.3.3. Europe
- 5.3.4. Middle East & Africa
- 5.3.5. Asia Pacific
- 5.1. Market Analysis, Insights and Forecast - by Application
- 6. North America Hyperautomation Service Analysis, Insights and Forecast, 2019-2031
- 6.1. Market Analysis, Insights and Forecast - by Application
- 6.1.1. Commercial
- 6.1.2. Medical
- 6.1.3. Military
- 6.1.4. Others
- 6.2. Market Analysis, Insights and Forecast - by Types
- 6.2.1. Cloud-based
- 6.2.2. On Premise
- 6.1. Market Analysis, Insights and Forecast - by Application
- 7. South America Hyperautomation Service Analysis, Insights and Forecast, 2019-2031
- 7.1. Market Analysis, Insights and Forecast - by Application
- 7.1.1. Commercial
- 7.1.2. Medical
- 7.1.3. Military
- 7.1.4. Others
- 7.2. Market Analysis, Insights and Forecast - by Types
- 7.2.1. Cloud-based
- 7.2.2. On Premise
- 7.1. Market Analysis, Insights and Forecast - by Application
- 8. Europe Hyperautomation Service Analysis, Insights and Forecast, 2019-2031
- 8.1. Market Analysis, Insights and Forecast - by Application
- 8.1.1. Commercial
- 8.1.2. Medical
- 8.1.3. Military
- 8.1.4. Others
- 8.2. Market Analysis, Insights and Forecast - by Types
- 8.2.1. Cloud-based
- 8.2.2. On Premise
- 8.1. Market Analysis, Insights and Forecast - by Application
- 9. Middle East & Africa Hyperautomation Service Analysis, Insights and Forecast, 2019-2031
- 9.1. Market Analysis, Insights and Forecast - by Application
- 9.1.1. Commercial
- 9.1.2. Medical
- 9.1.3. Military
- 9.1.4. Others
- 9.2. Market Analysis, Insights and Forecast - by Types
- 9.2.1. Cloud-based
- 9.2.2. On Premise
- 9.1. Market Analysis, Insights and Forecast - by Application
- 10. Asia Pacific Hyperautomation Service Analysis, Insights and Forecast, 2019-2031
- 10.1. Market Analysis, Insights and Forecast - by Application
- 10.1.1. Commercial
- 10.1.2. Medical
- 10.1.3. Military
- 10.1.4. Others
- 10.2. Market Analysis, Insights and Forecast - by Types
- 10.2.1. Cloud-based
- 10.2.2. On Premise
- 10.1. Market Analysis, Insights and Forecast - by Application
- 11. Competitive Analysis
- 11.1. Global Market Share Analysis 2024
- 11.2. Company Profiles
- 11.2.1 Catalytic
- 11.2.1.1. Overview
- 11.2.1.2. Products
- 11.2.1.3. SWOT Analysis
- 11.2.1.4. Recent Developments
- 11.2.1.5. Financials (Based on Availability)
- 11.2.2 UiPath
- 11.2.2.1. Overview
- 11.2.2.2. Products
- 11.2.2.3. SWOT Analysis
- 11.2.2.4. Recent Developments
- 11.2.2.5. Financials (Based on Availability)
- 11.2.3 Gartner
- 11.2.3.1. Overview
- 11.2.3.2. Products
- 11.2.3.3. SWOT Analysis
- 11.2.3.4. Recent Developments
- 11.2.3.5. Financials (Based on Availability)
- 11.2.4 Appian
- 11.2.4.1. Overview
- 11.2.4.2. Products
- 11.2.4.3. SWOT Analysis
- 11.2.4.4. Recent Developments
- 11.2.4.5. Financials (Based on Availability)
- 11.2.5 Pega
- 11.2.5.1. Overview
- 11.2.5.2. Products
- 11.2.5.3. SWOT Analysis
- 11.2.5.4. Recent Developments
- 11.2.5.5. Financials (Based on Availability)
- 11.2.6 Lithe
- 11.2.6.1. Overview
- 11.2.6.2. Products
- 11.2.6.3. SWOT Analysis
- 11.2.6.4. Recent Developments
- 11.2.6.5. Financials (Based on Availability)
- 11.2.7 SolveXia
- 11.2.7.1. Overview
- 11.2.7.2. Products
- 11.2.7.3. SWOT Analysis
- 11.2.7.4. Recent Developments
- 11.2.7.5. Financials (Based on Availability)
- 11.2.8 ZappyAI
- 11.2.8.1. Overview
- 11.2.8.2. Products
- 11.2.8.3. SWOT Analysis
- 11.2.8.4. Recent Developments
- 11.2.8.5. Financials (Based on Availability)
- 11.2.9 rapidMATION
- 11.2.9.1. Overview
- 11.2.9.2. Products
- 11.2.9.3. SWOT Analysis
- 11.2.9.4. Recent Developments
- 11.2.9.5. Financials (Based on Availability)
- 11.2.1 Catalytic
List of Figures
- Figure 1: Global Hyperautomation Service Revenue Breakdown (million, %) by Region 2024 & 2032
- Figure 2: North America Hyperautomation Service Revenue (million), by Application 2024 & 2032
- Figure 3: North America Hyperautomation Service Revenue Share (%), by Application 2024 & 2032
- Figure 4: North America Hyperautomation Service Revenue (million), by Types 2024 & 2032
- Figure 5: North America Hyperautomation Service Revenue Share (%), by Types 2024 & 2032
- Figure 6: North America Hyperautomation Service Revenue (million), by Country 2024 & 2032
- Figure 7: North America Hyperautomation Service Revenue Share (%), by Country 2024 & 2032
- Figure 8: South America Hyperautomation Service Revenue (million), by Application 2024 & 2032
- Figure 9: South America Hyperautomation Service Revenue Share (%), by Application 2024 & 2032
- Figure 10: South America Hyperautomation Service Revenue (million), by Types 2024 & 2032
- Figure 11: South America Hyperautomation Service Revenue Share (%), by Types 2024 & 2032
- Figure 12: South America Hyperautomation Service Revenue (million), by Country 2024 & 2032
- Figure 13: South America Hyperautomation Service Revenue Share (%), by Country 2024 & 2032
- Figure 14: Europe Hyperautomation Service Revenue (million), by Application 2024 & 2032
- Figure 15: Europe Hyperautomation Service Revenue Share (%), by Application 2024 & 2032
- Figure 16: Europe Hyperautomation Service Revenue (million), by Types 2024 & 2032
- Figure 17: Europe Hyperautomation Service Revenue Share (%), by Types 2024 & 2032
- Figure 18: Europe Hyperautomation Service Revenue (million), by Country 2024 & 2032
- Figure 19: Europe Hyperautomation Service Revenue Share (%), by Country 2024 & 2032
- Figure 20: Middle East & Africa Hyperautomation Service Revenue (million), by Application 2024 & 2032
- Figure 21: Middle East & Africa Hyperautomation Service Revenue Share (%), by Application 2024 & 2032
- Figure 22: Middle East & Africa Hyperautomation Service Revenue (million), by Types 2024 & 2032
- Figure 23: Middle East & Africa Hyperautomation Service Revenue Share (%), by Types 2024 & 2032
- Figure 24: Middle East & Africa Hyperautomation Service Revenue (million), by Country 2024 & 2032
- Figure 25: Middle East & Africa Hyperautomation Service Revenue Share (%), by Country 2024 & 2032
- Figure 26: Asia Pacific Hyperautomation Service Revenue (million), by Application 2024 & 2032
- Figure 27: Asia Pacific Hyperautomation Service Revenue Share (%), by Application 2024 & 2032
- Figure 28: Asia Pacific Hyperautomation Service Revenue (million), by Types 2024 & 2032
- Figure 29: Asia Pacific Hyperautomation Service Revenue Share (%), by Types 2024 & 2032
- Figure 30: Asia Pacific Hyperautomation Service Revenue (million), by Country 2024 & 2032
- Figure 31: Asia Pacific Hyperautomation Service Revenue Share (%), by Country 2024 & 2032
List of Tables
- Table 1: Global Hyperautomation Service Revenue million Forecast, by Region 2019 & 2032
- Table 2: Global Hyperautomation Service Revenue million Forecast, by Application 2019 & 2032
- Table 3: Global Hyperautomation Service Revenue million Forecast, by Types 2019 & 2032
- Table 4: Global Hyperautomation Service Revenue million Forecast, by Region 2019 & 2032
- Table 5: Global Hyperautomation Service Revenue million Forecast, by Application 2019 & 2032
- Table 6: Global Hyperautomation Service Revenue million Forecast, by Types 2019 & 2032
- Table 7: Global Hyperautomation Service Revenue million Forecast, by Country 2019 & 2032
- Table 8: United States Hyperautomation Service Revenue (million) Forecast, by Application 2019 & 2032
- Table 9: Canada Hyperautomation Service Revenue (million) Forecast, by Application 2019 & 2032
- Table 10: Mexico Hyperautomation Service Revenue (million) Forecast, by Application 2019 & 2032
- Table 11: Global Hyperautomation Service Revenue million Forecast, by Application 2019 & 2032
- Table 12: Global Hyperautomation Service Revenue million Forecast, by Types 2019 & 2032
- Table 13: Global Hyperautomation Service Revenue million Forecast, by Country 2019 & 2032
- Table 14: Brazil Hyperautomation Service Revenue (million) Forecast, by Application 2019 & 2032
- Table 15: Argentina Hyperautomation Service Revenue (million) Forecast, by Application 2019 & 2032
- Table 16: Rest of South America Hyperautomation Service Revenue (million) Forecast, by Application 2019 & 2032
- Table 17: Global Hyperautomation Service Revenue million Forecast, by Application 2019 & 2032
- Table 18: Global Hyperautomation Service Revenue million Forecast, by Types 2019 & 2032
- Table 19: Global Hyperautomation Service Revenue million Forecast, by Country 2019 & 2032
- Table 20: United Kingdom Hyperautomation Service Revenue (million) Forecast, by Application 2019 & 2032
- Table 21: Germany Hyperautomation Service Revenue (million) Forecast, by Application 2019 & 2032
- Table 22: France Hyperautomation Service Revenue (million) Forecast, by Application 2019 & 2032
- Table 23: Italy Hyperautomation Service Revenue (million) Forecast, by Application 2019 & 2032
- Table 24: Spain Hyperautomation Service Revenue (million) Forecast, by Application 2019 & 2032
- Table 25: Russia Hyperautomation Service Revenue (million) Forecast, by Application 2019 & 2032
- Table 26: Benelux Hyperautomation Service Revenue (million) Forecast, by Application 2019 & 2032
- Table 27: Nordics Hyperautomation Service Revenue (million) Forecast, by Application 2019 & 2032
- Table 28: Rest of Europe Hyperautomation Service Revenue (million) Forecast, by Application 2019 & 2032
- Table 29: Global Hyperautomation Service Revenue million Forecast, by Application 2019 & 2032
- Table 30: Global Hyperautomation Service Revenue million Forecast, by Types 2019 & 2032
- Table 31: Global Hyperautomation Service Revenue million Forecast, by Country 2019 & 2032
- Table 32: Turkey Hyperautomation Service Revenue (million) Forecast, by Application 2019 & 2032
- Table 33: Israel Hyperautomation Service Revenue (million) Forecast, by Application 2019 & 2032
- Table 34: GCC Hyperautomation Service Revenue (million) Forecast, by Application 2019 & 2032
- Table 35: North Africa Hyperautomation Service Revenue (million) Forecast, by Application 2019 & 2032
- Table 36: South Africa Hyperautomation Service Revenue (million) Forecast, by Application 2019 & 2032
- Table 37: Rest of Middle East & Africa Hyperautomation Service Revenue (million) Forecast, by Application 2019 & 2032
- Table 38: Global Hyperautomation Service Revenue million Forecast, by Application 2019 & 2032
- Table 39: Global Hyperautomation Service Revenue million Forecast, by Types 2019 & 2032
- Table 40: Global Hyperautomation Service Revenue million Forecast, by Country 2019 & 2032
- Table 41: China Hyperautomation Service Revenue (million) Forecast, by Application 2019 & 2032
- Table 42: India Hyperautomation Service Revenue (million) Forecast, by Application 2019 & 2032
- Table 43: Japan Hyperautomation Service Revenue (million) Forecast, by Application 2019 & 2032
- Table 44: South Korea Hyperautomation Service Revenue (million) Forecast, by Application 2019 & 2032
- Table 45: ASEAN Hyperautomation Service Revenue (million) Forecast, by Application 2019 & 2032
- Table 46: Oceania Hyperautomation Service Revenue (million) Forecast, by Application 2019 & 2032
- Table 47: Rest of Asia Pacific Hyperautomation Service Revenue (million) Forecast, by Application 2019 & 2032
Frequently Asked Questions
1. What is the projected Compound Annual Growth Rate (CAGR) of the Hyperautomation Service?
The projected CAGR is approximately XX%.
2. Which companies are prominent players in the Hyperautomation Service?
Key companies in the market include Catalytic, UiPath, Gartner, Appian, Pega, Lithe, SolveXia, ZappyAI, rapidMATION.
3. What are the main segments of the Hyperautomation Service?
The market segments include Application, Types.
4. Can you provide details about the market size?
The market size is estimated to be USD XXX million as of 2022.
5. What are some drivers contributing to market growth?
N/A
6. What are the notable trends driving market growth?
N/A
7. Are there any restraints impacting market growth?
N/A
8. Can you provide examples of recent developments in the market?
N/A
9. What pricing options are available for accessing the report?
Pricing options include single-user, multi-user, and enterprise licenses priced at USD 4350.00, USD 6525.00, and USD 8700.00 respectively.
10. Is the market size provided in terms of value or volume?
The market size is provided in terms of value, measured in million.
11. Are there any specific market keywords associated with the report?
Yes, the market keyword associated with the report is "Hyperautomation Service," which aids in identifying and referencing the specific market segment covered.
12. How do I determine which pricing option suits my needs best?
The pricing options vary based on user requirements and access needs. Individual users may opt for single-user licenses, while businesses requiring broader access may choose multi-user or enterprise licenses for cost-effective access to the report.
13. Are there any additional resources or data provided in the Hyperautomation Service report?
While the report offers comprehensive insights, it's advisable to review the specific contents or supplementary materials provided to ascertain if additional resources or data are available.
14. How can I stay updated on further developments or reports in the Hyperautomation Service?
To stay informed about further developments, trends, and reports in the Hyperautomation Service, consider subscribing to industry newsletters, following relevant companies and organizations, or regularly checking reputable industry news sources and publications.
Methodology
Step 1 - Identification of Relevant Samples Size from Population Database


Step 2 - Approaches for Defining Global Market Size (Value, Volume* & Price*)

Note*: In applicable scenarios
Step 3 - Data Sources
Primary Research
- Web Analytics
- Survey Reports
- Research Institute
- Latest Research Reports
- Opinion Leaders
Secondary Research
- Annual Reports
- White Paper
- Latest Press Release
- Industry Association
- Paid Database
- Investor Presentations

Step 4 - Data Triangulation
Involves using different sources of information in order to increase the validity of a study
These sources are likely to be stakeholders in a program - participants, other researchers, program staff, other community members, and so on.
Then we put all data in single framework & apply various statistical tools to find out the dynamic on the market.
During the analysis stage, feedback from the stakeholder groups would be compared to determine areas of agreement as well as areas of divergence
