

Key Insights
The global image sensor market, valued at $28.32 billion in 2025, is projected to experience robust growth, exhibiting a compound annual growth rate (CAGR) of 8.24% from 2025 to 2033. This expansion is driven by several key factors. The surging demand for high-resolution imaging in consumer electronics, particularly smartphones and digital cameras, remains a significant driver. Furthermore, the increasing adoption of image sensors in automotive applications, such as Advanced Driver-Assistance Systems (ADAS) and autonomous vehicles, is fueling market growth. The healthcare sector's reliance on advanced imaging technologies for diagnostics and treatment is also contributing significantly. Growth is further propelled by the expanding security and surveillance sector, with widespread deployment of CCTV cameras and smart security systems. Technological advancements, such as the development of higher-resolution sensors with improved sensitivity and lower power consumption, are enhancing the capabilities and market appeal of image sensors. The CMOS image sensor segment is expected to dominate the market due to its cost-effectiveness and superior performance compared to CCD sensors.
However, the market faces certain restraints. Fluctuations in the prices of raw materials and the complexities involved in manufacturing advanced image sensors can impact profitability. Furthermore, intense competition among established players and the emergence of new entrants could create pricing pressures. Nevertheless, the long-term outlook for the image sensor market remains positive, with continued innovation and increasing demand across various end-user industries ensuring sustained growth over the forecast period. Geographical expansion, particularly in developing economies in Asia-Pacific and South America, presents lucrative opportunities for market participants. The continued integration of image sensors into IoT devices and the rise of artificial intelligence (AI) applications further solidify the market's future prospects.
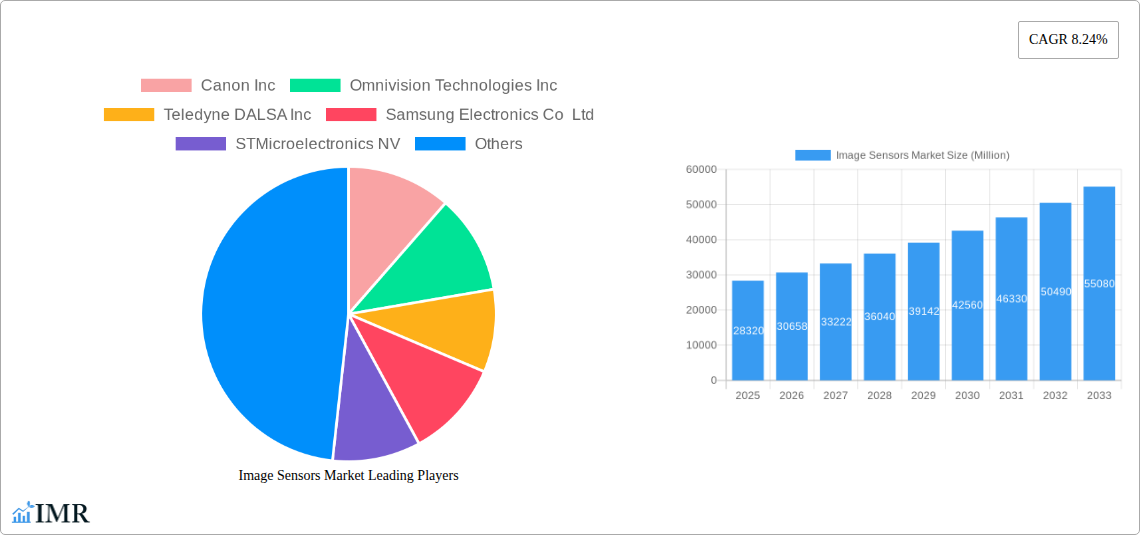
Image Sensors Market: A Comprehensive Report (2019-2033)
This comprehensive report provides an in-depth analysis of the Image Sensors Market, encompassing market dynamics, growth trends, regional analysis, competitive landscape, and future outlook. With a study period spanning 2019-2033, a base year of 2025, and a forecast period of 2025-2033, this report is an invaluable resource for industry professionals, investors, and strategic decision-makers. The report segments the market by type (CMOS, CCD) and end-user industry (Consumer Electronics, Healthcare, Industrial, Security and Surveillance, Automotive and Transportation, Aerospace and Defense, Other End-user Industries), offering granular insights into market size and growth potential across various segments. Key players analyzed include Canon Inc, Omnivision Technologies Inc, Teledyne DALSA Inc, Samsung Electronics Co Ltd, STMicroelectronics NV, SK Hynix Inc, Hamamatsu Photonics K K, GalaxyCore Inc, Ams AG, Panasonic Corporation, and Sony Corporation.
Image Sensors Market Dynamics & Structure
The Image Sensors market is characterized by moderate concentration, with a few major players holding significant market share. The market is driven by rapid technological advancements, particularly in CMOS sensor technology, leading to higher resolution, improved sensitivity, and reduced power consumption. Regulatory frameworks, particularly concerning data privacy and security in applications like automotive and surveillance, are shaping market dynamics. The presence of competitive substitutes, such as LiDAR for certain applications, presents a challenge. Furthermore, M&A activities are increasingly prevalent as companies seek to expand their product portfolios and strengthen their market positions.
- Market Concentration: Moderately concentrated, with top 5 players holding approximately xx% of the market share in 2025.
- Technological Innovation: Continuous advancements in CMOS technology, including higher pixel density, improved dynamic range, and on-chip processing capabilities.
- Regulatory Framework: Growing regulations regarding data privacy and cybersecurity are influencing market growth, especially in the automotive and surveillance sectors.
- Competitive Substitutes: LiDAR and other sensing technologies are emerging as substitutes in specific applications.
- M&A Activity: An average of xx M&A deals per year were observed during the historical period (2019-2024), indicative of ongoing consolidation.
- End-User Demographics: Shifting demographics and rising disposable income, particularly in developing economies, fuel demand in consumer electronics and other end-user segments.
Image Sensors Market Growth Trends & Insights
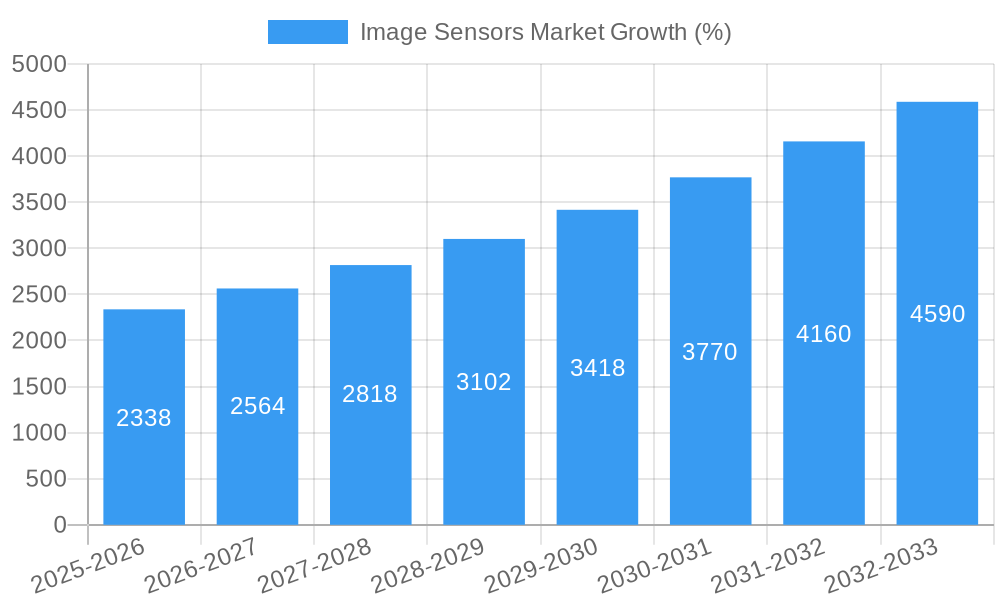
The Image Sensors market exhibited significant growth during the historical period (2019-2024), with a CAGR of xx%. This growth is attributed to several factors, including the increasing adoption of image sensors across diverse industries, technological advancements leading to improved image quality and functionality, and the rising demand for high-resolution imaging in applications like smartphones, automobiles, and medical devices. Consumer behavior shifts towards advanced imaging features in electronic devices have further fueled market expansion. The market is anticipated to continue its growth trajectory during the forecast period (2025-2033), driven by emerging applications in areas such as augmented reality (AR), virtual reality (VR), and the Internet of Things (IoT). Market penetration rates are projected to increase significantly, particularly in developing economies. The market size is estimated at xx million units in 2025 and is projected to reach xx million units by 2033, demonstrating substantial growth potential.
Dominant Regions, Countries, or Segments in Image Sensors Market
The Asia-Pacific region is currently the dominant market for image sensors, driven by the robust growth of the consumer electronics industry in countries like China and South Korea. North America and Europe also hold significant market shares, owing to strong demand from the automotive, healthcare, and industrial sectors. Within the segment breakdown:
By Type: CMOS sensors dominate the market due to their superior performance and cost-effectiveness compared to CCD sensors. CMOS held an xx% market share in 2025.
By End-user Industry: Consumer electronics is the largest end-user segment, accounting for xx% of the total market in 2025. However, the automotive and transportation sector is projected to experience the fastest growth during the forecast period. The increasing adoption of advanced driver-assistance systems (ADAS) and autonomous vehicles is a key driver.
Key Drivers (Asia-Pacific):
- Strong manufacturing base and presence of key players.
- High consumer electronics adoption rates.
- Favorable government policies promoting technological advancement.
Key Drivers (North America & Europe):
- High demand from automotive and industrial sectors.
- Advanced technological infrastructure and R&D capabilities.
- Stringent regulations driving technological innovation in specific sectors.
Image Sensors Market Product Landscape
The image sensor market offers a wide array of products catering to diverse applications, ranging from low-resolution sensors for simple imaging tasks to high-resolution sensors with advanced features for sophisticated applications. Recent innovations focus on improving image quality, reducing power consumption, and integrating advanced functionalities like on-chip processing and AI capabilities. Key differentiators include pixel size, dynamic range, frame rate, and the integration of advanced features such as HDR and auto-focus. Unique selling propositions often center on superior image quality, low power consumption, compact size, and cost-effectiveness.
Key Drivers, Barriers & Challenges in Image Sensors Market
Key Drivers:
The market is driven by the increasing demand for high-resolution imaging in various applications, including smartphones, automotive, security surveillance, and medical imaging. Technological advancements, such as the development of higher-resolution sensors with improved low-light performance, also contribute to market growth. Government initiatives promoting the adoption of advanced technologies in various sectors further bolster market expansion.
Key Barriers and Challenges:
Supply chain disruptions can significantly impact the availability and cost of image sensors. Stringent regulatory requirements related to data privacy and security can pose challenges for companies operating in certain markets. Intense competition among established players and new entrants exerts pressure on pricing and margins. The high cost of R&D and the rapid pace of technological change necessitates continuous innovation, presenting a substantial challenge for smaller players.
Emerging Opportunities in Image Sensors Market
Emerging opportunities lie in the rapidly expanding markets for AR/VR devices, autonomous vehicles, and advanced medical imaging systems. The increasing adoption of IoT devices necessitates the development of low-power, high-performance image sensors for diverse applications. There is also substantial potential in the development of specialized sensors for niche applications, such as hyperspectral imaging and 3D sensing. Further, tailoring image sensors for specific consumer preferences, such as improved night vision or enhanced color accuracy, presents significant opportunities.
Growth Accelerators in the Image Sensors Market Industry
Long-term growth will be fueled by continued technological innovation, leading to smaller, more efficient, and higher-performing image sensors. Strategic partnerships between sensor manufacturers and system integrators will accelerate market adoption in diverse sectors. Market expansion into developing economies with rising consumer demand and government support for technological infrastructure development will be instrumental in driving sustained growth.
Key Players Shaping the Image Sensors Market Market
- Canon Inc
- Omnivision Technologies Inc
- Teledyne DALSA Inc
- Samsung Electronics Co Ltd
- STMicroelectronics NV
- SK Hynix Inc
- Hamamatsu Photonics K K
- GalaxyCore Inc
- Ams AG
- Panasonic Corporation
- Sony Corporation
Notable Milestones in Image Sensors Market Sector
- 2020, Q4: Sony Corporation launches its next-generation image sensor with improved low-light performance.
- 2021, Q1: Samsung Electronics Co Ltd announces a strategic partnership with a leading automotive manufacturer to develop advanced image sensors for autonomous driving systems.
- 2022, Q2: OmniVision Technologies Inc introduces a new high-resolution image sensor with on-chip AI processing capabilities.
- 2023, Q3: A major M&A deal occurs in the image sensor industry resulting in market consolidation. (Details of the acquisition would need to be added here if available)
In-Depth Image Sensors Market Market Outlook
The Image Sensors market is poised for sustained growth driven by ongoing technological advancements, increasing demand from diverse end-user industries, and the emergence of new applications. Strategic partnerships, focused R&D investments, and expansion into untapped markets will be crucial factors shaping future market dynamics. The market is expected to witness a significant increase in demand for high-resolution, low-power, and AI-enabled image sensors in the coming years, presenting lucrative opportunities for industry players.
Image Sensors Market Segmentation
-
1. Type
- 1.1. CMOS
- 1.2. CCD
-
2. End-user Industry
- 2.1. Consumer Electronics
- 2.2. Healthcare
- 2.3. Industrial
- 2.4. Security and Surveillance
- 2.5. Automotive and Transportation
- 2.6. Aerospace and Defense
- 2.7. Other End-user Industries
Image Sensors Market Segmentation By Geography
-
1. North America
- 1.1. United States
- 1.2. Canada
-
2. Europe
- 2.1. United Kingdom
- 2.2. Germany
- 2.3. France
- 2.4. Rest of Europe
-
3. Asia Pacific
- 3.1. China
- 3.2. India
- 3.3. Japan
- 3.4. Rest of Asia Pacific
- 4. Rest of the World
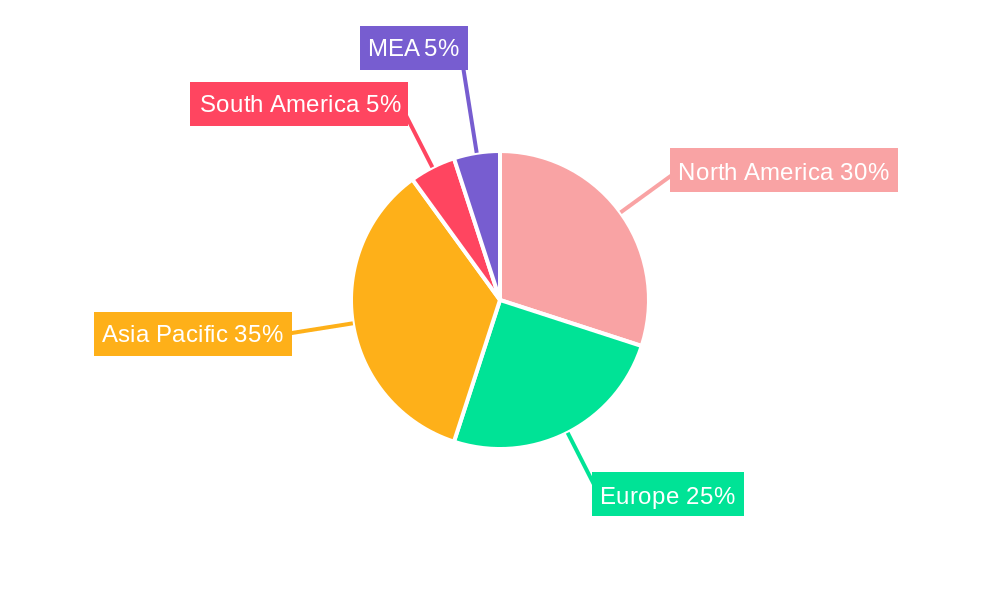
Image Sensors Market REPORT HIGHLIGHTS
| Aspects | Details |
|---|---|
| Study Period | 2019-2033 |
| Base Year | 2024 |
| Estimated Year | 2025 |
| Forecast Period | 2025-2033 |
| Historical Period | 2019-2024 |
| Growth Rate | CAGR of 8.24% from 2019-2033 |
| Segmentation |
|
Table of Contents
- 1. Introduction
- 1.1. Research Scope
- 1.2. Market Segmentation
- 1.3. Research Methodology
- 1.4. Definitions and Assumptions
- 2. Executive Summary
- 2.1. Introduction
- 3. Market Dynamics
- 3.1. Introduction
- 3.2. Market Drivers
- 3.2.1. Increasing Demand in Automotive Sector; Demand for Gesture Recognition/Control in Vertical Applications
- 3.3. Market Restrains
- 3.3.1. ; Easy availability of light detection and ranging (LiDAR) solutions.
- 3.4. Market Trends
- 3.4.1. CMOS Image Sensor to Witnesses a Significant Growth
- 4. Market Factor Analysis
- 4.1. Porters Five Forces
- 4.2. Supply/Value Chain
- 4.3. PESTEL analysis
- 4.4. Market Entropy
- 4.5. Patent/Trademark Analysis
- 5. Global Image Sensors Market Analysis, Insights and Forecast, 2019-2031
- 5.1. Market Analysis, Insights and Forecast - by Type
- 5.1.1. CMOS
- 5.1.2. CCD
- 5.2. Market Analysis, Insights and Forecast - by End-user Industry
- 5.2.1. Consumer Electronics
- 5.2.2. Healthcare
- 5.2.3. Industrial
- 5.2.4. Security and Surveillance
- 5.2.5. Automotive and Transportation
- 5.2.6. Aerospace and Defense
- 5.2.7. Other End-user Industries
- 5.3. Market Analysis, Insights and Forecast - by Region
- 5.3.1. North America
- 5.3.2. Europe
- 5.3.3. Asia Pacific
- 5.3.4. Rest of the World
- 5.1. Market Analysis, Insights and Forecast - by Type
- 6. North America Image Sensors Market Analysis, Insights and Forecast, 2019-2031
- 6.1. Market Analysis, Insights and Forecast - by Type
- 6.1.1. CMOS
- 6.1.2. CCD
- 6.2. Market Analysis, Insights and Forecast - by End-user Industry
- 6.2.1. Consumer Electronics
- 6.2.2. Healthcare
- 6.2.3. Industrial
- 6.2.4. Security and Surveillance
- 6.2.5. Automotive and Transportation
- 6.2.6. Aerospace and Defense
- 6.2.7. Other End-user Industries
- 6.1. Market Analysis, Insights and Forecast - by Type
- 7. Europe Image Sensors Market Analysis, Insights and Forecast, 2019-2031
- 7.1. Market Analysis, Insights and Forecast - by Type
- 7.1.1. CMOS
- 7.1.2. CCD
- 7.2. Market Analysis, Insights and Forecast - by End-user Industry
- 7.2.1. Consumer Electronics
- 7.2.2. Healthcare
- 7.2.3. Industrial
- 7.2.4. Security and Surveillance
- 7.2.5. Automotive and Transportation
- 7.2.6. Aerospace and Defense
- 7.2.7. Other End-user Industries
- 7.1. Market Analysis, Insights and Forecast - by Type
- 8. Asia Pacific Image Sensors Market Analysis, Insights and Forecast, 2019-2031
- 8.1. Market Analysis, Insights and Forecast - by Type
- 8.1.1. CMOS
- 8.1.2. CCD
- 8.2. Market Analysis, Insights and Forecast - by End-user Industry
- 8.2.1. Consumer Electronics
- 8.2.2. Healthcare
- 8.2.3. Industrial
- 8.2.4. Security and Surveillance
- 8.2.5. Automotive and Transportation
- 8.2.6. Aerospace and Defense
- 8.2.7. Other End-user Industries
- 8.1. Market Analysis, Insights and Forecast - by Type
- 9. Rest of the World Image Sensors Market Analysis, Insights and Forecast, 2019-2031
- 9.1. Market Analysis, Insights and Forecast - by Type
- 9.1.1. CMOS
- 9.1.2. CCD
- 9.2. Market Analysis, Insights and Forecast - by End-user Industry
- 9.2.1. Consumer Electronics
- 9.2.2. Healthcare
- 9.2.3. Industrial
- 9.2.4. Security and Surveillance
- 9.2.5. Automotive and Transportation
- 9.2.6. Aerospace and Defense
- 9.2.7. Other End-user Industries
- 9.1. Market Analysis, Insights and Forecast - by Type
- 10. North America Image Sensors Market Analysis, Insights and Forecast, 2019-2031
- 10.1. Market Analysis, Insights and Forecast - By Country/Sub-region
- 10.1.1 United States
- 10.1.2 Canada
- 10.1.3 Mexico
- 11. Europe Image Sensors Market Analysis, Insights and Forecast, 2019-2031
- 11.1. Market Analysis, Insights and Forecast - By Country/Sub-region
- 11.1.1 Germany
- 11.1.2 United Kingdom
- 11.1.3 France
- 11.1.4 Spain
- 11.1.5 Italy
- 11.1.6 Spain
- 11.1.7 Belgium
- 11.1.8 Netherland
- 11.1.9 Nordics
- 11.1.10 Rest of Europe
- 12. Asia Pacific Image Sensors Market Analysis, Insights and Forecast, 2019-2031
- 12.1. Market Analysis, Insights and Forecast - By Country/Sub-region
- 12.1.1 China
- 12.1.2 Japan
- 12.1.3 India
- 12.1.4 South Korea
- 12.1.5 Southeast Asia
- 12.1.6 Australia
- 12.1.7 Indonesia
- 12.1.8 Phillipes
- 12.1.9 Singapore
- 12.1.10 Thailandc
- 12.1.11 Rest of Asia Pacific
- 13. South America Image Sensors Market Analysis, Insights and Forecast, 2019-2031
- 13.1. Market Analysis, Insights and Forecast - By Country/Sub-region
- 13.1.1 Brazil
- 13.1.2 Argentina
- 13.1.3 Peru
- 13.1.4 Chile
- 13.1.5 Colombia
- 13.1.6 Ecuador
- 13.1.7 Venezuela
- 13.1.8 Rest of South America
- 14. North America Image Sensors Market Analysis, Insights and Forecast, 2019-2031
- 14.1. Market Analysis, Insights and Forecast - By Country/Sub-region
- 14.1.1 United States
- 14.1.2 Canada
- 14.1.3 Mexico
- 15. MEA Image Sensors Market Analysis, Insights and Forecast, 2019-2031
- 15.1. Market Analysis, Insights and Forecast - By Country/Sub-region
- 15.1.1 United Arab Emirates
- 15.1.2 Saudi Arabia
- 15.1.3 South Africa
- 15.1.4 Rest of Middle East and Africa
- 16. Competitive Analysis
- 16.1. Global Market Share Analysis 2024
- 16.2. Company Profiles
- 16.2.1 Canon Inc
- 16.2.1.1. Overview
- 16.2.1.2. Products
- 16.2.1.3. SWOT Analysis
- 16.2.1.4. Recent Developments
- 16.2.1.5. Financials (Based on Availability)
- 16.2.2 Omnivision Technologies Inc
- 16.2.2.1. Overview
- 16.2.2.2. Products
- 16.2.2.3. SWOT Analysis
- 16.2.2.4. Recent Developments
- 16.2.2.5. Financials (Based on Availability)
- 16.2.3 Teledyne DALSA Inc
- 16.2.3.1. Overview
- 16.2.3.2. Products
- 16.2.3.3. SWOT Analysis
- 16.2.3.4. Recent Developments
- 16.2.3.5. Financials (Based on Availability)
- 16.2.4 Samsung Electronics Co Ltd
- 16.2.4.1. Overview
- 16.2.4.2. Products
- 16.2.4.3. SWOT Analysis
- 16.2.4.4. Recent Developments
- 16.2.4.5. Financials (Based on Availability)
- 16.2.5 STMicroelectronics NV
- 16.2.5.1. Overview
- 16.2.5.2. Products
- 16.2.5.3. SWOT Analysis
- 16.2.5.4. Recent Developments
- 16.2.5.5. Financials (Based on Availability)
- 16.2.6 SK Hynix Inc
- 16.2.6.1. Overview
- 16.2.6.2. Products
- 16.2.6.3. SWOT Analysis
- 16.2.6.4. Recent Developments
- 16.2.6.5. Financials (Based on Availability)
- 16.2.7 Hamamatsu Photonics K K
- 16.2.7.1. Overview
- 16.2.7.2. Products
- 16.2.7.3. SWOT Analysis
- 16.2.7.4. Recent Developments
- 16.2.7.5. Financials (Based on Availability)
- 16.2.8 GalaxyCore Inc
- 16.2.8.1. Overview
- 16.2.8.2. Products
- 16.2.8.3. SWOT Analysis
- 16.2.8.4. Recent Developments
- 16.2.8.5. Financials (Based on Availability)
- 16.2.9 Ams AG
- 16.2.9.1. Overview
- 16.2.9.2. Products
- 16.2.9.3. SWOT Analysis
- 16.2.9.4. Recent Developments
- 16.2.9.5. Financials (Based on Availability)
- 16.2.10 Panasonic Corporation
- 16.2.10.1. Overview
- 16.2.10.2. Products
- 16.2.10.3. SWOT Analysis
- 16.2.10.4. Recent Developments
- 16.2.10.5. Financials (Based on Availability)
- 16.2.11 Sony Corporation
- 16.2.11.1. Overview
- 16.2.11.2. Products
- 16.2.11.3. SWOT Analysis
- 16.2.11.4. Recent Developments
- 16.2.11.5. Financials (Based on Availability)
- 16.2.1 Canon Inc
List of Figures
- Figure 1: Global Image Sensors Market Revenue Breakdown (Million, %) by Region 2024 & 2032
- Figure 2: Global Image Sensors Market Volume Breakdown (K Unit, %) by Region 2024 & 2032
- Figure 3: North America Image Sensors Market Revenue (Million), by Country 2024 & 2032
- Figure 4: North America Image Sensors Market Volume (K Unit), by Country 2024 & 2032
- Figure 5: North America Image Sensors Market Revenue Share (%), by Country 2024 & 2032
- Figure 6: North America Image Sensors Market Volume Share (%), by Country 2024 & 2032
- Figure 7: Europe Image Sensors Market Revenue (Million), by Country 2024 & 2032
- Figure 8: Europe Image Sensors Market Volume (K Unit), by Country 2024 & 2032
- Figure 9: Europe Image Sensors Market Revenue Share (%), by Country 2024 & 2032
- Figure 10: Europe Image Sensors Market Volume Share (%), by Country 2024 & 2032
- Figure 11: Asia Pacific Image Sensors Market Revenue (Million), by Country 2024 & 2032
- Figure 12: Asia Pacific Image Sensors Market Volume (K Unit), by Country 2024 & 2032
- Figure 13: Asia Pacific Image Sensors Market Revenue Share (%), by Country 2024 & 2032
- Figure 14: Asia Pacific Image Sensors Market Volume Share (%), by Country 2024 & 2032
- Figure 15: South America Image Sensors Market Revenue (Million), by Country 2024 & 2032
- Figure 16: South America Image Sensors Market Volume (K Unit), by Country 2024 & 2032
- Figure 17: South America Image Sensors Market Revenue Share (%), by Country 2024 & 2032
- Figure 18: South America Image Sensors Market Volume Share (%), by Country 2024 & 2032
- Figure 19: North America Image Sensors Market Revenue (Million), by Country 2024 & 2032
- Figure 20: North America Image Sensors Market Volume (K Unit), by Country 2024 & 2032
- Figure 21: North America Image Sensors Market Revenue Share (%), by Country 2024 & 2032
- Figure 22: North America Image Sensors Market Volume Share (%), by Country 2024 & 2032
- Figure 23: MEA Image Sensors Market Revenue (Million), by Country 2024 & 2032
- Figure 24: MEA Image Sensors Market Volume (K Unit), by Country 2024 & 2032
- Figure 25: MEA Image Sensors Market Revenue Share (%), by Country 2024 & 2032
- Figure 26: MEA Image Sensors Market Volume Share (%), by Country 2024 & 2032
- Figure 27: North America Image Sensors Market Revenue (Million), by Type 2024 & 2032
- Figure 28: North America Image Sensors Market Volume (K Unit), by Type 2024 & 2032
- Figure 29: North America Image Sensors Market Revenue Share (%), by Type 2024 & 2032
- Figure 30: North America Image Sensors Market Volume Share (%), by Type 2024 & 2032
- Figure 31: North America Image Sensors Market Revenue (Million), by End-user Industry 2024 & 2032
- Figure 32: North America Image Sensors Market Volume (K Unit), by End-user Industry 2024 & 2032
- Figure 33: North America Image Sensors Market Revenue Share (%), by End-user Industry 2024 & 2032
- Figure 34: North America Image Sensors Market Volume Share (%), by End-user Industry 2024 & 2032
- Figure 35: North America Image Sensors Market Revenue (Million), by Country 2024 & 2032
- Figure 36: North America Image Sensors Market Volume (K Unit), by Country 2024 & 2032
- Figure 37: North America Image Sensors Market Revenue Share (%), by Country 2024 & 2032
- Figure 38: North America Image Sensors Market Volume Share (%), by Country 2024 & 2032
- Figure 39: Europe Image Sensors Market Revenue (Million), by Type 2024 & 2032
- Figure 40: Europe Image Sensors Market Volume (K Unit), by Type 2024 & 2032
- Figure 41: Europe Image Sensors Market Revenue Share (%), by Type 2024 & 2032
- Figure 42: Europe Image Sensors Market Volume Share (%), by Type 2024 & 2032
- Figure 43: Europe Image Sensors Market Revenue (Million), by End-user Industry 2024 & 2032
- Figure 44: Europe Image Sensors Market Volume (K Unit), by End-user Industry 2024 & 2032
- Figure 45: Europe Image Sensors Market Revenue Share (%), by End-user Industry 2024 & 2032
- Figure 46: Europe Image Sensors Market Volume Share (%), by End-user Industry 2024 & 2032
- Figure 47: Europe Image Sensors Market Revenue (Million), by Country 2024 & 2032
- Figure 48: Europe Image Sensors Market Volume (K Unit), by Country 2024 & 2032
- Figure 49: Europe Image Sensors Market Revenue Share (%), by Country 2024 & 2032
- Figure 50: Europe Image Sensors Market Volume Share (%), by Country 2024 & 2032
- Figure 51: Asia Pacific Image Sensors Market Revenue (Million), by Type 2024 & 2032
- Figure 52: Asia Pacific Image Sensors Market Volume (K Unit), by Type 2024 & 2032
- Figure 53: Asia Pacific Image Sensors Market Revenue Share (%), by Type 2024 & 2032
- Figure 54: Asia Pacific Image Sensors Market Volume Share (%), by Type 2024 & 2032
- Figure 55: Asia Pacific Image Sensors Market Revenue (Million), by End-user Industry 2024 & 2032
- Figure 56: Asia Pacific Image Sensors Market Volume (K Unit), by End-user Industry 2024 & 2032
- Figure 57: Asia Pacific Image Sensors Market Revenue Share (%), by End-user Industry 2024 & 2032
- Figure 58: Asia Pacific Image Sensors Market Volume Share (%), by End-user Industry 2024 & 2032
- Figure 59: Asia Pacific Image Sensors Market Revenue (Million), by Country 2024 & 2032
- Figure 60: Asia Pacific Image Sensors Market Volume (K Unit), by Country 2024 & 2032
- Figure 61: Asia Pacific Image Sensors Market Revenue Share (%), by Country 2024 & 2032
- Figure 62: Asia Pacific Image Sensors Market Volume Share (%), by Country 2024 & 2032
- Figure 63: Rest of the World Image Sensors Market Revenue (Million), by Type 2024 & 2032
- Figure 64: Rest of the World Image Sensors Market Volume (K Unit), by Type 2024 & 2032
- Figure 65: Rest of the World Image Sensors Market Revenue Share (%), by Type 2024 & 2032
- Figure 66: Rest of the World Image Sensors Market Volume Share (%), by Type 2024 & 2032
- Figure 67: Rest of the World Image Sensors Market Revenue (Million), by End-user Industry 2024 & 2032
- Figure 68: Rest of the World Image Sensors Market Volume (K Unit), by End-user Industry 2024 & 2032
- Figure 69: Rest of the World Image Sensors Market Revenue Share (%), by End-user Industry 2024 & 2032
- Figure 70: Rest of the World Image Sensors Market Volume Share (%), by End-user Industry 2024 & 2032
- Figure 71: Rest of the World Image Sensors Market Revenue (Million), by Country 2024 & 2032
- Figure 72: Rest of the World Image Sensors Market Volume (K Unit), by Country 2024 & 2032
- Figure 73: Rest of the World Image Sensors Market Revenue Share (%), by Country 2024 & 2032
- Figure 74: Rest of the World Image Sensors Market Volume Share (%), by Country 2024 & 2032
List of Tables
- Table 1: Global Image Sensors Market Revenue Million Forecast, by Region 2019 & 2032
- Table 2: Global Image Sensors Market Volume K Unit Forecast, by Region 2019 & 2032
- Table 3: Global Image Sensors Market Revenue Million Forecast, by Type 2019 & 2032
- Table 4: Global Image Sensors Market Volume K Unit Forecast, by Type 2019 & 2032
- Table 5: Global Image Sensors Market Revenue Million Forecast, by End-user Industry 2019 & 2032
- Table 6: Global Image Sensors Market Volume K Unit Forecast, by End-user Industry 2019 & 2032
- Table 7: Global Image Sensors Market Revenue Million Forecast, by Region 2019 & 2032
- Table 8: Global Image Sensors Market Volume K Unit Forecast, by Region 2019 & 2032
- Table 9: Global Image Sensors Market Revenue Million Forecast, by Country 2019 & 2032
- Table 10: Global Image Sensors Market Volume K Unit Forecast, by Country 2019 & 2032
- Table 11: United States Image Sensors Market Revenue (Million) Forecast, by Application 2019 & 2032
- Table 12: United States Image Sensors Market Volume (K Unit) Forecast, by Application 2019 & 2032
- Table 13: Canada Image Sensors Market Revenue (Million) Forecast, by Application 2019 & 2032
- Table 14: Canada Image Sensors Market Volume (K Unit) Forecast, by Application 2019 & 2032
- Table 15: Mexico Image Sensors Market Revenue (Million) Forecast, by Application 2019 & 2032
- Table 16: Mexico Image Sensors Market Volume (K Unit) Forecast, by Application 2019 & 2032
- Table 17: Global Image Sensors Market Revenue Million Forecast, by Country 2019 & 2032
- Table 18: Global Image Sensors Market Volume K Unit Forecast, by Country 2019 & 2032
- Table 19: Germany Image Sensors Market Revenue (Million) Forecast, by Application 2019 & 2032
- Table 20: Germany Image Sensors Market Volume (K Unit) Forecast, by Application 2019 & 2032
- Table 21: United Kingdom Image Sensors Market Revenue (Million) Forecast, by Application 2019 & 2032
- Table 22: United Kingdom Image Sensors Market Volume (K Unit) Forecast, by Application 2019 & 2032
- Table 23: France Image Sensors Market Revenue (Million) Forecast, by Application 2019 & 2032
- Table 24: France Image Sensors Market Volume (K Unit) Forecast, by Application 2019 & 2032
- Table 25: Spain Image Sensors Market Revenue (Million) Forecast, by Application 2019 & 2032
- Table 26: Spain Image Sensors Market Volume (K Unit) Forecast, by Application 2019 & 2032
- Table 27: Italy Image Sensors Market Revenue (Million) Forecast, by Application 2019 & 2032
- Table 28: Italy Image Sensors Market Volume (K Unit) Forecast, by Application 2019 & 2032
- Table 29: Spain Image Sensors Market Revenue (Million) Forecast, by Application 2019 & 2032
- Table 30: Spain Image Sensors Market Volume (K Unit) Forecast, by Application 2019 & 2032
- Table 31: Belgium Image Sensors Market Revenue (Million) Forecast, by Application 2019 & 2032
- Table 32: Belgium Image Sensors Market Volume (K Unit) Forecast, by Application 2019 & 2032
- Table 33: Netherland Image Sensors Market Revenue (Million) Forecast, by Application 2019 & 2032
- Table 34: Netherland Image Sensors Market Volume (K Unit) Forecast, by Application 2019 & 2032
- Table 35: Nordics Image Sensors Market Revenue (Million) Forecast, by Application 2019 & 2032
- Table 36: Nordics Image Sensors Market Volume (K Unit) Forecast, by Application 2019 & 2032
- Table 37: Rest of Europe Image Sensors Market Revenue (Million) Forecast, by Application 2019 & 2032
- Table 38: Rest of Europe Image Sensors Market Volume (K Unit) Forecast, by Application 2019 & 2032
- Table 39: Global Image Sensors Market Revenue Million Forecast, by Country 2019 & 2032
- Table 40: Global Image Sensors Market Volume K Unit Forecast, by Country 2019 & 2032
- Table 41: China Image Sensors Market Revenue (Million) Forecast, by Application 2019 & 2032
- Table 42: China Image Sensors Market Volume (K Unit) Forecast, by Application 2019 & 2032
- Table 43: Japan Image Sensors Market Revenue (Million) Forecast, by Application 2019 & 2032
- Table 44: Japan Image Sensors Market Volume (K Unit) Forecast, by Application 2019 & 2032
- Table 45: India Image Sensors Market Revenue (Million) Forecast, by Application 2019 & 2032
- Table 46: India Image Sensors Market Volume (K Unit) Forecast, by Application 2019 & 2032
- Table 47: South Korea Image Sensors Market Revenue (Million) Forecast, by Application 2019 & 2032
- Table 48: South Korea Image Sensors Market Volume (K Unit) Forecast, by Application 2019 & 2032
- Table 49: Southeast Asia Image Sensors Market Revenue (Million) Forecast, by Application 2019 & 2032
- Table 50: Southeast Asia Image Sensors Market Volume (K Unit) Forecast, by Application 2019 & 2032
- Table 51: Australia Image Sensors Market Revenue (Million) Forecast, by Application 2019 & 2032
- Table 52: Australia Image Sensors Market Volume (K Unit) Forecast, by Application 2019 & 2032
- Table 53: Indonesia Image Sensors Market Revenue (Million) Forecast, by Application 2019 & 2032
- Table 54: Indonesia Image Sensors Market Volume (K Unit) Forecast, by Application 2019 & 2032
- Table 55: Phillipes Image Sensors Market Revenue (Million) Forecast, by Application 2019 & 2032
- Table 56: Phillipes Image Sensors Market Volume (K Unit) Forecast, by Application 2019 & 2032
- Table 57: Singapore Image Sensors Market Revenue (Million) Forecast, by Application 2019 & 2032
- Table 58: Singapore Image Sensors Market Volume (K Unit) Forecast, by Application 2019 & 2032
- Table 59: Thailandc Image Sensors Market Revenue (Million) Forecast, by Application 2019 & 2032
- Table 60: Thailandc Image Sensors Market Volume (K Unit) Forecast, by Application 2019 & 2032
- Table 61: Rest of Asia Pacific Image Sensors Market Revenue (Million) Forecast, by Application 2019 & 2032
- Table 62: Rest of Asia Pacific Image Sensors Market Volume (K Unit) Forecast, by Application 2019 & 2032
- Table 63: Global Image Sensors Market Revenue Million Forecast, by Country 2019 & 2032
- Table 64: Global Image Sensors Market Volume K Unit Forecast, by Country 2019 & 2032
- Table 65: Brazil Image Sensors Market Revenue (Million) Forecast, by Application 2019 & 2032
- Table 66: Brazil Image Sensors Market Volume (K Unit) Forecast, by Application 2019 & 2032
- Table 67: Argentina Image Sensors Market Revenue (Million) Forecast, by Application 2019 & 2032
- Table 68: Argentina Image Sensors Market Volume (K Unit) Forecast, by Application 2019 & 2032
- Table 69: Peru Image Sensors Market Revenue (Million) Forecast, by Application 2019 & 2032
- Table 70: Peru Image Sensors Market Volume (K Unit) Forecast, by Application 2019 & 2032
- Table 71: Chile Image Sensors Market Revenue (Million) Forecast, by Application 2019 & 2032
- Table 72: Chile Image Sensors Market Volume (K Unit) Forecast, by Application 2019 & 2032
- Table 73: Colombia Image Sensors Market Revenue (Million) Forecast, by Application 2019 & 2032
- Table 74: Colombia Image Sensors Market Volume (K Unit) Forecast, by Application 2019 & 2032
- Table 75: Ecuador Image Sensors Market Revenue (Million) Forecast, by Application 2019 & 2032
- Table 76: Ecuador Image Sensors Market Volume (K Unit) Forecast, by Application 2019 & 2032
- Table 77: Venezuela Image Sensors Market Revenue (Million) Forecast, by Application 2019 & 2032
- Table 78: Venezuela Image Sensors Market Volume (K Unit) Forecast, by Application 2019 & 2032
- Table 79: Rest of South America Image Sensors Market Revenue (Million) Forecast, by Application 2019 & 2032
- Table 80: Rest of South America Image Sensors Market Volume (K Unit) Forecast, by Application 2019 & 2032
- Table 81: Global Image Sensors Market Revenue Million Forecast, by Country 2019 & 2032
- Table 82: Global Image Sensors Market Volume K Unit Forecast, by Country 2019 & 2032
- Table 83: United States Image Sensors Market Revenue (Million) Forecast, by Application 2019 & 2032
- Table 84: United States Image Sensors Market Volume (K Unit) Forecast, by Application 2019 & 2032
- Table 85: Canada Image Sensors Market Revenue (Million) Forecast, by Application 2019 & 2032
- Table 86: Canada Image Sensors Market Volume (K Unit) Forecast, by Application 2019 & 2032
- Table 87: Mexico Image Sensors Market Revenue (Million) Forecast, by Application 2019 & 2032
- Table 88: Mexico Image Sensors Market Volume (K Unit) Forecast, by Application 2019 & 2032
- Table 89: Global Image Sensors Market Revenue Million Forecast, by Country 2019 & 2032
- Table 90: Global Image Sensors Market Volume K Unit Forecast, by Country 2019 & 2032
- Table 91: United Arab Emirates Image Sensors Market Revenue (Million) Forecast, by Application 2019 & 2032
- Table 92: United Arab Emirates Image Sensors Market Volume (K Unit) Forecast, by Application 2019 & 2032
- Table 93: Saudi Arabia Image Sensors Market Revenue (Million) Forecast, by Application 2019 & 2032
- Table 94: Saudi Arabia Image Sensors Market Volume (K Unit) Forecast, by Application 2019 & 2032
- Table 95: South Africa Image Sensors Market Revenue (Million) Forecast, by Application 2019 & 2032
- Table 96: South Africa Image Sensors Market Volume (K Unit) Forecast, by Application 2019 & 2032
- Table 97: Rest of Middle East and Africa Image Sensors Market Revenue (Million) Forecast, by Application 2019 & 2032
- Table 98: Rest of Middle East and Africa Image Sensors Market Volume (K Unit) Forecast, by Application 2019 & 2032
- Table 99: Global Image Sensors Market Revenue Million Forecast, by Type 2019 & 2032
- Table 100: Global Image Sensors Market Volume K Unit Forecast, by Type 2019 & 2032
- Table 101: Global Image Sensors Market Revenue Million Forecast, by End-user Industry 2019 & 2032
- Table 102: Global Image Sensors Market Volume K Unit Forecast, by End-user Industry 2019 & 2032
- Table 103: Global Image Sensors Market Revenue Million Forecast, by Country 2019 & 2032
- Table 104: Global Image Sensors Market Volume K Unit Forecast, by Country 2019 & 2032
- Table 105: United States Image Sensors Market Revenue (Million) Forecast, by Application 2019 & 2032
- Table 106: United States Image Sensors Market Volume (K Unit) Forecast, by Application 2019 & 2032
- Table 107: Canada Image Sensors Market Revenue (Million) Forecast, by Application 2019 & 2032
- Table 108: Canada Image Sensors Market Volume (K Unit) Forecast, by Application 2019 & 2032
- Table 109: Global Image Sensors Market Revenue Million Forecast, by Type 2019 & 2032
- Table 110: Global Image Sensors Market Volume K Unit Forecast, by Type 2019 & 2032
- Table 111: Global Image Sensors Market Revenue Million Forecast, by End-user Industry 2019 & 2032
- Table 112: Global Image Sensors Market Volume K Unit Forecast, by End-user Industry 2019 & 2032
- Table 113: Global Image Sensors Market Revenue Million Forecast, by Country 2019 & 2032
- Table 114: Global Image Sensors Market Volume K Unit Forecast, by Country 2019 & 2032
- Table 115: United Kingdom Image Sensors Market Revenue (Million) Forecast, by Application 2019 & 2032
- Table 116: United Kingdom Image Sensors Market Volume (K Unit) Forecast, by Application 2019 & 2032
- Table 117: Germany Image Sensors Market Revenue (Million) Forecast, by Application 2019 & 2032
- Table 118: Germany Image Sensors Market Volume (K Unit) Forecast, by Application 2019 & 2032
- Table 119: France Image Sensors Market Revenue (Million) Forecast, by Application 2019 & 2032
- Table 120: France Image Sensors Market Volume (K Unit) Forecast, by Application 2019 & 2032
- Table 121: Rest of Europe Image Sensors Market Revenue (Million) Forecast, by Application 2019 & 2032
- Table 122: Rest of Europe Image Sensors Market Volume (K Unit) Forecast, by Application 2019 & 2032
- Table 123: Global Image Sensors Market Revenue Million Forecast, by Type 2019 & 2032
- Table 124: Global Image Sensors Market Volume K Unit Forecast, by Type 2019 & 2032
- Table 125: Global Image Sensors Market Revenue Million Forecast, by End-user Industry 2019 & 2032
- Table 126: Global Image Sensors Market Volume K Unit Forecast, by End-user Industry 2019 & 2032
- Table 127: Global Image Sensors Market Revenue Million Forecast, by Country 2019 & 2032
- Table 128: Global Image Sensors Market Volume K Unit Forecast, by Country 2019 & 2032
- Table 129: China Image Sensors Market Revenue (Million) Forecast, by Application 2019 & 2032
- Table 130: China Image Sensors Market Volume (K Unit) Forecast, by Application 2019 & 2032
- Table 131: India Image Sensors Market Revenue (Million) Forecast, by Application 2019 & 2032
- Table 132: India Image Sensors Market Volume (K Unit) Forecast, by Application 2019 & 2032
- Table 133: Japan Image Sensors Market Revenue (Million) Forecast, by Application 2019 & 2032
- Table 134: Japan Image Sensors Market Volume (K Unit) Forecast, by Application 2019 & 2032
- Table 135: Rest of Asia Pacific Image Sensors Market Revenue (Million) Forecast, by Application 2019 & 2032
- Table 136: Rest of Asia Pacific Image Sensors Market Volume (K Unit) Forecast, by Application 2019 & 2032
- Table 137: Global Image Sensors Market Revenue Million Forecast, by Type 2019 & 2032
- Table 138: Global Image Sensors Market Volume K Unit Forecast, by Type 2019 & 2032
- Table 139: Global Image Sensors Market Revenue Million Forecast, by End-user Industry 2019 & 2032
- Table 140: Global Image Sensors Market Volume K Unit Forecast, by End-user Industry 2019 & 2032
- Table 141: Global Image Sensors Market Revenue Million Forecast, by Country 2019 & 2032
- Table 142: Global Image Sensors Market Volume K Unit Forecast, by Country 2019 & 2032
Frequently Asked Questions
1. What is the projected Compound Annual Growth Rate (CAGR) of the Image Sensors Market?
The projected CAGR is approximately 8.24%.
2. Which companies are prominent players in the Image Sensors Market?
Key companies in the market include Canon Inc, Omnivision Technologies Inc, Teledyne DALSA Inc, Samsung Electronics Co Ltd, STMicroelectronics NV, SK Hynix Inc, Hamamatsu Photonics K K, GalaxyCore Inc, Ams AG, Panasonic Corporation, Sony Corporation.
3. What are the main segments of the Image Sensors Market?
The market segments include Type, End-user Industry.
4. Can you provide details about the market size?
The market size is estimated to be USD 28.32 Million as of 2022.
5. What are some drivers contributing to market growth?
Increasing Demand in Automotive Sector; Demand for Gesture Recognition/Control in Vertical Applications.
6. What are the notable trends driving market growth?
CMOS Image Sensor to Witnesses a Significant Growth.
7. Are there any restraints impacting market growth?
; Easy availability of light detection and ranging (LiDAR) solutions..
8. Can you provide examples of recent developments in the market?
N/A
9. What pricing options are available for accessing the report?
Pricing options include single-user, multi-user, and enterprise licenses priced at USD 4750, USD 5250, and USD 8750 respectively.
10. Is the market size provided in terms of value or volume?
The market size is provided in terms of value, measured in Million and volume, measured in K Unit.
11. Are there any specific market keywords associated with the report?
Yes, the market keyword associated with the report is "Image Sensors Market," which aids in identifying and referencing the specific market segment covered.
12. How do I determine which pricing option suits my needs best?
The pricing options vary based on user requirements and access needs. Individual users may opt for single-user licenses, while businesses requiring broader access may choose multi-user or enterprise licenses for cost-effective access to the report.
13. Are there any additional resources or data provided in the Image Sensors Market report?
While the report offers comprehensive insights, it's advisable to review the specific contents or supplementary materials provided to ascertain if additional resources or data are available.
14. How can I stay updated on further developments or reports in the Image Sensors Market?
To stay informed about further developments, trends, and reports in the Image Sensors Market, consider subscribing to industry newsletters, following relevant companies and organizations, or regularly checking reputable industry news sources and publications.
Methodology
Step 1 - Identification of Relevant Samples Size from Population Database


Step 2 - Approaches for Defining Global Market Size (Value, Volume* & Price*)

Note*: In applicable scenarios
Step 3 - Data Sources
Primary Research
- Web Analytics
- Survey Reports
- Research Institute
- Latest Research Reports
- Opinion Leaders
Secondary Research
- Annual Reports
- White Paper
- Latest Press Release
- Industry Association
- Paid Database
- Investor Presentations

Step 4 - Data Triangulation
Involves using different sources of information in order to increase the validity of a study
These sources are likely to be stakeholders in a program - participants, other researchers, program staff, other community members, and so on.
Then we put all data in single framework & apply various statistical tools to find out the dynamic on the market.
During the analysis stage, feedback from the stakeholder groups would be compared to determine areas of agreement as well as areas of divergence
