

Key Insights
The global Infrared (IR) and Thermal Imaging Systems market is experiencing robust growth, projected to reach a substantial size by 2033. A Compound Annual Growth Rate (CAGR) of 9.84% from 2019 to 2024 suggests a consistently expanding market driven by several key factors. Increased demand across diverse sectors, including industrial automation, security surveillance, and automotive applications, fuels this expansion. Advancements in sensor technology, leading to enhanced image resolution, sensitivity, and reduced costs, are pivotal drivers. The rising adoption of thermal imaging for predictive maintenance in industrial settings minimizes downtime and optimizes operational efficiency, further boosting market growth. Furthermore, government initiatives promoting security and safety, coupled with the increasing awareness of the benefits of non-destructive testing in various industries, significantly contribute to the market's expansion. The market segmentation reveals strong growth in handheld devices due to their portability and ease of use, especially in applications like law enforcement and building inspections. However, the high initial investment required for advanced systems might act as a restraint, particularly for smaller businesses.
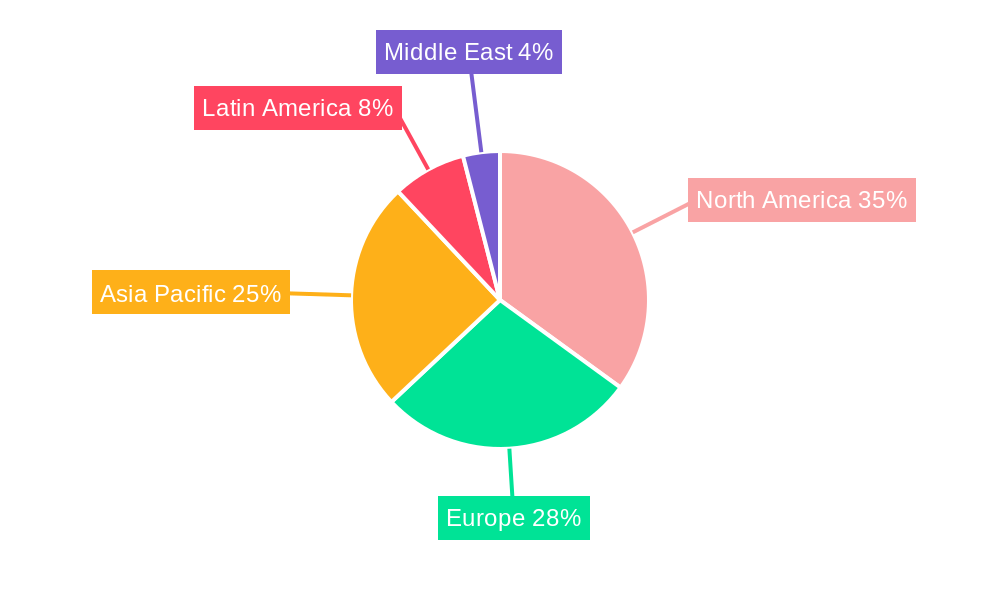
The market's geographical distribution shows significant potential across regions. North America currently holds a considerable market share due to strong technological advancements and high adoption rates, particularly in defense and security. The Asia-Pacific region exhibits significant growth potential driven by rapid industrialization and urbanization in countries like China and India. Europe and the Middle East are also expected to contribute substantially to market growth, albeit at a potentially slightly slower pace than the Asia-Pacific region. To sustain this growth, manufacturers are focusing on developing innovative solutions integrating artificial intelligence (AI) and machine learning (ML) for improved image analysis and data interpretation. This evolution enhances the value proposition for customers across various applications, driving further expansion in the coming years.

IR and Thermal Imaging Systems Market: A Comprehensive Market Report (2019-2033)
This comprehensive report provides a detailed analysis of the IR and Thermal Imaging Systems market, encompassing its dynamics, growth trends, key players, and future outlook. The study period covers 2019-2033, with 2025 as the base and estimated year. The forecast period is 2025-2033, and the historical period is 2019-2024. The market is segmented by solutions (hardware, software, services), applications (industrial, security, R&D, construction, maritime, transportation, law enforcement, others), and form factor (handheld, fixed mounted). The parent market is the Imaging Systems market, while the child market is the specialized IR and Thermal Imaging Systems segment.
IR and Thermal Imaging Systems Market Market Dynamics & Structure
The IR and Thermal Imaging Systems market is characterized by moderate concentration, with key players holding significant market share. The market size in 2025 is estimated at xx Million. Technological innovation, particularly in sensor technology and image processing, is a key driver. Stringent regulatory frameworks in certain sectors (e.g., aviation) impact market growth. Competitive substitutes exist in some applications (e.g., radar), but the unique capabilities of thermal imaging maintain its strong position. End-user demographics are diverse, spanning military, industrial, and commercial applications. M&A activity has been moderate in recent years, with xx deals recorded between 2019 and 2024.
- Market Concentration: Moderately concentrated, with top 5 players holding approximately xx% market share in 2025.
- Technological Innovation: Significant advancements in sensor resolution, thermal sensitivity, and image processing algorithms drive market growth.
- Regulatory Frameworks: Stringent regulations in specific sectors (e.g., aerospace) influence market dynamics.
- Competitive Substitutes: Limited substitutes exist, mainly in niche applications.
- End-User Demographics: Diverse user base across various sectors, including military, industrial, and commercial.
- M&A Trends: Moderate M&A activity, with an average of xx deals annually between 2019-2024.
IR and Thermal Imaging Systems Market Growth Trends & Insights
The IR and Thermal Imaging Systems market has experienced steady growth over the past few years, driven by increasing demand across various applications. The market size is projected to reach xx Million by 2033, exhibiting a CAGR of xx% during the forecast period. This growth is fueled by technological advancements leading to improved image quality, reduced costs, and wider adoption in diverse sectors. The increasing prevalence of security concerns and the need for advanced surveillance systems is a primary growth driver. Consumer behavior is shifting towards more sophisticated and user-friendly systems with enhanced features. The market penetration rate in key sectors is projected to increase significantly over the forecast period. Specific growth drivers include miniaturization, improved affordability, and increasing applications in non-traditional sectors.

Dominant Regions, Countries, or Segments in IR and Thermal Imaging Systems Market
North America currently holds the largest market share, driven by strong demand from defense and security sectors. However, the Asia-Pacific region is expected to witness the highest growth rate during the forecast period due to rapid industrialization and increasing investment in infrastructure. Within the segments, the hardware segment dominates, accounting for xx% of the market in 2025. The industrial and security applications segments are the largest end-use sectors, driving significant market demand.
- North America: High market share driven by strong demand from defense and security sectors, coupled with technological advancements.
- Asia-Pacific: Highest growth rate due to rapid industrialization, infrastructure development, and increasing government spending.
- Europe: Steady growth driven by increasing adoption in industrial and automotive sectors.
- Hardware Segment: Dominates the market, accounting for the largest share.
- Industrial & Security Applications: Largest end-use sectors, exhibiting high growth potential.
IR and Thermal Imaging Systems Market Product Landscape
The product landscape is characterized by a wide range of systems, varying in resolution, sensitivity, and features. Recent innovations focus on enhanced image processing, improved thermal sensitivity, and smaller form factors. Unique selling propositions include advanced image fusion, improved target detection, and user-friendly interfaces. Technological advancements such as microbolometer technology and improved cooling systems are driving the market.
Key Drivers, Barriers & Challenges in IR and Thermal Imaging Systems Market
Key Drivers: Increasing demand for enhanced security systems, advancements in sensor technology, growing adoption in industrial applications, and government initiatives promoting technology adoption.
Challenges: High initial investment costs, complex integration requirements in some applications, and potential regulatory hurdles. Supply chain disruptions may also impact production and pricing. Competition from alternative technologies presents a significant challenge.
Emerging Opportunities in IR and Thermal Imaging Systems Market
Untapped markets include the expanding use of thermal imaging in precision agriculture, building inspections, and medical diagnostics. Opportunities arise from integration with AI and machine learning to improve image analysis and automation. Growing consumer demand for user-friendly systems with advanced features presents an opportunity for innovative product development.
Growth Accelerators in the IR and Thermal Imaging Systems Market Industry
Technological breakthroughs, strategic partnerships and collaborations, and aggressive marketing and expansion strategies will accelerate growth. Focusing on integrating thermal imaging into other systems like drones and robotics will create substantial new opportunities.
Key Players Shaping the IR and Thermal Imaging Systems Market Market
- Thermoteknix Systems Ltd
- Elbit Systems Ltd
- Bae Systems PLC
- Lockheed Martin
- Raytheon
- ULIS
- Leonardo DRS
- L-3 Communications Holdings
- Flir Systems Inc
- Sofradir Group
Notable Milestones in IR and Thermal Imaging Systems Market Sector
- 2020: Launch of a new high-resolution thermal imaging camera by Flir Systems.
- 2021: Acquisition of a smaller thermal imaging company by Lockheed Martin.
- 2022: Introduction of AI-powered image analysis software by a leading thermal imaging systems provider.
- 2023: Several significant partnerships between thermal imaging companies and drone manufacturers.
- 2024: Significant advancements in uncooled microbolometer technology are announced by multiple companies.
In-Depth IR and Thermal Imaging Systems Market Market Outlook
The IR and Thermal Imaging Systems market is poised for strong growth in the coming years, driven by technological advancements, increasing demand across various sectors, and the emergence of new applications. Strategic partnerships and acquisitions will play a key role in shaping market dynamics. Focus on developing smaller, more cost-effective solutions, combined with advanced features, will continue to drive adoption. The market offers promising opportunities for players willing to innovate and adapt to the evolving needs of diverse industries.
IR and Thermal Imaging Systems Market Segmentation
-
1. Solutions
- 1.1. Hardware
- 1.2. Software
- 1.3. Services
-
2. Applications
- 2.1. Industrial
- 2.2. Security
- 2.3. Research and Development
- 2.4. Construction Industry
- 2.5. Maritime
- 2.6. Transportation
- 2.7. Law Enforcement Agencies
- 2.8. Other Applications
-
3. Form Factor
- 3.1. Handheld Imaging Devices and Systems
- 3.2. Fixed Mounted (Rotary and Non-Rotary)
IR and Thermal Imaging Systems Market Segmentation By Geography
-
1. North America
- 1.1. United States
- 1.2. Canada
-
2. Europe
- 2.1. United Kingdom
- 2.2. Germany
- 2.3. France
-
3. Asia
- 3.1. China
- 3.2. Japan
- 3.3. India
- 4. Australia and New Zealand
-
5. Latin America
- 5.1. Brazil
- 5.2. Mexico
- 5.3. Argentina
-
6. Middle East and Africa
- 6.1. Saudi Arabia
- 6.2. United Arab Emirates
- 6.3. South Africa
IR and Thermal Imaging Systems Market REPORT HIGHLIGHTS
| Aspects | Details |
|---|---|
| Study Period | 2019-2033 |
| Base Year | 2024 |
| Estimated Year | 2025 |
| Forecast Period | 2025-2033 |
| Historical Period | 2019-2024 |
| Growth Rate | CAGR of 9.84% from 2019-2033 |
| Segmentation |
|
Table of Contents
- 1. Introduction
- 1.1. Research Scope
- 1.2. Market Segmentation
- 1.3. Research Methodology
- 1.4. Definitions and Assumptions
- 2. Executive Summary
- 2.1. Introduction
- 3. Market Dynamics
- 3.1. Introduction
- 3.2. Market Drivers
- 3.2.1. ; Low Cost Solutions; Increasing Usage Across Industries; Low Impact on the Environment
- 3.3. Market Restrains
- 3.3.1. ; Lack of Regular Support and Services
- 3.4. Market Trends
- 3.4.1. Industrial Applications are Expected to Have a Major Market Share
- 4. Market Factor Analysis
- 4.1. Porters Five Forces
- 4.2. Supply/Value Chain
- 4.3. PESTEL analysis
- 4.4. Market Entropy
- 4.5. Patent/Trademark Analysis
- 5. Global IR and Thermal Imaging Systems Market Analysis, Insights and Forecast, 2019-2031
- 5.1. Market Analysis, Insights and Forecast - by Solutions
- 5.1.1. Hardware
- 5.1.2. Software
- 5.1.3. Services
- 5.2. Market Analysis, Insights and Forecast - by Applications
- 5.2.1. Industrial
- 5.2.2. Security
- 5.2.3. Research and Development
- 5.2.4. Construction Industry
- 5.2.5. Maritime
- 5.2.6. Transportation
- 5.2.7. Law Enforcement Agencies
- 5.2.8. Other Applications
- 5.3. Market Analysis, Insights and Forecast - by Form Factor
- 5.3.1. Handheld Imaging Devices and Systems
- 5.3.2. Fixed Mounted (Rotary and Non-Rotary)
- 5.4. Market Analysis, Insights and Forecast - by Region
- 5.4.1. North America
- 5.4.2. Europe
- 5.4.3. Asia
- 5.4.4. Australia and New Zealand
- 5.4.5. Latin America
- 5.4.6. Middle East and Africa
- 5.1. Market Analysis, Insights and Forecast - by Solutions
- 6. North America IR and Thermal Imaging Systems Market Analysis, Insights and Forecast, 2019-2031
- 6.1. Market Analysis, Insights and Forecast - by Solutions
- 6.1.1. Hardware
- 6.1.2. Software
- 6.1.3. Services
- 6.2. Market Analysis, Insights and Forecast - by Applications
- 6.2.1. Industrial
- 6.2.2. Security
- 6.2.3. Research and Development
- 6.2.4. Construction Industry
- 6.2.5. Maritime
- 6.2.6. Transportation
- 6.2.7. Law Enforcement Agencies
- 6.2.8. Other Applications
- 6.3. Market Analysis, Insights and Forecast - by Form Factor
- 6.3.1. Handheld Imaging Devices and Systems
- 6.3.2. Fixed Mounted (Rotary and Non-Rotary)
- 6.1. Market Analysis, Insights and Forecast - by Solutions
- 7. Europe IR and Thermal Imaging Systems Market Analysis, Insights and Forecast, 2019-2031
- 7.1. Market Analysis, Insights and Forecast - by Solutions
- 7.1.1. Hardware
- 7.1.2. Software
- 7.1.3. Services
- 7.2. Market Analysis, Insights and Forecast - by Applications
- 7.2.1. Industrial
- 7.2.2. Security
- 7.2.3. Research and Development
- 7.2.4. Construction Industry
- 7.2.5. Maritime
- 7.2.6. Transportation
- 7.2.7. Law Enforcement Agencies
- 7.2.8. Other Applications
- 7.3. Market Analysis, Insights and Forecast - by Form Factor
- 7.3.1. Handheld Imaging Devices and Systems
- 7.3.2. Fixed Mounted (Rotary and Non-Rotary)
- 7.1. Market Analysis, Insights and Forecast - by Solutions
- 8. Asia IR and Thermal Imaging Systems Market Analysis, Insights and Forecast, 2019-2031
- 8.1. Market Analysis, Insights and Forecast - by Solutions
- 8.1.1. Hardware
- 8.1.2. Software
- 8.1.3. Services
- 8.2. Market Analysis, Insights and Forecast - by Applications
- 8.2.1. Industrial
- 8.2.2. Security
- 8.2.3. Research and Development
- 8.2.4. Construction Industry
- 8.2.5. Maritime
- 8.2.6. Transportation
- 8.2.7. Law Enforcement Agencies
- 8.2.8. Other Applications
- 8.3. Market Analysis, Insights and Forecast - by Form Factor
- 8.3.1. Handheld Imaging Devices and Systems
- 8.3.2. Fixed Mounted (Rotary and Non-Rotary)
- 8.1. Market Analysis, Insights and Forecast - by Solutions
- 9. Australia and New Zealand IR and Thermal Imaging Systems Market Analysis, Insights and Forecast, 2019-2031
- 9.1. Market Analysis, Insights and Forecast - by Solutions
- 9.1.1. Hardware
- 9.1.2. Software
- 9.1.3. Services
- 9.2. Market Analysis, Insights and Forecast - by Applications
- 9.2.1. Industrial
- 9.2.2. Security
- 9.2.3. Research and Development
- 9.2.4. Construction Industry
- 9.2.5. Maritime
- 9.2.6. Transportation
- 9.2.7. Law Enforcement Agencies
- 9.2.8. Other Applications
- 9.3. Market Analysis, Insights and Forecast - by Form Factor
- 9.3.1. Handheld Imaging Devices and Systems
- 9.3.2. Fixed Mounted (Rotary and Non-Rotary)
- 9.1. Market Analysis, Insights and Forecast - by Solutions
- 10. Latin America IR and Thermal Imaging Systems Market Analysis, Insights and Forecast, 2019-2031
- 10.1. Market Analysis, Insights and Forecast - by Solutions
- 10.1.1. Hardware
- 10.1.2. Software
- 10.1.3. Services
- 10.2. Market Analysis, Insights and Forecast - by Applications
- 10.2.1. Industrial
- 10.2.2. Security
- 10.2.3. Research and Development
- 10.2.4. Construction Industry
- 10.2.5. Maritime
- 10.2.6. Transportation
- 10.2.7. Law Enforcement Agencies
- 10.2.8. Other Applications
- 10.3. Market Analysis, Insights and Forecast - by Form Factor
- 10.3.1. Handheld Imaging Devices and Systems
- 10.3.2. Fixed Mounted (Rotary and Non-Rotary)
- 10.1. Market Analysis, Insights and Forecast - by Solutions
- 11. Middle East and Africa IR and Thermal Imaging Systems Market Analysis, Insights and Forecast, 2019-2031
- 11.1. Market Analysis, Insights and Forecast - by Solutions
- 11.1.1. Hardware
- 11.1.2. Software
- 11.1.3. Services
- 11.2. Market Analysis, Insights and Forecast - by Applications
- 11.2.1. Industrial
- 11.2.2. Security
- 11.2.3. Research and Development
- 11.2.4. Construction Industry
- 11.2.5. Maritime
- 11.2.6. Transportation
- 11.2.7. Law Enforcement Agencies
- 11.2.8. Other Applications
- 11.3. Market Analysis, Insights and Forecast - by Form Factor
- 11.3.1. Handheld Imaging Devices and Systems
- 11.3.2. Fixed Mounted (Rotary and Non-Rotary)
- 11.1. Market Analysis, Insights and Forecast - by Solutions
- 12. North America IR and Thermal Imaging Systems Market Analysis, Insights and Forecast, 2019-2031
- 12.1. Market Analysis, Insights and Forecast - By Country/Sub-region
- 12.1.1 United States
- 12.1.2 Canada
- 13. Europe IR and Thermal Imaging Systems Market Analysis, Insights and Forecast, 2019-2031
- 13.1. Market Analysis, Insights and Forecast - By Country/Sub-region
- 13.1.1 United Kingdom
- 13.1.2 Germany
- 13.1.3 France
- 13.1.4 Rest of Europe
- 14. Asia Pacific IR and Thermal Imaging Systems Market Analysis, Insights and Forecast, 2019-2031
- 14.1. Market Analysis, Insights and Forecast - By Country/Sub-region
- 14.1.1 China
- 14.1.2 Japan
- 14.1.3 India
- 14.1.4 Rest of Asia Pacific
- 15. Latin America IR and Thermal Imaging Systems Market Analysis, Insights and Forecast, 2019-2031
- 15.1. Market Analysis, Insights and Forecast - By Country/Sub-region
- 15.1.1 Brazil
- 15.1.2 Mexico
- 15.1.3 Argentina
- 15.1.4 Rest of Latin America
- 16. Middle East IR and Thermal Imaging Systems Market Analysis, Insights and Forecast, 2019-2031
- 16.1. Market Analysis, Insights and Forecast - By Country/Sub-region
- 16.1.1.
- 17. Saudi Arabia IR and Thermal Imaging Systems Market Analysis, Insights and Forecast, 2019-2031
- 17.1. Market Analysis, Insights and Forecast - By Country/Sub-region
- 17.1.1 United Arab Emirates
- 17.1.2 South Africa
- 17.1.3 Rest of Middle East
- 18. Competitive Analysis
- 18.1. Global Market Share Analysis 2024
- 18.2. Company Profiles
- 18.2.1 Thermoteknix Systems Ltd *List Not Exhaustive
- 18.2.1.1. Overview
- 18.2.1.2. Products
- 18.2.1.3. SWOT Analysis
- 18.2.1.4. Recent Developments
- 18.2.1.5. Financials (Based on Availability)
- 18.2.2 Elbit Systems Ltd
- 18.2.2.1. Overview
- 18.2.2.2. Products
- 18.2.2.3. SWOT Analysis
- 18.2.2.4. Recent Developments
- 18.2.2.5. Financials (Based on Availability)
- 18.2.3 Bae Systems PLC
- 18.2.3.1. Overview
- 18.2.3.2. Products
- 18.2.3.3. SWOT Analysis
- 18.2.3.4. Recent Developments
- 18.2.3.5. Financials (Based on Availability)
- 18.2.4 Lockheed Martin
- 18.2.4.1. Overview
- 18.2.4.2. Products
- 18.2.4.3. SWOT Analysis
- 18.2.4.4. Recent Developments
- 18.2.4.5. Financials (Based on Availability)
- 18.2.5 Raytheon
- 18.2.5.1. Overview
- 18.2.5.2. Products
- 18.2.5.3. SWOT Analysis
- 18.2.5.4. Recent Developments
- 18.2.5.5. Financials (Based on Availability)
- 18.2.6 ULIS
- 18.2.6.1. Overview
- 18.2.6.2. Products
- 18.2.6.3. SWOT Analysis
- 18.2.6.4. Recent Developments
- 18.2.6.5. Financials (Based on Availability)
- 18.2.7 Leonardo DRS
- 18.2.7.1. Overview
- 18.2.7.2. Products
- 18.2.7.3. SWOT Analysis
- 18.2.7.4. Recent Developments
- 18.2.7.5. Financials (Based on Availability)
- 18.2.8 L-3 Communications Holdings
- 18.2.8.1. Overview
- 18.2.8.2. Products
- 18.2.8.3. SWOT Analysis
- 18.2.8.4. Recent Developments
- 18.2.8.5. Financials (Based on Availability)
- 18.2.9 Flir Systems Inc
- 18.2.9.1. Overview
- 18.2.9.2. Products
- 18.2.9.3. SWOT Analysis
- 18.2.9.4. Recent Developments
- 18.2.9.5. Financials (Based on Availability)
- 18.2.10 Sofradir Group
- 18.2.10.1. Overview
- 18.2.10.2. Products
- 18.2.10.3. SWOT Analysis
- 18.2.10.4. Recent Developments
- 18.2.10.5. Financials (Based on Availability)
- 18.2.1 Thermoteknix Systems Ltd *List Not Exhaustive
List of Figures
- Figure 1: Global IR and Thermal Imaging Systems Market Revenue Breakdown (Million, %) by Region 2024 & 2032
- Figure 2: North America IR and Thermal Imaging Systems Market Revenue (Million), by Country 2024 & 2032
- Figure 3: North America IR and Thermal Imaging Systems Market Revenue Share (%), by Country 2024 & 2032
- Figure 4: Europe IR and Thermal Imaging Systems Market Revenue (Million), by Country 2024 & 2032
- Figure 5: Europe IR and Thermal Imaging Systems Market Revenue Share (%), by Country 2024 & 2032
- Figure 6: Asia Pacific IR and Thermal Imaging Systems Market Revenue (Million), by Country 2024 & 2032
- Figure 7: Asia Pacific IR and Thermal Imaging Systems Market Revenue Share (%), by Country 2024 & 2032
- Figure 8: Latin America IR and Thermal Imaging Systems Market Revenue (Million), by Country 2024 & 2032
- Figure 9: Latin America IR and Thermal Imaging Systems Market Revenue Share (%), by Country 2024 & 2032
- Figure 10: Middle East IR and Thermal Imaging Systems Market Revenue (Million), by Country 2024 & 2032
- Figure 11: Middle East IR and Thermal Imaging Systems Market Revenue Share (%), by Country 2024 & 2032
- Figure 12: Saudi Arabia IR and Thermal Imaging Systems Market Revenue (Million), by Country 2024 & 2032
- Figure 13: Saudi Arabia IR and Thermal Imaging Systems Market Revenue Share (%), by Country 2024 & 2032
- Figure 14: North America IR and Thermal Imaging Systems Market Revenue (Million), by Solutions 2024 & 2032
- Figure 15: North America IR and Thermal Imaging Systems Market Revenue Share (%), by Solutions 2024 & 2032
- Figure 16: North America IR and Thermal Imaging Systems Market Revenue (Million), by Applications 2024 & 2032
- Figure 17: North America IR and Thermal Imaging Systems Market Revenue Share (%), by Applications 2024 & 2032
- Figure 18: North America IR and Thermal Imaging Systems Market Revenue (Million), by Form Factor 2024 & 2032
- Figure 19: North America IR and Thermal Imaging Systems Market Revenue Share (%), by Form Factor 2024 & 2032
- Figure 20: North America IR and Thermal Imaging Systems Market Revenue (Million), by Country 2024 & 2032
- Figure 21: North America IR and Thermal Imaging Systems Market Revenue Share (%), by Country 2024 & 2032
- Figure 22: Europe IR and Thermal Imaging Systems Market Revenue (Million), by Solutions 2024 & 2032
- Figure 23: Europe IR and Thermal Imaging Systems Market Revenue Share (%), by Solutions 2024 & 2032
- Figure 24: Europe IR and Thermal Imaging Systems Market Revenue (Million), by Applications 2024 & 2032
- Figure 25: Europe IR and Thermal Imaging Systems Market Revenue Share (%), by Applications 2024 & 2032
- Figure 26: Europe IR and Thermal Imaging Systems Market Revenue (Million), by Form Factor 2024 & 2032
- Figure 27: Europe IR and Thermal Imaging Systems Market Revenue Share (%), by Form Factor 2024 & 2032
- Figure 28: Europe IR and Thermal Imaging Systems Market Revenue (Million), by Country 2024 & 2032
- Figure 29: Europe IR and Thermal Imaging Systems Market Revenue Share (%), by Country 2024 & 2032
- Figure 30: Asia IR and Thermal Imaging Systems Market Revenue (Million), by Solutions 2024 & 2032
- Figure 31: Asia IR and Thermal Imaging Systems Market Revenue Share (%), by Solutions 2024 & 2032
- Figure 32: Asia IR and Thermal Imaging Systems Market Revenue (Million), by Applications 2024 & 2032
- Figure 33: Asia IR and Thermal Imaging Systems Market Revenue Share (%), by Applications 2024 & 2032
- Figure 34: Asia IR and Thermal Imaging Systems Market Revenue (Million), by Form Factor 2024 & 2032
- Figure 35: Asia IR and Thermal Imaging Systems Market Revenue Share (%), by Form Factor 2024 & 2032
- Figure 36: Asia IR and Thermal Imaging Systems Market Revenue (Million), by Country 2024 & 2032
- Figure 37: Asia IR and Thermal Imaging Systems Market Revenue Share (%), by Country 2024 & 2032
- Figure 38: Australia and New Zealand IR and Thermal Imaging Systems Market Revenue (Million), by Solutions 2024 & 2032
- Figure 39: Australia and New Zealand IR and Thermal Imaging Systems Market Revenue Share (%), by Solutions 2024 & 2032
- Figure 40: Australia and New Zealand IR and Thermal Imaging Systems Market Revenue (Million), by Applications 2024 & 2032
- Figure 41: Australia and New Zealand IR and Thermal Imaging Systems Market Revenue Share (%), by Applications 2024 & 2032
- Figure 42: Australia and New Zealand IR and Thermal Imaging Systems Market Revenue (Million), by Form Factor 2024 & 2032
- Figure 43: Australia and New Zealand IR and Thermal Imaging Systems Market Revenue Share (%), by Form Factor 2024 & 2032
- Figure 44: Australia and New Zealand IR and Thermal Imaging Systems Market Revenue (Million), by Country 2024 & 2032
- Figure 45: Australia and New Zealand IR and Thermal Imaging Systems Market Revenue Share (%), by Country 2024 & 2032
- Figure 46: Latin America IR and Thermal Imaging Systems Market Revenue (Million), by Solutions 2024 & 2032
- Figure 47: Latin America IR and Thermal Imaging Systems Market Revenue Share (%), by Solutions 2024 & 2032
- Figure 48: Latin America IR and Thermal Imaging Systems Market Revenue (Million), by Applications 2024 & 2032
- Figure 49: Latin America IR and Thermal Imaging Systems Market Revenue Share (%), by Applications 2024 & 2032
- Figure 50: Latin America IR and Thermal Imaging Systems Market Revenue (Million), by Form Factor 2024 & 2032
- Figure 51: Latin America IR and Thermal Imaging Systems Market Revenue Share (%), by Form Factor 2024 & 2032
- Figure 52: Latin America IR and Thermal Imaging Systems Market Revenue (Million), by Country 2024 & 2032
- Figure 53: Latin America IR and Thermal Imaging Systems Market Revenue Share (%), by Country 2024 & 2032
- Figure 54: Middle East and Africa IR and Thermal Imaging Systems Market Revenue (Million), by Solutions 2024 & 2032
- Figure 55: Middle East and Africa IR and Thermal Imaging Systems Market Revenue Share (%), by Solutions 2024 & 2032
- Figure 56: Middle East and Africa IR and Thermal Imaging Systems Market Revenue (Million), by Applications 2024 & 2032
- Figure 57: Middle East and Africa IR and Thermal Imaging Systems Market Revenue Share (%), by Applications 2024 & 2032
- Figure 58: Middle East and Africa IR and Thermal Imaging Systems Market Revenue (Million), by Form Factor 2024 & 2032
- Figure 59: Middle East and Africa IR and Thermal Imaging Systems Market Revenue Share (%), by Form Factor 2024 & 2032
- Figure 60: Middle East and Africa IR and Thermal Imaging Systems Market Revenue (Million), by Country 2024 & 2032
- Figure 61: Middle East and Africa IR and Thermal Imaging Systems Market Revenue Share (%), by Country 2024 & 2032
List of Tables
- Table 1: Global IR and Thermal Imaging Systems Market Revenue Million Forecast, by Region 2019 & 2032
- Table 2: Global IR and Thermal Imaging Systems Market Revenue Million Forecast, by Solutions 2019 & 2032
- Table 3: Global IR and Thermal Imaging Systems Market Revenue Million Forecast, by Applications 2019 & 2032
- Table 4: Global IR and Thermal Imaging Systems Market Revenue Million Forecast, by Form Factor 2019 & 2032
- Table 5: Global IR and Thermal Imaging Systems Market Revenue Million Forecast, by Region 2019 & 2032
- Table 6: Global IR and Thermal Imaging Systems Market Revenue Million Forecast, by Country 2019 & 2032
- Table 7: United States IR and Thermal Imaging Systems Market Revenue (Million) Forecast, by Application 2019 & 2032
- Table 8: Canada IR and Thermal Imaging Systems Market Revenue (Million) Forecast, by Application 2019 & 2032
- Table 9: Global IR and Thermal Imaging Systems Market Revenue Million Forecast, by Country 2019 & 2032
- Table 10: United Kingdom IR and Thermal Imaging Systems Market Revenue (Million) Forecast, by Application 2019 & 2032
- Table 11: Germany IR and Thermal Imaging Systems Market Revenue (Million) Forecast, by Application 2019 & 2032
- Table 12: France IR and Thermal Imaging Systems Market Revenue (Million) Forecast, by Application 2019 & 2032
- Table 13: Rest of Europe IR and Thermal Imaging Systems Market Revenue (Million) Forecast, by Application 2019 & 2032
- Table 14: Global IR and Thermal Imaging Systems Market Revenue Million Forecast, by Country 2019 & 2032
- Table 15: China IR and Thermal Imaging Systems Market Revenue (Million) Forecast, by Application 2019 & 2032
- Table 16: Japan IR and Thermal Imaging Systems Market Revenue (Million) Forecast, by Application 2019 & 2032
- Table 17: India IR and Thermal Imaging Systems Market Revenue (Million) Forecast, by Application 2019 & 2032
- Table 18: Rest of Asia Pacific IR and Thermal Imaging Systems Market Revenue (Million) Forecast, by Application 2019 & 2032
- Table 19: Global IR and Thermal Imaging Systems Market Revenue Million Forecast, by Country 2019 & 2032
- Table 20: Brazil IR and Thermal Imaging Systems Market Revenue (Million) Forecast, by Application 2019 & 2032
- Table 21: Mexico IR and Thermal Imaging Systems Market Revenue (Million) Forecast, by Application 2019 & 2032
- Table 22: Argentina IR and Thermal Imaging Systems Market Revenue (Million) Forecast, by Application 2019 & 2032
- Table 23: Rest of Latin America IR and Thermal Imaging Systems Market Revenue (Million) Forecast, by Application 2019 & 2032
- Table 24: Global IR and Thermal Imaging Systems Market Revenue Million Forecast, by Country 2019 & 2032
- Table 25: IR and Thermal Imaging Systems Market Revenue (Million) Forecast, by Application 2019 & 2032
- Table 26: Global IR and Thermal Imaging Systems Market Revenue Million Forecast, by Country 2019 & 2032
- Table 27: United Arab Emirates IR and Thermal Imaging Systems Market Revenue (Million) Forecast, by Application 2019 & 2032
- Table 28: South Africa IR and Thermal Imaging Systems Market Revenue (Million) Forecast, by Application 2019 & 2032
- Table 29: Rest of Middle East IR and Thermal Imaging Systems Market Revenue (Million) Forecast, by Application 2019 & 2032
- Table 30: Global IR and Thermal Imaging Systems Market Revenue Million Forecast, by Solutions 2019 & 2032
- Table 31: Global IR and Thermal Imaging Systems Market Revenue Million Forecast, by Applications 2019 & 2032
- Table 32: Global IR and Thermal Imaging Systems Market Revenue Million Forecast, by Form Factor 2019 & 2032
- Table 33: Global IR and Thermal Imaging Systems Market Revenue Million Forecast, by Country 2019 & 2032
- Table 34: United States IR and Thermal Imaging Systems Market Revenue (Million) Forecast, by Application 2019 & 2032
- Table 35: Canada IR and Thermal Imaging Systems Market Revenue (Million) Forecast, by Application 2019 & 2032
- Table 36: Global IR and Thermal Imaging Systems Market Revenue Million Forecast, by Solutions 2019 & 2032
- Table 37: Global IR and Thermal Imaging Systems Market Revenue Million Forecast, by Applications 2019 & 2032
- Table 38: Global IR and Thermal Imaging Systems Market Revenue Million Forecast, by Form Factor 2019 & 2032
- Table 39: Global IR and Thermal Imaging Systems Market Revenue Million Forecast, by Country 2019 & 2032
- Table 40: United Kingdom IR and Thermal Imaging Systems Market Revenue (Million) Forecast, by Application 2019 & 2032
- Table 41: Germany IR and Thermal Imaging Systems Market Revenue (Million) Forecast, by Application 2019 & 2032
- Table 42: France IR and Thermal Imaging Systems Market Revenue (Million) Forecast, by Application 2019 & 2032
- Table 43: Global IR and Thermal Imaging Systems Market Revenue Million Forecast, by Solutions 2019 & 2032
- Table 44: Global IR and Thermal Imaging Systems Market Revenue Million Forecast, by Applications 2019 & 2032
- Table 45: Global IR and Thermal Imaging Systems Market Revenue Million Forecast, by Form Factor 2019 & 2032
- Table 46: Global IR and Thermal Imaging Systems Market Revenue Million Forecast, by Country 2019 & 2032
- Table 47: China IR and Thermal Imaging Systems Market Revenue (Million) Forecast, by Application 2019 & 2032
- Table 48: Japan IR and Thermal Imaging Systems Market Revenue (Million) Forecast, by Application 2019 & 2032
- Table 49: India IR and Thermal Imaging Systems Market Revenue (Million) Forecast, by Application 2019 & 2032
- Table 50: Global IR and Thermal Imaging Systems Market Revenue Million Forecast, by Solutions 2019 & 2032
- Table 51: Global IR and Thermal Imaging Systems Market Revenue Million Forecast, by Applications 2019 & 2032
- Table 52: Global IR and Thermal Imaging Systems Market Revenue Million Forecast, by Form Factor 2019 & 2032
- Table 53: Global IR and Thermal Imaging Systems Market Revenue Million Forecast, by Country 2019 & 2032
- Table 54: Global IR and Thermal Imaging Systems Market Revenue Million Forecast, by Solutions 2019 & 2032
- Table 55: Global IR and Thermal Imaging Systems Market Revenue Million Forecast, by Applications 2019 & 2032
- Table 56: Global IR and Thermal Imaging Systems Market Revenue Million Forecast, by Form Factor 2019 & 2032
- Table 57: Global IR and Thermal Imaging Systems Market Revenue Million Forecast, by Country 2019 & 2032
- Table 58: Brazil IR and Thermal Imaging Systems Market Revenue (Million) Forecast, by Application 2019 & 2032
- Table 59: Mexico IR and Thermal Imaging Systems Market Revenue (Million) Forecast, by Application 2019 & 2032
- Table 60: Argentina IR and Thermal Imaging Systems Market Revenue (Million) Forecast, by Application 2019 & 2032
- Table 61: Global IR and Thermal Imaging Systems Market Revenue Million Forecast, by Solutions 2019 & 2032
- Table 62: Global IR and Thermal Imaging Systems Market Revenue Million Forecast, by Applications 2019 & 2032
- Table 63: Global IR and Thermal Imaging Systems Market Revenue Million Forecast, by Form Factor 2019 & 2032
- Table 64: Global IR and Thermal Imaging Systems Market Revenue Million Forecast, by Country 2019 & 2032
- Table 65: Saudi Arabia IR and Thermal Imaging Systems Market Revenue (Million) Forecast, by Application 2019 & 2032
- Table 66: United Arab Emirates IR and Thermal Imaging Systems Market Revenue (Million) Forecast, by Application 2019 & 2032
- Table 67: South Africa IR and Thermal Imaging Systems Market Revenue (Million) Forecast, by Application 2019 & 2032
Frequently Asked Questions
1. What is the projected Compound Annual Growth Rate (CAGR) of the IR and Thermal Imaging Systems Market?
The projected CAGR is approximately 9.84%.
2. Which companies are prominent players in the IR and Thermal Imaging Systems Market?
Key companies in the market include Thermoteknix Systems Ltd *List Not Exhaustive, Elbit Systems Ltd, Bae Systems PLC, Lockheed Martin, Raytheon, ULIS, Leonardo DRS, L-3 Communications Holdings, Flir Systems Inc, Sofradir Group.
3. What are the main segments of the IR and Thermal Imaging Systems Market?
The market segments include Solutions, Applications, Form Factor.
4. Can you provide details about the market size?
The market size is estimated to be USD XX Million as of 2022.
5. What are some drivers contributing to market growth?
; Low Cost Solutions; Increasing Usage Across Industries; Low Impact on the Environment.
6. What are the notable trends driving market growth?
Industrial Applications are Expected to Have a Major Market Share.
7. Are there any restraints impacting market growth?
; Lack of Regular Support and Services.
8. Can you provide examples of recent developments in the market?
N/A
9. What pricing options are available for accessing the report?
Pricing options include single-user, multi-user, and enterprise licenses priced at USD 4750, USD 5250, and USD 8750 respectively.
10. Is the market size provided in terms of value or volume?
The market size is provided in terms of value, measured in Million.
11. Are there any specific market keywords associated with the report?
Yes, the market keyword associated with the report is "IR and Thermal Imaging Systems Market," which aids in identifying and referencing the specific market segment covered.
12. How do I determine which pricing option suits my needs best?
The pricing options vary based on user requirements and access needs. Individual users may opt for single-user licenses, while businesses requiring broader access may choose multi-user or enterprise licenses for cost-effective access to the report.
13. Are there any additional resources or data provided in the IR and Thermal Imaging Systems Market report?
While the report offers comprehensive insights, it's advisable to review the specific contents or supplementary materials provided to ascertain if additional resources or data are available.
14. How can I stay updated on further developments or reports in the IR and Thermal Imaging Systems Market?
To stay informed about further developments, trends, and reports in the IR and Thermal Imaging Systems Market, consider subscribing to industry newsletters, following relevant companies and organizations, or regularly checking reputable industry news sources and publications.
Methodology
Step 1 - Identification of Relevant Samples Size from Population Database


Step 2 - Approaches for Defining Global Market Size (Value, Volume* & Price*)

Note*: In applicable scenarios
Step 3 - Data Sources
Primary Research
- Web Analytics
- Survey Reports
- Research Institute
- Latest Research Reports
- Opinion Leaders
Secondary Research
- Annual Reports
- White Paper
- Latest Press Release
- Industry Association
- Paid Database
- Investor Presentations

Step 4 - Data Triangulation
Involves using different sources of information in order to increase the validity of a study
These sources are likely to be stakeholders in a program - participants, other researchers, program staff, other community members, and so on.
Then we put all data in single framework & apply various statistical tools to find out the dynamic on the market.
During the analysis stage, feedback from the stakeholder groups would be compared to determine areas of agreement as well as areas of divergence
