

Key Insights
The IT equipment rental market is experiencing robust growth, driven by the increasing adoption of cloud computing, the rise of hybrid work models, and the need for businesses to maintain operational flexibility. The market's preference for short-term solutions over large capital expenditures for IT infrastructure is fueling this expansion. Organizations are increasingly choosing to rent rather than buy to manage costs, reduce obsolescence risks associated with rapid technological advancements, and easily scale resources up or down based on fluctuating demands. This is particularly evident in sectors like healthcare, finance, and education, where regulatory compliance and data security are paramount but budgets are often constrained. The market's competitive landscape is characterized by a mix of global players and regional specialists, each catering to different niche segments and geographical markets. This diversity fuels innovation and ensures accessibility to a range of equipment and services. While potential restraints include economic downturns and concerns about data security during rentals, the overall trajectory suggests a sustained period of growth driven by the continuing digital transformation of businesses worldwide.
The forecast period (2025-2033) anticipates a continuation of this upward trend. Assuming a conservative CAGR of 8% (a reasonable estimate given industry trends), the market is poised for significant expansion. Specific regional variations will likely exist, with mature markets in North America and Europe experiencing steady growth, while emerging economies in Asia-Pacific and Latin America demonstrate faster expansion rates fueled by increasing digitization and infrastructure development. The segmentation within the market (based on equipment type, rental duration, and service offerings) will continue to evolve, creating further opportunities for specialized providers and innovative solutions tailored to specific customer needs. Successful players will be those who effectively leverage technology to optimize operations, enhance customer service, and ensure robust data security practices.
IT Equipment Rental Market Report: 2019-2033
This comprehensive report provides a detailed analysis of the IT equipment rental market, encompassing market dynamics, growth trends, regional dominance, product landscapes, key players, and future outlook. The study period covers 2019-2033, with 2025 as the base and estimated year. The forecast period spans 2025-2033, and the historical period covers 2019-2024. The report caters to industry professionals, investors, and stakeholders seeking in-depth insights into this dynamic market. Market values are presented in million units.
IT Equipment Rental Market Dynamics & Structure
The IT equipment rental market is characterized by moderate concentration, with a few large players and numerous smaller regional operators. The market size in 2025 is estimated at $xx million. Technological innovation, particularly in cloud computing and virtualization, is a key driver, impacting both demand and supply-side dynamics. Regulatory frameworks concerning data privacy and security significantly influence operational practices. Competitive substitutes, like cloud-based services, exert pressure on traditional rental models. End-user demographics reveal a growing demand from SMEs and enterprises across various sectors. The historical period (2019-2024) saw xx M&A deals, indicating consolidation within the industry.
- Market Concentration: Moderately concentrated, with the top 5 players holding an estimated 35% market share in 2025.
- Technological Innovation: Cloud computing, virtualization, and edge computing are driving demand for flexible rental solutions.
- Regulatory Framework: GDPR and other data privacy regulations impact data security protocols and compliance costs.
- Competitive Substitutes: Cloud services and SaaS models pose a competitive threat to traditional rental models.
- End-User Demographics: Growing adoption among SMEs and enterprises across sectors such as finance, healthcare, and education.
- M&A Trends: xx M&A deals in 2019-2024, signaling industry consolidation and expansion strategies.
IT Equipment Rental Growth Trends & Insights
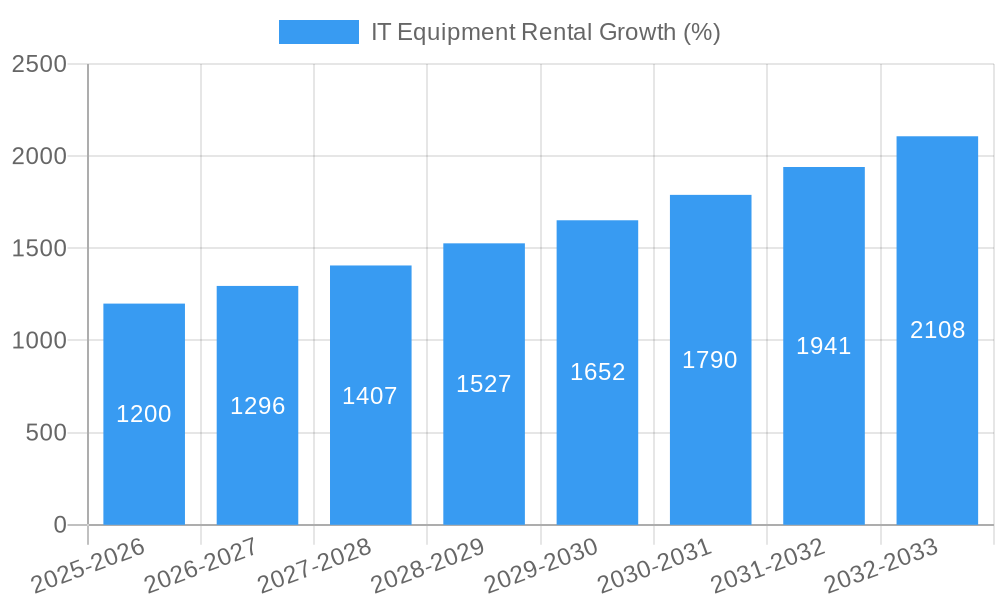
The IT equipment rental market exhibits a robust growth trajectory, driven by increasing digitalization across various sectors. The market experienced a CAGR of xx% during 2019-2024, reaching an estimated value of $xx million in 2025. This growth is fueled by factors such as the rising adoption of flexible IT infrastructure models, the need for cost optimization, and the increasing demand for specialized equipment. The market penetration rate in 2025 is projected at xx%. Technological disruptions, such as the rise of 5G and AI, are expected to further accelerate market growth in the forecast period (2025-2033). Shifting consumer behavior, favoring on-demand services and subscription models, positively influences market expansion. The projected CAGR for 2025-2033 is xx%.
Dominant Regions, Countries, or Segments in IT Equipment Rental
North America currently holds the largest market share in the IT equipment rental sector, driven by robust technological advancements and high adoption rates within various industries. This region's well-established IT infrastructure and strong economic conditions contribute significantly to its dominance. However, the Asia-Pacific region demonstrates the highest growth potential, fuelled by rapid digitalization and expanding economies, particularly in countries like China and India. The strong growth in the Asia-Pacific region is expected to propel this region to a significant market share in the coming years.
- North America: High adoption rates, robust IT infrastructure, and strong economic conditions drive market dominance.
- Asia-Pacific: High growth potential fueled by rapid digitalization, expanding economies (China, India), and increasing investment in IT infrastructure.
- Europe: Steady growth driven by increasing demand for flexible IT solutions across various sectors.
IT Equipment Rental Product Landscape
The IT equipment rental market offers a diverse range of products, encompassing servers, storage devices, networking equipment, laptops, desktops, and peripherals. Recent innovations focus on enhanced security features, improved energy efficiency, and flexible deployment options, including cloud-integrated solutions. Key performance metrics include uptime, availability, and cost-effectiveness. The unique selling propositions often revolve around customized service level agreements (SLAs), flexible contract terms, and comprehensive technical support. The integration of AI and IoT capabilities into rental equipment is becoming increasingly prominent.
Key Drivers, Barriers & Challenges in IT Equipment Rental
Key Drivers:
- Increasing demand for flexible IT infrastructure.
- Cost optimization initiatives by businesses.
- Rapid technological advancements in the IT sector.
- Growing adoption of cloud-based services and hybrid models.
Key Challenges:
- Intense competition from established players and emerging market entrants.
- Managing obsolescence of rental equipment.
- Ensuring data security and compliance with regulations.
- Supply chain disruptions impacting equipment availability and pricing. This led to a xx% increase in rental costs in 2022.
Emerging Opportunities in IT Equipment Rental
- Growing demand for specialized equipment rentals (e.g., AR/VR, AI hardware).
- Expansion into underserved markets (e.g., remote areas, developing economies).
- Development of innovative service models (e.g., equipment-as-a-service).
- Leveraging IoT and AI for predictive maintenance and optimized resource allocation.
Growth Accelerators in the IT Equipment Rental Industry
Strategic partnerships between IT equipment rental providers and technology vendors are driving growth by broadening product portfolios and expanding market reach. Technological advancements like edge computing and 5G networks create new opportunities for rental services, driving adoption among enterprises. Market expansion initiatives into new geographical regions and industry sectors are contributing to market growth, creating opportunities for revenue expansion.
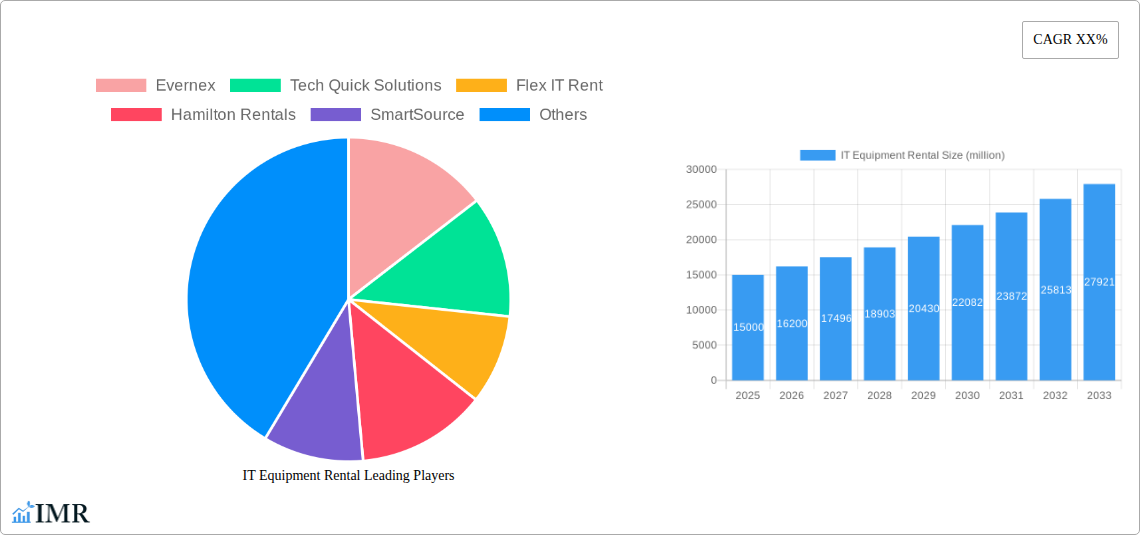
Key Players Shaping the IT Equipment Rental Market
- Evernex
- Tech Quick Solutions
- Flex IT Rent
- Hamilton Rentals
- SmartSource
- Techbuyer
- Micro Image International Corporation
- RAC IT Solutions
- Beijing Xinquan Technology Co., Ltd.
- Shenzhen Wangdu Communication Co., Ltd.
- Wuhan Langlian Technology Co., Ltd.
- Akesa IT Solutions
Notable Milestones in IT Equipment Rental Sector
- 2020: Increased demand for remote work solutions drives a surge in laptop and desktop rentals.
- 2021: Several key players invest in expanding their cloud-based rental offerings.
- 2022: Supply chain disruptions lead to increased rental prices and equipment shortages.
- 2023: Growing adoption of sustainable IT equipment rental practices.
In-Depth IT Equipment Rental Market Outlook
The IT equipment rental market is poised for continued growth, driven by the accelerating pace of digital transformation across various sectors. The increasing focus on operational efficiency, cost optimization, and the growing demand for flexible IT infrastructure will further fuel market expansion. Strategic partnerships, technological innovations, and targeted market expansion strategies will be crucial for players to capitalize on the significant opportunities that lie ahead. The market is expected to reach $xx million by 2033.
IT Equipment Rental Segmentation
-
1. Application
- 1.1. Personal Leasing
- 1.2. Business Leasing
-
2. Types
- 2.1. Servers
- 2.2. Switches
- 2.3. Laptops and Desktops
- 2.4. Printers and Scanners
- 2.5. Projectors
- 2.6. Keyboard and Mouse
- 2.7. Screens
- 2.8. Others
IT Equipment Rental Segmentation By Geography
-
1. North America
- 1.1. United States
- 1.2. Canada
- 1.3. Mexico
-
2. South America
- 2.1. Brazil
- 2.2. Argentina
- 2.3. Rest of South America
-
3. Europe
- 3.1. United Kingdom
- 3.2. Germany
- 3.3. France
- 3.4. Italy
- 3.5. Spain
- 3.6. Russia
- 3.7. Benelux
- 3.8. Nordics
- 3.9. Rest of Europe
-
4. Middle East & Africa
- 4.1. Turkey
- 4.2. Israel
- 4.3. GCC
- 4.4. North Africa
- 4.5. South Africa
- 4.6. Rest of Middle East & Africa
-
5. Asia Pacific
- 5.1. China
- 5.2. India
- 5.3. Japan
- 5.4. South Korea
- 5.5. ASEAN
- 5.6. Oceania
- 5.7. Rest of Asia Pacific

IT Equipment Rental REPORT HIGHLIGHTS
| Aspects | Details |
|---|---|
| Study Period | 2019-2033 |
| Base Year | 2024 |
| Estimated Year | 2025 |
| Forecast Period | 2025-2033 |
| Historical Period | 2019-2024 |
| Growth Rate | CAGR of XX% from 2019-2033 |
| Segmentation |
|
Table of Contents
- 1. Introduction
- 1.1. Research Scope
- 1.2. Market Segmentation
- 1.3. Research Methodology
- 1.4. Definitions and Assumptions
- 2. Executive Summary
- 2.1. Introduction
- 3. Market Dynamics
- 3.1. Introduction
- 3.2. Market Drivers
- 3.3. Market Restrains
- 3.4. Market Trends
- 4. Market Factor Analysis
- 4.1. Porters Five Forces
- 4.2. Supply/Value Chain
- 4.3. PESTEL analysis
- 4.4. Market Entropy
- 4.5. Patent/Trademark Analysis
- 5. Global IT Equipment Rental Analysis, Insights and Forecast, 2019-2031
- 5.1. Market Analysis, Insights and Forecast - by Application
- 5.1.1. Personal Leasing
- 5.1.2. Business Leasing
- 5.2. Market Analysis, Insights and Forecast - by Types
- 5.2.1. Servers
- 5.2.2. Switches
- 5.2.3. Laptops and Desktops
- 5.2.4. Printers and Scanners
- 5.2.5. Projectors
- 5.2.6. Keyboard and Mouse
- 5.2.7. Screens
- 5.2.8. Others
- 5.3. Market Analysis, Insights and Forecast - by Region
- 5.3.1. North America
- 5.3.2. South America
- 5.3.3. Europe
- 5.3.4. Middle East & Africa
- 5.3.5. Asia Pacific
- 5.1. Market Analysis, Insights and Forecast - by Application
- 6. North America IT Equipment Rental Analysis, Insights and Forecast, 2019-2031
- 6.1. Market Analysis, Insights and Forecast - by Application
- 6.1.1. Personal Leasing
- 6.1.2. Business Leasing
- 6.2. Market Analysis, Insights and Forecast - by Types
- 6.2.1. Servers
- 6.2.2. Switches
- 6.2.3. Laptops and Desktops
- 6.2.4. Printers and Scanners
- 6.2.5. Projectors
- 6.2.6. Keyboard and Mouse
- 6.2.7. Screens
- 6.2.8. Others
- 6.1. Market Analysis, Insights and Forecast - by Application
- 7. South America IT Equipment Rental Analysis, Insights and Forecast, 2019-2031
- 7.1. Market Analysis, Insights and Forecast - by Application
- 7.1.1. Personal Leasing
- 7.1.2. Business Leasing
- 7.2. Market Analysis, Insights and Forecast - by Types
- 7.2.1. Servers
- 7.2.2. Switches
- 7.2.3. Laptops and Desktops
- 7.2.4. Printers and Scanners
- 7.2.5. Projectors
- 7.2.6. Keyboard and Mouse
- 7.2.7. Screens
- 7.2.8. Others
- 7.1. Market Analysis, Insights and Forecast - by Application
- 8. Europe IT Equipment Rental Analysis, Insights and Forecast, 2019-2031
- 8.1. Market Analysis, Insights and Forecast - by Application
- 8.1.1. Personal Leasing
- 8.1.2. Business Leasing
- 8.2. Market Analysis, Insights and Forecast - by Types
- 8.2.1. Servers
- 8.2.2. Switches
- 8.2.3. Laptops and Desktops
- 8.2.4. Printers and Scanners
- 8.2.5. Projectors
- 8.2.6. Keyboard and Mouse
- 8.2.7. Screens
- 8.2.8. Others
- 8.1. Market Analysis, Insights and Forecast - by Application
- 9. Middle East & Africa IT Equipment Rental Analysis, Insights and Forecast, 2019-2031
- 9.1. Market Analysis, Insights and Forecast - by Application
- 9.1.1. Personal Leasing
- 9.1.2. Business Leasing
- 9.2. Market Analysis, Insights and Forecast - by Types
- 9.2.1. Servers
- 9.2.2. Switches
- 9.2.3. Laptops and Desktops
- 9.2.4. Printers and Scanners
- 9.2.5. Projectors
- 9.2.6. Keyboard and Mouse
- 9.2.7. Screens
- 9.2.8. Others
- 9.1. Market Analysis, Insights and Forecast - by Application
- 10. Asia Pacific IT Equipment Rental Analysis, Insights and Forecast, 2019-2031
- 10.1. Market Analysis, Insights and Forecast - by Application
- 10.1.1. Personal Leasing
- 10.1.2. Business Leasing
- 10.2. Market Analysis, Insights and Forecast - by Types
- 10.2.1. Servers
- 10.2.2. Switches
- 10.2.3. Laptops and Desktops
- 10.2.4. Printers and Scanners
- 10.2.5. Projectors
- 10.2.6. Keyboard and Mouse
- 10.2.7. Screens
- 10.2.8. Others
- 10.1. Market Analysis, Insights and Forecast - by Application
- 11. Competitive Analysis
- 11.1. Global Market Share Analysis 2024
- 11.2. Company Profiles
- 11.2.1 Evernex
- 11.2.1.1. Overview
- 11.2.1.2. Products
- 11.2.1.3. SWOT Analysis
- 11.2.1.4. Recent Developments
- 11.2.1.5. Financials (Based on Availability)
- 11.2.2 Tech Quick Solutions
- 11.2.2.1. Overview
- 11.2.2.2. Products
- 11.2.2.3. SWOT Analysis
- 11.2.2.4. Recent Developments
- 11.2.2.5. Financials (Based on Availability)
- 11.2.3 Flex IT Rent
- 11.2.3.1. Overview
- 11.2.3.2. Products
- 11.2.3.3. SWOT Analysis
- 11.2.3.4. Recent Developments
- 11.2.3.5. Financials (Based on Availability)
- 11.2.4 Hamilton Rentals
- 11.2.4.1. Overview
- 11.2.4.2. Products
- 11.2.4.3. SWOT Analysis
- 11.2.4.4. Recent Developments
- 11.2.4.5. Financials (Based on Availability)
- 11.2.5 SmartSource
- 11.2.5.1. Overview
- 11.2.5.2. Products
- 11.2.5.3. SWOT Analysis
- 11.2.5.4. Recent Developments
- 11.2.5.5. Financials (Based on Availability)
- 11.2.6 Techbuyer
- 11.2.6.1. Overview
- 11.2.6.2. Products
- 11.2.6.3. SWOT Analysis
- 11.2.6.4. Recent Developments
- 11.2.6.5. Financials (Based on Availability)
- 11.2.7 Micro Image International Corporation
- 11.2.7.1. Overview
- 11.2.7.2. Products
- 11.2.7.3. SWOT Analysis
- 11.2.7.4. Recent Developments
- 11.2.7.5. Financials (Based on Availability)
- 11.2.8 RAC IT Solutions
- 11.2.8.1. Overview
- 11.2.8.2. Products
- 11.2.8.3. SWOT Analysis
- 11.2.8.4. Recent Developments
- 11.2.8.5. Financials (Based on Availability)
- 11.2.9 Beijing Xinquan Technology Co.
- 11.2.9.1. Overview
- 11.2.9.2. Products
- 11.2.9.3. SWOT Analysis
- 11.2.9.4. Recent Developments
- 11.2.9.5. Financials (Based on Availability)
- 11.2.10 Ltd.
- 11.2.10.1. Overview
- 11.2.10.2. Products
- 11.2.10.3. SWOT Analysis
- 11.2.10.4. Recent Developments
- 11.2.10.5. Financials (Based on Availability)
- 11.2.11 Shenzhen Wangdu Communication Co.
- 11.2.11.1. Overview
- 11.2.11.2. Products
- 11.2.11.3. SWOT Analysis
- 11.2.11.4. Recent Developments
- 11.2.11.5. Financials (Based on Availability)
- 11.2.12 Ltd.
- 11.2.12.1. Overview
- 11.2.12.2. Products
- 11.2.12.3. SWOT Analysis
- 11.2.12.4. Recent Developments
- 11.2.12.5. Financials (Based on Availability)
- 11.2.13 Wuhan Langlian Technology Co.
- 11.2.13.1. Overview
- 11.2.13.2. Products
- 11.2.13.3. SWOT Analysis
- 11.2.13.4. Recent Developments
- 11.2.13.5. Financials (Based on Availability)
- 11.2.14 Ltd.
- 11.2.14.1. Overview
- 11.2.14.2. Products
- 11.2.14.3. SWOT Analysis
- 11.2.14.4. Recent Developments
- 11.2.14.5. Financials (Based on Availability)
- 11.2.15 Akesa IT Solutions
- 11.2.15.1. Overview
- 11.2.15.2. Products
- 11.2.15.3. SWOT Analysis
- 11.2.15.4. Recent Developments
- 11.2.15.5. Financials (Based on Availability)
- 11.2.1 Evernex
List of Figures
- Figure 1: Global IT Equipment Rental Revenue Breakdown (million, %) by Region 2024 & 2032
- Figure 2: North America IT Equipment Rental Revenue (million), by Application 2024 & 2032
- Figure 3: North America IT Equipment Rental Revenue Share (%), by Application 2024 & 2032
- Figure 4: North America IT Equipment Rental Revenue (million), by Types 2024 & 2032
- Figure 5: North America IT Equipment Rental Revenue Share (%), by Types 2024 & 2032
- Figure 6: North America IT Equipment Rental Revenue (million), by Country 2024 & 2032
- Figure 7: North America IT Equipment Rental Revenue Share (%), by Country 2024 & 2032
- Figure 8: South America IT Equipment Rental Revenue (million), by Application 2024 & 2032
- Figure 9: South America IT Equipment Rental Revenue Share (%), by Application 2024 & 2032
- Figure 10: South America IT Equipment Rental Revenue (million), by Types 2024 & 2032
- Figure 11: South America IT Equipment Rental Revenue Share (%), by Types 2024 & 2032
- Figure 12: South America IT Equipment Rental Revenue (million), by Country 2024 & 2032
- Figure 13: South America IT Equipment Rental Revenue Share (%), by Country 2024 & 2032
- Figure 14: Europe IT Equipment Rental Revenue (million), by Application 2024 & 2032
- Figure 15: Europe IT Equipment Rental Revenue Share (%), by Application 2024 & 2032
- Figure 16: Europe IT Equipment Rental Revenue (million), by Types 2024 & 2032
- Figure 17: Europe IT Equipment Rental Revenue Share (%), by Types 2024 & 2032
- Figure 18: Europe IT Equipment Rental Revenue (million), by Country 2024 & 2032
- Figure 19: Europe IT Equipment Rental Revenue Share (%), by Country 2024 & 2032
- Figure 20: Middle East & Africa IT Equipment Rental Revenue (million), by Application 2024 & 2032
- Figure 21: Middle East & Africa IT Equipment Rental Revenue Share (%), by Application 2024 & 2032
- Figure 22: Middle East & Africa IT Equipment Rental Revenue (million), by Types 2024 & 2032
- Figure 23: Middle East & Africa IT Equipment Rental Revenue Share (%), by Types 2024 & 2032
- Figure 24: Middle East & Africa IT Equipment Rental Revenue (million), by Country 2024 & 2032
- Figure 25: Middle East & Africa IT Equipment Rental Revenue Share (%), by Country 2024 & 2032
- Figure 26: Asia Pacific IT Equipment Rental Revenue (million), by Application 2024 & 2032
- Figure 27: Asia Pacific IT Equipment Rental Revenue Share (%), by Application 2024 & 2032
- Figure 28: Asia Pacific IT Equipment Rental Revenue (million), by Types 2024 & 2032
- Figure 29: Asia Pacific IT Equipment Rental Revenue Share (%), by Types 2024 & 2032
- Figure 30: Asia Pacific IT Equipment Rental Revenue (million), by Country 2024 & 2032
- Figure 31: Asia Pacific IT Equipment Rental Revenue Share (%), by Country 2024 & 2032
List of Tables
- Table 1: Global IT Equipment Rental Revenue million Forecast, by Region 2019 & 2032
- Table 2: Global IT Equipment Rental Revenue million Forecast, by Application 2019 & 2032
- Table 3: Global IT Equipment Rental Revenue million Forecast, by Types 2019 & 2032
- Table 4: Global IT Equipment Rental Revenue million Forecast, by Region 2019 & 2032
- Table 5: Global IT Equipment Rental Revenue million Forecast, by Application 2019 & 2032
- Table 6: Global IT Equipment Rental Revenue million Forecast, by Types 2019 & 2032
- Table 7: Global IT Equipment Rental Revenue million Forecast, by Country 2019 & 2032
- Table 8: United States IT Equipment Rental Revenue (million) Forecast, by Application 2019 & 2032
- Table 9: Canada IT Equipment Rental Revenue (million) Forecast, by Application 2019 & 2032
- Table 10: Mexico IT Equipment Rental Revenue (million) Forecast, by Application 2019 & 2032
- Table 11: Global IT Equipment Rental Revenue million Forecast, by Application 2019 & 2032
- Table 12: Global IT Equipment Rental Revenue million Forecast, by Types 2019 & 2032
- Table 13: Global IT Equipment Rental Revenue million Forecast, by Country 2019 & 2032
- Table 14: Brazil IT Equipment Rental Revenue (million) Forecast, by Application 2019 & 2032
- Table 15: Argentina IT Equipment Rental Revenue (million) Forecast, by Application 2019 & 2032
- Table 16: Rest of South America IT Equipment Rental Revenue (million) Forecast, by Application 2019 & 2032
- Table 17: Global IT Equipment Rental Revenue million Forecast, by Application 2019 & 2032
- Table 18: Global IT Equipment Rental Revenue million Forecast, by Types 2019 & 2032
- Table 19: Global IT Equipment Rental Revenue million Forecast, by Country 2019 & 2032
- Table 20: United Kingdom IT Equipment Rental Revenue (million) Forecast, by Application 2019 & 2032
- Table 21: Germany IT Equipment Rental Revenue (million) Forecast, by Application 2019 & 2032
- Table 22: France IT Equipment Rental Revenue (million) Forecast, by Application 2019 & 2032
- Table 23: Italy IT Equipment Rental Revenue (million) Forecast, by Application 2019 & 2032
- Table 24: Spain IT Equipment Rental Revenue (million) Forecast, by Application 2019 & 2032
- Table 25: Russia IT Equipment Rental Revenue (million) Forecast, by Application 2019 & 2032
- Table 26: Benelux IT Equipment Rental Revenue (million) Forecast, by Application 2019 & 2032
- Table 27: Nordics IT Equipment Rental Revenue (million) Forecast, by Application 2019 & 2032
- Table 28: Rest of Europe IT Equipment Rental Revenue (million) Forecast, by Application 2019 & 2032
- Table 29: Global IT Equipment Rental Revenue million Forecast, by Application 2019 & 2032
- Table 30: Global IT Equipment Rental Revenue million Forecast, by Types 2019 & 2032
- Table 31: Global IT Equipment Rental Revenue million Forecast, by Country 2019 & 2032
- Table 32: Turkey IT Equipment Rental Revenue (million) Forecast, by Application 2019 & 2032
- Table 33: Israel IT Equipment Rental Revenue (million) Forecast, by Application 2019 & 2032
- Table 34: GCC IT Equipment Rental Revenue (million) Forecast, by Application 2019 & 2032
- Table 35: North Africa IT Equipment Rental Revenue (million) Forecast, by Application 2019 & 2032
- Table 36: South Africa IT Equipment Rental Revenue (million) Forecast, by Application 2019 & 2032
- Table 37: Rest of Middle East & Africa IT Equipment Rental Revenue (million) Forecast, by Application 2019 & 2032
- Table 38: Global IT Equipment Rental Revenue million Forecast, by Application 2019 & 2032
- Table 39: Global IT Equipment Rental Revenue million Forecast, by Types 2019 & 2032
- Table 40: Global IT Equipment Rental Revenue million Forecast, by Country 2019 & 2032
- Table 41: China IT Equipment Rental Revenue (million) Forecast, by Application 2019 & 2032
- Table 42: India IT Equipment Rental Revenue (million) Forecast, by Application 2019 & 2032
- Table 43: Japan IT Equipment Rental Revenue (million) Forecast, by Application 2019 & 2032
- Table 44: South Korea IT Equipment Rental Revenue (million) Forecast, by Application 2019 & 2032
- Table 45: ASEAN IT Equipment Rental Revenue (million) Forecast, by Application 2019 & 2032
- Table 46: Oceania IT Equipment Rental Revenue (million) Forecast, by Application 2019 & 2032
- Table 47: Rest of Asia Pacific IT Equipment Rental Revenue (million) Forecast, by Application 2019 & 2032
Frequently Asked Questions
1. What is the projected Compound Annual Growth Rate (CAGR) of the IT Equipment Rental?
The projected CAGR is approximately XX%.
2. Which companies are prominent players in the IT Equipment Rental?
Key companies in the market include Evernex, Tech Quick Solutions, Flex IT Rent, Hamilton Rentals, SmartSource, Techbuyer, Micro Image International Corporation, RAC IT Solutions, Beijing Xinquan Technology Co., Ltd., Shenzhen Wangdu Communication Co., Ltd., Wuhan Langlian Technology Co., Ltd., Akesa IT Solutions.
3. What are the main segments of the IT Equipment Rental?
The market segments include Application, Types.
4. Can you provide details about the market size?
The market size is estimated to be USD XXX million as of 2022.
5. What are some drivers contributing to market growth?
N/A
6. What are the notable trends driving market growth?
N/A
7. Are there any restraints impacting market growth?
N/A
8. Can you provide examples of recent developments in the market?
N/A
9. What pricing options are available for accessing the report?
Pricing options include single-user, multi-user, and enterprise licenses priced at USD 2900.00, USD 4350.00, and USD 5800.00 respectively.
10. Is the market size provided in terms of value or volume?
The market size is provided in terms of value, measured in million.
11. Are there any specific market keywords associated with the report?
Yes, the market keyword associated with the report is "IT Equipment Rental," which aids in identifying and referencing the specific market segment covered.
12. How do I determine which pricing option suits my needs best?
The pricing options vary based on user requirements and access needs. Individual users may opt for single-user licenses, while businesses requiring broader access may choose multi-user or enterprise licenses for cost-effective access to the report.
13. Are there any additional resources or data provided in the IT Equipment Rental report?
While the report offers comprehensive insights, it's advisable to review the specific contents or supplementary materials provided to ascertain if additional resources or data are available.
14. How can I stay updated on further developments or reports in the IT Equipment Rental?
To stay informed about further developments, trends, and reports in the IT Equipment Rental, consider subscribing to industry newsletters, following relevant companies and organizations, or regularly checking reputable industry news sources and publications.
Methodology
Step 1 - Identification of Relevant Samples Size from Population Database


Step 2 - Approaches for Defining Global Market Size (Value, Volume* & Price*)

Note*: In applicable scenarios
Step 3 - Data Sources
Primary Research
- Web Analytics
- Survey Reports
- Research Institute
- Latest Research Reports
- Opinion Leaders
Secondary Research
- Annual Reports
- White Paper
- Latest Press Release
- Industry Association
- Paid Database
- Investor Presentations

Step 4 - Data Triangulation
Involves using different sources of information in order to increase the validity of a study
These sources are likely to be stakeholders in a program - participants, other researchers, program staff, other community members, and so on.
Then we put all data in single framework & apply various statistical tools to find out the dynamic on the market.
During the analysis stage, feedback from the stakeholder groups would be compared to determine areas of agreement as well as areas of divergence
