

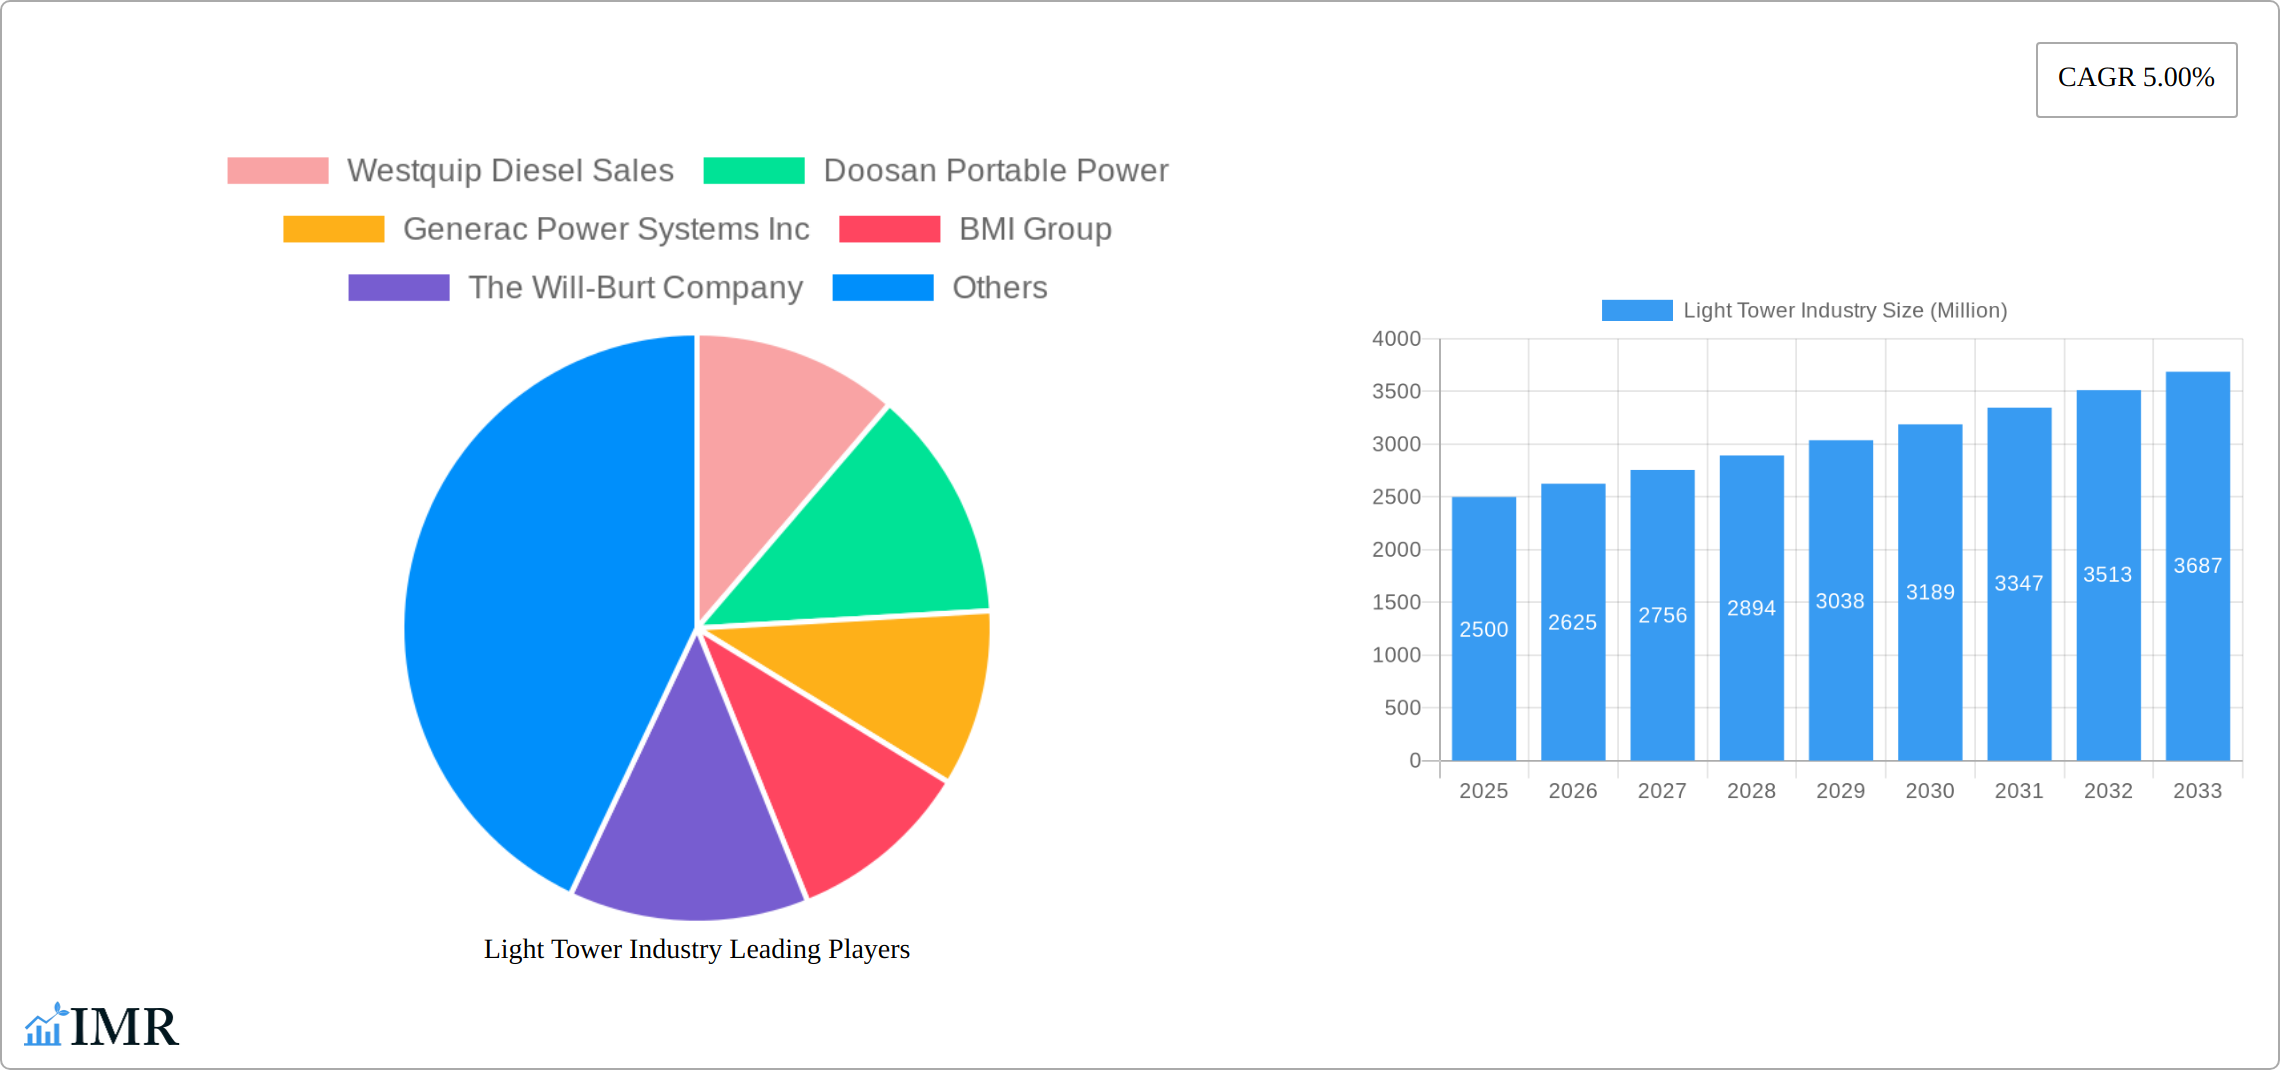
Key Insights
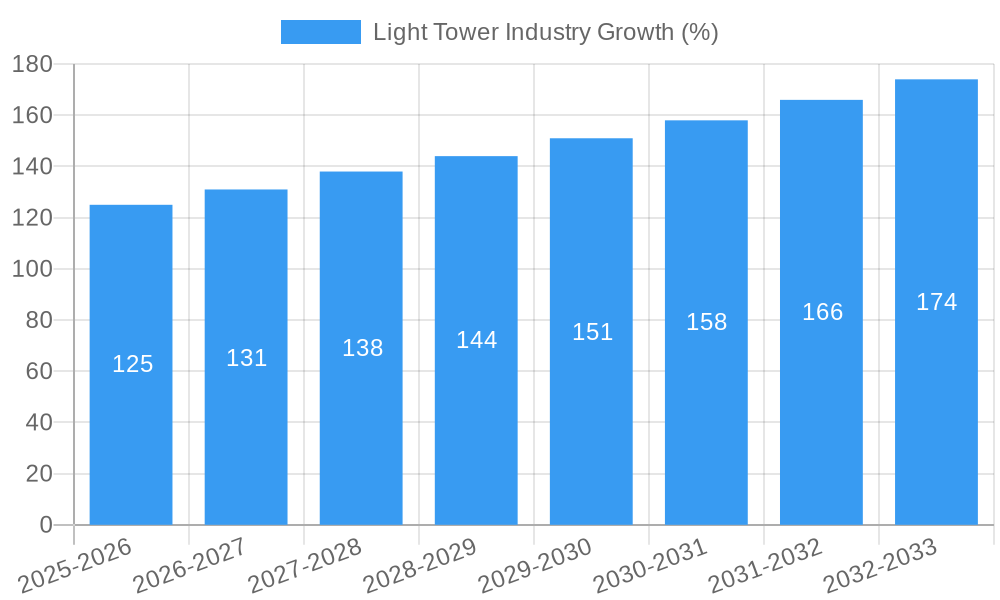
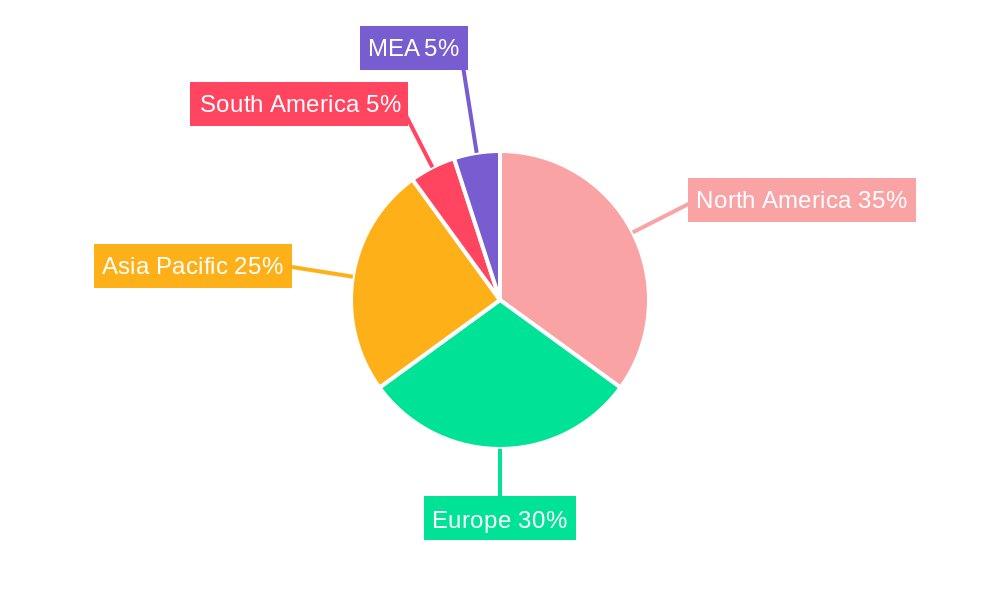
The global light tower market, valued at approximately $XX million in 2025, is projected to experience robust growth, exhibiting a compound annual growth rate (CAGR) of 5.00% from 2025 to 2033. This expansion is driven primarily by the increasing demand for efficient and portable lighting solutions across various end-user industries, including construction, oil & gas, mining, and industrial operations. The rising number of large-scale infrastructure projects globally, coupled with the stringent safety regulations mandating adequate site illumination, significantly contribute to market growth. Technological advancements, such as the introduction of energy-efficient LED light towers and the adoption of alternative power sources like solar and hydrogen fuel, are further fueling market expansion. However, the market faces certain restraints, including fluctuating fuel prices (particularly impacting diesel-powered models) and the initial high investment costs associated with advanced technologies. The market segmentation reveals a strong preference for LED light towers due to their superior energy efficiency and longer lifespan compared to metal halide alternatives. Similarly, the demand for solar-powered and other alternative-fuel light towers is increasing as companies prioritize sustainability and reduce their carbon footprint. North America and Europe currently hold significant market share, driven by strong infrastructural development and industrial activities in these regions; however, the Asia-Pacific region is expected to witness the highest growth rate over the forecast period due to rapid urbanization and industrialization.
The competitive landscape is characterized by both established players and emerging companies, each vying for market dominance through product innovation, strategic partnerships, and geographical expansion. Key players like Generac Power Systems, Atlas Copco, and Doosan Portable Power are focusing on developing technologically advanced and eco-friendly light towers to cater to the evolving needs of their customer base. The competitive dynamics are further shaped by pricing strategies, product differentiation, and after-sales services. Future market success will hinge on manufacturers' ability to effectively balance cost optimization with the incorporation of sustainable and technologically advanced features, while also responding to regional regulatory changes and infrastructural demands. This dynamic landscape presents both opportunities and challenges for industry participants, requiring agility and strategic foresight to capitalize on the growth potential.
This comprehensive report provides an in-depth analysis of the Light Tower Industry, encompassing market dynamics, growth trends, regional dominance, product landscape, key players, and future outlook. The study period covers 2019-2033, with 2025 as the base and estimated year. This report is crucial for industry professionals, investors, and anyone seeking to understand this evolving market. The parent market is the construction equipment market, with the light tower market representing a significant child market within it. Market values are presented in million units.
Light Tower Industry Market Dynamics & Structure
The light tower industry is characterized by a moderately fragmented market structure, with several key players competing for market share. Technological innovation, particularly in LED lighting and alternative power sources, is a significant driver of growth. Stringent safety regulations and environmental concerns also influence market dynamics. Competition from other lighting solutions, such as high-powered portable lamps, presents a notable challenge. The industry witnesses consistent M&A activity, driven by the need for expansion and technological advancements.
- Market Concentration: Moderately fragmented, with no single dominant player controlling a significant portion of the market. The top 5 players hold an estimated xx% market share (2024).
- Technological Innovation: LED technology is rapidly replacing metal halide, driving efficiency and cost savings. The adoption of solar and hydrogen power sources is gaining traction, contributing to sustainability initiatives.
- Regulatory Framework: Stringent safety and environmental regulations concerning emissions and light pollution are shaping product design and market entry requirements.
- Competitive Product Substitutes: High-powered portable lamps and other temporary lighting solutions present a competitive threat.
- End-User Demographics: Predominantly construction, oil & gas, mining, and industrial sectors. The demographics are shifting toward increased demand for sustainable and efficient lighting solutions.
- M&A Trends: A moderate number of M&A deals were observed during the historical period (2019-2024), primarily focused on expanding geographical reach and acquiring technological capabilities. An estimated xx M&A deals occurred in the period.
Light Tower Industry Growth Trends & Insights
The light tower industry has witnessed steady growth over the historical period (2019-2024), driven by increasing infrastructure development globally and the demand for efficient and safe lighting in various industries. The market size experienced a CAGR of xx% during this period, reaching xx million units in 2024. The adoption rate of LED light towers is accelerating, surpassing metal halide in terms of market penetration. Technological advancements continue to drive growth, with the integration of smart features and alternative power sources gaining momentum. Consumer behavior is shifting towards sustainable and energy-efficient options, impacting purchasing decisions. The forecast period (2025-2033) anticipates continued growth, albeit at a slightly reduced CAGR of xx%, driven by several macroeconomic factors and technological developments. Market penetration of solar-powered light towers is expected to increase significantly during this period.
Dominant Regions, Countries, or Segments in Light Tower Industry
North America and Europe currently dominate the light tower market, driven by robust construction activity, well-established industrial sectors, and stringent safety regulations. Within these regions, the United States and Germany respectively show significant market share. The LED light tower segment holds the largest market share among the types of light towers due to its energy efficiency and cost-effectiveness. In terms of power sources, diesel-powered light towers maintain the largest market share currently. However, the solar-powered segment is projected to witness the highest growth rate, driven by increasing environmental concerns and cost reductions in solar technology. The construction sector remains the largest end-user industry, with significant growth potential in developing economies.
- Key Drivers: Robust infrastructure development, increasing industrial activities, government initiatives promoting sustainable energy sources, and stringent safety regulations.
- Dominance Factors: Developed economies with well-established industrial bases, strong construction sectors, and supportive government policies.
Light Tower Industry Product Landscape
The light tower industry offers a range of products, from traditional metal halide light towers to advanced LED models with solar or diesel power sources. LED light towers are increasingly gaining popularity due to their energy efficiency, longer lifespan, and lower maintenance costs. Product innovation focuses on improved brightness, enhanced safety features, and the integration of smart technologies for remote monitoring and control. Unique selling propositions include increased lumen output per watt, reduced operational costs, and minimized environmental impact. Technological advancements concentrate on advanced lighting control systems, improved power management systems, and the integration of alternative power sources.
Key Drivers, Barriers & Challenges in Light Tower Industry
Key Drivers:
- Increasing infrastructure development globally.
- Growing demand for safe and efficient lighting in various industries.
- Rising adoption of LED technology, offering energy efficiency and cost savings.
- Increasing focus on sustainable and eco-friendly solutions.
Key Challenges & Restraints:
- Fluctuations in raw material prices (e.g., steel, aluminum).
- Stringent environmental regulations impacting manufacturing and operational costs.
- Intense competition among numerous established players, leading to price pressure.
- Supply chain disruptions potentially affecting production timelines and costs. The impact of supply chain disruptions has been estimated to affect xx% of production in 2024.
Emerging Opportunities in Light Tower Industry
- Expansion into untapped markets in developing economies.
- Development of smart light towers with remote monitoring and control capabilities.
- Growing demand for solar-powered and hydrogen fuel-powered light towers, driven by sustainability initiatives.
- Integration of light towers with other construction equipment and technologies.
Growth Accelerators in the Light Tower Industry
Technological advancements, particularly in LED lighting and alternative power sources, are accelerating market growth. Strategic partnerships between light tower manufacturers and energy companies are fostering innovation and market expansion. The increasing adoption of smart technologies and remote monitoring capabilities is adding value to the products and enhancing their competitiveness. The expansion into new markets, particularly in developing economies with robust infrastructure development projects, presents significant growth potential.
Key Players Shaping the Light Tower Industry Market
- Westquip Diesel Sales
- Doosan Portable Power
- Generac Power Systems Inc
- BMI Group
- The Will-Burt Company
- Xylem Inc
- Atlas Copco AB
- Youngman Richardson & Co Ltd
- Wacker Neuson Group
- Wanco Inc
- J C Bamford Excavators Ltd
- Inmesol Gensets SL
- Colorado Standby
- Larson Electronics LLC
- Terex Corporation
Notable Milestones in Light Tower Industry Sector
- February 2021: Generac Power Systems announced plans to expand its manufacturing capacity for power backup solutions, including light towers, by opening a new facility in South Carolina, USA. This expansion signals increasing market demand and a focus on enhancing production capabilities.
In-Depth Light Tower Industry Market Outlook
The light tower industry is poised for continued growth, driven by technological innovation, expanding infrastructure projects globally, and increasing focus on sustainable energy solutions. The market will witness a shift toward LED technology and the adoption of alternative power sources such as solar and hydrogen. Strategic partnerships and collaborations will play a crucial role in shaping the industry's future, with manufacturers focusing on developing smart and interconnected light towers. The increasing demand for energy-efficient and eco-friendly lighting solutions presents significant growth opportunities for key players and new entrants alike.
Light Tower Industry Segmentation
-
1. Type
- 1.1. LED Light Tower
- 1.2. Metal Halid Light Tower
-
2. Type of Power Source
- 2.1. Solar Powered
- 2.2. Diesel Powered
- 2.3. Hydrogen Fuel Powered
- 2.4. Directly Powered
-
3. End-user Industry
- 3.1. Construction
- 3.2. Oil & Gas
- 3.3. Mining
- 3.4. Industrial
- 3.5. Other End-user Industries
Light Tower Industry Segmentation By Geography
- 1. North America
- 2. Europe
- 3. Asia Pacific
- 4. Latin America
- 5. Middle East and Africa
Light Tower Industry REPORT HIGHLIGHTS
| Aspects | Details |
|---|---|
| Study Period | 2019-2033 |
| Base Year | 2024 |
| Estimated Year | 2025 |
| Forecast Period | 2025-2033 |
| Historical Period | 2019-2024 |
| Growth Rate | CAGR of 5.00% from 2019-2033 |
| Segmentation |
|
Table of Contents
- 1. Introduction
- 1.1. Research Scope
- 1.2. Market Segmentation
- 1.3. Research Methodology
- 1.4. Definitions and Assumptions
- 2. Executive Summary
- 2.1. Introduction
- 3. Market Dynamics
- 3.1. Introduction
- 3.2. Market Drivers
- 3.2.1 Investments and Rapid Growth in the Oil and Gas
- 3.2.2 Mining and Construction Sectors; Focus on Reducing Light Tower Emissions
- 3.3. Market Restrains
- 3.3.1. Environmental and Safe Use Concerns
- 3.4. Market Trends
- 3.4.1. LED Light Tower Accounts For the Largest Market Share
- 4. Market Factor Analysis
- 4.1. Porters Five Forces
- 4.2. Supply/Value Chain
- 4.3. PESTEL analysis
- 4.4. Market Entropy
- 4.5. Patent/Trademark Analysis
- 5. Global Light Tower Industry Analysis, Insights and Forecast, 2019-2031
- 5.1. Market Analysis, Insights and Forecast - by Type
- 5.1.1. LED Light Tower
- 5.1.2. Metal Halid Light Tower
- 5.2. Market Analysis, Insights and Forecast - by Type of Power Source
- 5.2.1. Solar Powered
- 5.2.2. Diesel Powered
- 5.2.3. Hydrogen Fuel Powered
- 5.2.4. Directly Powered
- 5.3. Market Analysis, Insights and Forecast - by End-user Industry
- 5.3.1. Construction
- 5.3.2. Oil & Gas
- 5.3.3. Mining
- 5.3.4. Industrial
- 5.3.5. Other End-user Industries
- 5.4. Market Analysis, Insights and Forecast - by Region
- 5.4.1. North America
- 5.4.2. Europe
- 5.4.3. Asia Pacific
- 5.4.4. Latin America
- 5.4.5. Middle East and Africa
- 5.1. Market Analysis, Insights and Forecast - by Type
- 6. North America Light Tower Industry Analysis, Insights and Forecast, 2019-2031
- 6.1. Market Analysis, Insights and Forecast - by Type
- 6.1.1. LED Light Tower
- 6.1.2. Metal Halid Light Tower
- 6.2. Market Analysis, Insights and Forecast - by Type of Power Source
- 6.2.1. Solar Powered
- 6.2.2. Diesel Powered
- 6.2.3. Hydrogen Fuel Powered
- 6.2.4. Directly Powered
- 6.3. Market Analysis, Insights and Forecast - by End-user Industry
- 6.3.1. Construction
- 6.3.2. Oil & Gas
- 6.3.3. Mining
- 6.3.4. Industrial
- 6.3.5. Other End-user Industries
- 6.1. Market Analysis, Insights and Forecast - by Type
- 7. Europe Light Tower Industry Analysis, Insights and Forecast, 2019-2031
- 7.1. Market Analysis, Insights and Forecast - by Type
- 7.1.1. LED Light Tower
- 7.1.2. Metal Halid Light Tower
- 7.2. Market Analysis, Insights and Forecast - by Type of Power Source
- 7.2.1. Solar Powered
- 7.2.2. Diesel Powered
- 7.2.3. Hydrogen Fuel Powered
- 7.2.4. Directly Powered
- 7.3. Market Analysis, Insights and Forecast - by End-user Industry
- 7.3.1. Construction
- 7.3.2. Oil & Gas
- 7.3.3. Mining
- 7.3.4. Industrial
- 7.3.5. Other End-user Industries
- 7.1. Market Analysis, Insights and Forecast - by Type
- 8. Asia Pacific Light Tower Industry Analysis, Insights and Forecast, 2019-2031
- 8.1. Market Analysis, Insights and Forecast - by Type
- 8.1.1. LED Light Tower
- 8.1.2. Metal Halid Light Tower
- 8.2. Market Analysis, Insights and Forecast - by Type of Power Source
- 8.2.1. Solar Powered
- 8.2.2. Diesel Powered
- 8.2.3. Hydrogen Fuel Powered
- 8.2.4. Directly Powered
- 8.3. Market Analysis, Insights and Forecast - by End-user Industry
- 8.3.1. Construction
- 8.3.2. Oil & Gas
- 8.3.3. Mining
- 8.3.4. Industrial
- 8.3.5. Other End-user Industries
- 8.1. Market Analysis, Insights and Forecast - by Type
- 9. Latin America Light Tower Industry Analysis, Insights and Forecast, 2019-2031
- 9.1. Market Analysis, Insights and Forecast - by Type
- 9.1.1. LED Light Tower
- 9.1.2. Metal Halid Light Tower
- 9.2. Market Analysis, Insights and Forecast - by Type of Power Source
- 9.2.1. Solar Powered
- 9.2.2. Diesel Powered
- 9.2.3. Hydrogen Fuel Powered
- 9.2.4. Directly Powered
- 9.3. Market Analysis, Insights and Forecast - by End-user Industry
- 9.3.1. Construction
- 9.3.2. Oil & Gas
- 9.3.3. Mining
- 9.3.4. Industrial
- 9.3.5. Other End-user Industries
- 9.1. Market Analysis, Insights and Forecast - by Type
- 10. Middle East and Africa Light Tower Industry Analysis, Insights and Forecast, 2019-2031
- 10.1. Market Analysis, Insights and Forecast - by Type
- 10.1.1. LED Light Tower
- 10.1.2. Metal Halid Light Tower
- 10.2. Market Analysis, Insights and Forecast - by Type of Power Source
- 10.2.1. Solar Powered
- 10.2.2. Diesel Powered
- 10.2.3. Hydrogen Fuel Powered
- 10.2.4. Directly Powered
- 10.3. Market Analysis, Insights and Forecast - by End-user Industry
- 10.3.1. Construction
- 10.3.2. Oil & Gas
- 10.3.3. Mining
- 10.3.4. Industrial
- 10.3.5. Other End-user Industries
- 10.1. Market Analysis, Insights and Forecast - by Type
- 11. North America Light Tower Industry Analysis, Insights and Forecast, 2019-2031
- 11.1. Market Analysis, Insights and Forecast - By Country/Sub-region
- 11.1.1 United States
- 11.1.2 Canada
- 11.1.3 Mexico
- 12. Europe Light Tower Industry Analysis, Insights and Forecast, 2019-2031
- 12.1. Market Analysis, Insights and Forecast - By Country/Sub-region
- 12.1.1 Germany
- 12.1.2 United Kingdom
- 12.1.3 France
- 12.1.4 Spain
- 12.1.5 Italy
- 12.1.6 Spain
- 12.1.7 Belgium
- 12.1.8 Netherland
- 12.1.9 Nordics
- 12.1.10 Rest of Europe
- 13. Asia Pacific Light Tower Industry Analysis, Insights and Forecast, 2019-2031
- 13.1. Market Analysis, Insights and Forecast - By Country/Sub-region
- 13.1.1 China
- 13.1.2 Japan
- 13.1.3 India
- 13.1.4 South Korea
- 13.1.5 Southeast Asia
- 13.1.6 Australia
- 13.1.7 Indonesia
- 13.1.8 Phillipes
- 13.1.9 Singapore
- 13.1.10 Thailandc
- 13.1.11 Rest of Asia Pacific
- 14. South America Light Tower Industry Analysis, Insights and Forecast, 2019-2031
- 14.1. Market Analysis, Insights and Forecast - By Country/Sub-region
- 14.1.1 Brazil
- 14.1.2 Argentina
- 14.1.3 Peru
- 14.1.4 Chile
- 14.1.5 Colombia
- 14.1.6 Ecuador
- 14.1.7 Venezuela
- 14.1.8 Rest of South America
- 15. North America Light Tower Industry Analysis, Insights and Forecast, 2019-2031
- 15.1. Market Analysis, Insights and Forecast - By Country/Sub-region
- 15.1.1 United States
- 15.1.2 Canada
- 15.1.3 Mexico
- 16. MEA Light Tower Industry Analysis, Insights and Forecast, 2019-2031
- 16.1. Market Analysis, Insights and Forecast - By Country/Sub-region
- 16.1.1 United Arab Emirates
- 16.1.2 Saudi Arabia
- 16.1.3 South Africa
- 16.1.4 Rest of Middle East and Africa
- 17. Competitive Analysis
- 17.1. Global Market Share Analysis 2024
- 17.2. Company Profiles
- 17.2.1 Westquip Diesel Sales
- 17.2.1.1. Overview
- 17.2.1.2. Products
- 17.2.1.3. SWOT Analysis
- 17.2.1.4. Recent Developments
- 17.2.1.5. Financials (Based on Availability)
- 17.2.2 Doosan Portable Power
- 17.2.2.1. Overview
- 17.2.2.2. Products
- 17.2.2.3. SWOT Analysis
- 17.2.2.4. Recent Developments
- 17.2.2.5. Financials (Based on Availability)
- 17.2.3 Generac Power Systems Inc
- 17.2.3.1. Overview
- 17.2.3.2. Products
- 17.2.3.3. SWOT Analysis
- 17.2.3.4. Recent Developments
- 17.2.3.5. Financials (Based on Availability)
- 17.2.4 BMI Group
- 17.2.4.1. Overview
- 17.2.4.2. Products
- 17.2.4.3. SWOT Analysis
- 17.2.4.4. Recent Developments
- 17.2.4.5. Financials (Based on Availability)
- 17.2.5 The Will-Burt Company
- 17.2.5.1. Overview
- 17.2.5.2. Products
- 17.2.5.3. SWOT Analysis
- 17.2.5.4. Recent Developments
- 17.2.5.5. Financials (Based on Availability)
- 17.2.6 Xylem Inc
- 17.2.6.1. Overview
- 17.2.6.2. Products
- 17.2.6.3. SWOT Analysis
- 17.2.6.4. Recent Developments
- 17.2.6.5. Financials (Based on Availability)
- 17.2.7 Atlas Copco AB
- 17.2.7.1. Overview
- 17.2.7.2. Products
- 17.2.7.3. SWOT Analysis
- 17.2.7.4. Recent Developments
- 17.2.7.5. Financials (Based on Availability)
- 17.2.8 Youngman Richardson & Co Ltd
- 17.2.8.1. Overview
- 17.2.8.2. Products
- 17.2.8.3. SWOT Analysis
- 17.2.8.4. Recent Developments
- 17.2.8.5. Financials (Based on Availability)
- 17.2.9 Wacker Neuson Group
- 17.2.9.1. Overview
- 17.2.9.2. Products
- 17.2.9.3. SWOT Analysis
- 17.2.9.4. Recent Developments
- 17.2.9.5. Financials (Based on Availability)
- 17.2.10 Wanco Inc
- 17.2.10.1. Overview
- 17.2.10.2. Products
- 17.2.10.3. SWOT Analysis
- 17.2.10.4. Recent Developments
- 17.2.10.5. Financials (Based on Availability)
- 17.2.11 J C Bamford Excavators Ltd
- 17.2.11.1. Overview
- 17.2.11.2. Products
- 17.2.11.3. SWOT Analysis
- 17.2.11.4. Recent Developments
- 17.2.11.5. Financials (Based on Availability)
- 17.2.12 Inmesol Gensets SL
- 17.2.12.1. Overview
- 17.2.12.2. Products
- 17.2.12.3. SWOT Analysis
- 17.2.12.4. Recent Developments
- 17.2.12.5. Financials (Based on Availability)
- 17.2.13 Colorado Standby
- 17.2.13.1. Overview
- 17.2.13.2. Products
- 17.2.13.3. SWOT Analysis
- 17.2.13.4. Recent Developments
- 17.2.13.5. Financials (Based on Availability)
- 17.2.14 Larson Electronics LLC
- 17.2.14.1. Overview
- 17.2.14.2. Products
- 17.2.14.3. SWOT Analysis
- 17.2.14.4. Recent Developments
- 17.2.14.5. Financials (Based on Availability)
- 17.2.15 Terex Corporation
- 17.2.15.1. Overview
- 17.2.15.2. Products
- 17.2.15.3. SWOT Analysis
- 17.2.15.4. Recent Developments
- 17.2.15.5. Financials (Based on Availability)
- 17.2.1 Westquip Diesel Sales
List of Figures
- Figure 1: Global Light Tower Industry Revenue Breakdown (Million, %) by Region 2024 & 2032
- Figure 2: Global Light Tower Industry Volume Breakdown (K Unit, %) by Region 2024 & 2032
- Figure 3: North America Light Tower Industry Revenue (Million), by Country 2024 & 2032
- Figure 4: North America Light Tower Industry Volume (K Unit), by Country 2024 & 2032
- Figure 5: North America Light Tower Industry Revenue Share (%), by Country 2024 & 2032
- Figure 6: North America Light Tower Industry Volume Share (%), by Country 2024 & 2032
- Figure 7: Europe Light Tower Industry Revenue (Million), by Country 2024 & 2032
- Figure 8: Europe Light Tower Industry Volume (K Unit), by Country 2024 & 2032
- Figure 9: Europe Light Tower Industry Revenue Share (%), by Country 2024 & 2032
- Figure 10: Europe Light Tower Industry Volume Share (%), by Country 2024 & 2032
- Figure 11: Asia Pacific Light Tower Industry Revenue (Million), by Country 2024 & 2032
- Figure 12: Asia Pacific Light Tower Industry Volume (K Unit), by Country 2024 & 2032
- Figure 13: Asia Pacific Light Tower Industry Revenue Share (%), by Country 2024 & 2032
- Figure 14: Asia Pacific Light Tower Industry Volume Share (%), by Country 2024 & 2032
- Figure 15: South America Light Tower Industry Revenue (Million), by Country 2024 & 2032
- Figure 16: South America Light Tower Industry Volume (K Unit), by Country 2024 & 2032
- Figure 17: South America Light Tower Industry Revenue Share (%), by Country 2024 & 2032
- Figure 18: South America Light Tower Industry Volume Share (%), by Country 2024 & 2032
- Figure 19: North America Light Tower Industry Revenue (Million), by Country 2024 & 2032
- Figure 20: North America Light Tower Industry Volume (K Unit), by Country 2024 & 2032
- Figure 21: North America Light Tower Industry Revenue Share (%), by Country 2024 & 2032
- Figure 22: North America Light Tower Industry Volume Share (%), by Country 2024 & 2032
- Figure 23: MEA Light Tower Industry Revenue (Million), by Country 2024 & 2032
- Figure 24: MEA Light Tower Industry Volume (K Unit), by Country 2024 & 2032
- Figure 25: MEA Light Tower Industry Revenue Share (%), by Country 2024 & 2032
- Figure 26: MEA Light Tower Industry Volume Share (%), by Country 2024 & 2032
- Figure 27: North America Light Tower Industry Revenue (Million), by Type 2024 & 2032
- Figure 28: North America Light Tower Industry Volume (K Unit), by Type 2024 & 2032
- Figure 29: North America Light Tower Industry Revenue Share (%), by Type 2024 & 2032
- Figure 30: North America Light Tower Industry Volume Share (%), by Type 2024 & 2032
- Figure 31: North America Light Tower Industry Revenue (Million), by Type of Power Source 2024 & 2032
- Figure 32: North America Light Tower Industry Volume (K Unit), by Type of Power Source 2024 & 2032
- Figure 33: North America Light Tower Industry Revenue Share (%), by Type of Power Source 2024 & 2032
- Figure 34: North America Light Tower Industry Volume Share (%), by Type of Power Source 2024 & 2032
- Figure 35: North America Light Tower Industry Revenue (Million), by End-user Industry 2024 & 2032
- Figure 36: North America Light Tower Industry Volume (K Unit), by End-user Industry 2024 & 2032
- Figure 37: North America Light Tower Industry Revenue Share (%), by End-user Industry 2024 & 2032
- Figure 38: North America Light Tower Industry Volume Share (%), by End-user Industry 2024 & 2032
- Figure 39: North America Light Tower Industry Revenue (Million), by Country 2024 & 2032
- Figure 40: North America Light Tower Industry Volume (K Unit), by Country 2024 & 2032
- Figure 41: North America Light Tower Industry Revenue Share (%), by Country 2024 & 2032
- Figure 42: North America Light Tower Industry Volume Share (%), by Country 2024 & 2032
- Figure 43: Europe Light Tower Industry Revenue (Million), by Type 2024 & 2032
- Figure 44: Europe Light Tower Industry Volume (K Unit), by Type 2024 & 2032
- Figure 45: Europe Light Tower Industry Revenue Share (%), by Type 2024 & 2032
- Figure 46: Europe Light Tower Industry Volume Share (%), by Type 2024 & 2032
- Figure 47: Europe Light Tower Industry Revenue (Million), by Type of Power Source 2024 & 2032
- Figure 48: Europe Light Tower Industry Volume (K Unit), by Type of Power Source 2024 & 2032
- Figure 49: Europe Light Tower Industry Revenue Share (%), by Type of Power Source 2024 & 2032
- Figure 50: Europe Light Tower Industry Volume Share (%), by Type of Power Source 2024 & 2032
- Figure 51: Europe Light Tower Industry Revenue (Million), by End-user Industry 2024 & 2032
- Figure 52: Europe Light Tower Industry Volume (K Unit), by End-user Industry 2024 & 2032
- Figure 53: Europe Light Tower Industry Revenue Share (%), by End-user Industry 2024 & 2032
- Figure 54: Europe Light Tower Industry Volume Share (%), by End-user Industry 2024 & 2032
- Figure 55: Europe Light Tower Industry Revenue (Million), by Country 2024 & 2032
- Figure 56: Europe Light Tower Industry Volume (K Unit), by Country 2024 & 2032
- Figure 57: Europe Light Tower Industry Revenue Share (%), by Country 2024 & 2032
- Figure 58: Europe Light Tower Industry Volume Share (%), by Country 2024 & 2032
- Figure 59: Asia Pacific Light Tower Industry Revenue (Million), by Type 2024 & 2032
- Figure 60: Asia Pacific Light Tower Industry Volume (K Unit), by Type 2024 & 2032
- Figure 61: Asia Pacific Light Tower Industry Revenue Share (%), by Type 2024 & 2032
- Figure 62: Asia Pacific Light Tower Industry Volume Share (%), by Type 2024 & 2032
- Figure 63: Asia Pacific Light Tower Industry Revenue (Million), by Type of Power Source 2024 & 2032
- Figure 64: Asia Pacific Light Tower Industry Volume (K Unit), by Type of Power Source 2024 & 2032
- Figure 65: Asia Pacific Light Tower Industry Revenue Share (%), by Type of Power Source 2024 & 2032
- Figure 66: Asia Pacific Light Tower Industry Volume Share (%), by Type of Power Source 2024 & 2032
- Figure 67: Asia Pacific Light Tower Industry Revenue (Million), by End-user Industry 2024 & 2032
- Figure 68: Asia Pacific Light Tower Industry Volume (K Unit), by End-user Industry 2024 & 2032
- Figure 69: Asia Pacific Light Tower Industry Revenue Share (%), by End-user Industry 2024 & 2032
- Figure 70: Asia Pacific Light Tower Industry Volume Share (%), by End-user Industry 2024 & 2032
- Figure 71: Asia Pacific Light Tower Industry Revenue (Million), by Country 2024 & 2032
- Figure 72: Asia Pacific Light Tower Industry Volume (K Unit), by Country 2024 & 2032
- Figure 73: Asia Pacific Light Tower Industry Revenue Share (%), by Country 2024 & 2032
- Figure 74: Asia Pacific Light Tower Industry Volume Share (%), by Country 2024 & 2032
- Figure 75: Latin America Light Tower Industry Revenue (Million), by Type 2024 & 2032
- Figure 76: Latin America Light Tower Industry Volume (K Unit), by Type 2024 & 2032
- Figure 77: Latin America Light Tower Industry Revenue Share (%), by Type 2024 & 2032
- Figure 78: Latin America Light Tower Industry Volume Share (%), by Type 2024 & 2032
- Figure 79: Latin America Light Tower Industry Revenue (Million), by Type of Power Source 2024 & 2032
- Figure 80: Latin America Light Tower Industry Volume (K Unit), by Type of Power Source 2024 & 2032
- Figure 81: Latin America Light Tower Industry Revenue Share (%), by Type of Power Source 2024 & 2032
- Figure 82: Latin America Light Tower Industry Volume Share (%), by Type of Power Source 2024 & 2032
- Figure 83: Latin America Light Tower Industry Revenue (Million), by End-user Industry 2024 & 2032
- Figure 84: Latin America Light Tower Industry Volume (K Unit), by End-user Industry 2024 & 2032
- Figure 85: Latin America Light Tower Industry Revenue Share (%), by End-user Industry 2024 & 2032
- Figure 86: Latin America Light Tower Industry Volume Share (%), by End-user Industry 2024 & 2032
- Figure 87: Latin America Light Tower Industry Revenue (Million), by Country 2024 & 2032
- Figure 88: Latin America Light Tower Industry Volume (K Unit), by Country 2024 & 2032
- Figure 89: Latin America Light Tower Industry Revenue Share (%), by Country 2024 & 2032
- Figure 90: Latin America Light Tower Industry Volume Share (%), by Country 2024 & 2032
- Figure 91: Middle East and Africa Light Tower Industry Revenue (Million), by Type 2024 & 2032
- Figure 92: Middle East and Africa Light Tower Industry Volume (K Unit), by Type 2024 & 2032
- Figure 93: Middle East and Africa Light Tower Industry Revenue Share (%), by Type 2024 & 2032
- Figure 94: Middle East and Africa Light Tower Industry Volume Share (%), by Type 2024 & 2032
- Figure 95: Middle East and Africa Light Tower Industry Revenue (Million), by Type of Power Source 2024 & 2032
- Figure 96: Middle East and Africa Light Tower Industry Volume (K Unit), by Type of Power Source 2024 & 2032
- Figure 97: Middle East and Africa Light Tower Industry Revenue Share (%), by Type of Power Source 2024 & 2032
- Figure 98: Middle East and Africa Light Tower Industry Volume Share (%), by Type of Power Source 2024 & 2032
- Figure 99: Middle East and Africa Light Tower Industry Revenue (Million), by End-user Industry 2024 & 2032
- Figure 100: Middle East and Africa Light Tower Industry Volume (K Unit), by End-user Industry 2024 & 2032
- Figure 101: Middle East and Africa Light Tower Industry Revenue Share (%), by End-user Industry 2024 & 2032
- Figure 102: Middle East and Africa Light Tower Industry Volume Share (%), by End-user Industry 2024 & 2032
- Figure 103: Middle East and Africa Light Tower Industry Revenue (Million), by Country 2024 & 2032
- Figure 104: Middle East and Africa Light Tower Industry Volume (K Unit), by Country 2024 & 2032
- Figure 105: Middle East and Africa Light Tower Industry Revenue Share (%), by Country 2024 & 2032
- Figure 106: Middle East and Africa Light Tower Industry Volume Share (%), by Country 2024 & 2032
List of Tables
- Table 1: Global Light Tower Industry Revenue Million Forecast, by Region 2019 & 2032
- Table 2: Global Light Tower Industry Volume K Unit Forecast, by Region 2019 & 2032
- Table 3: Global Light Tower Industry Revenue Million Forecast, by Type 2019 & 2032
- Table 4: Global Light Tower Industry Volume K Unit Forecast, by Type 2019 & 2032
- Table 5: Global Light Tower Industry Revenue Million Forecast, by Type of Power Source 2019 & 2032
- Table 6: Global Light Tower Industry Volume K Unit Forecast, by Type of Power Source 2019 & 2032
- Table 7: Global Light Tower Industry Revenue Million Forecast, by End-user Industry 2019 & 2032
- Table 8: Global Light Tower Industry Volume K Unit Forecast, by End-user Industry 2019 & 2032
- Table 9: Global Light Tower Industry Revenue Million Forecast, by Region 2019 & 2032
- Table 10: Global Light Tower Industry Volume K Unit Forecast, by Region 2019 & 2032
- Table 11: Global Light Tower Industry Revenue Million Forecast, by Country 2019 & 2032
- Table 12: Global Light Tower Industry Volume K Unit Forecast, by Country 2019 & 2032
- Table 13: United States Light Tower Industry Revenue (Million) Forecast, by Application 2019 & 2032
- Table 14: United States Light Tower Industry Volume (K Unit) Forecast, by Application 2019 & 2032
- Table 15: Canada Light Tower Industry Revenue (Million) Forecast, by Application 2019 & 2032
- Table 16: Canada Light Tower Industry Volume (K Unit) Forecast, by Application 2019 & 2032
- Table 17: Mexico Light Tower Industry Revenue (Million) Forecast, by Application 2019 & 2032
- Table 18: Mexico Light Tower Industry Volume (K Unit) Forecast, by Application 2019 & 2032
- Table 19: Global Light Tower Industry Revenue Million Forecast, by Country 2019 & 2032
- Table 20: Global Light Tower Industry Volume K Unit Forecast, by Country 2019 & 2032
- Table 21: Germany Light Tower Industry Revenue (Million) Forecast, by Application 2019 & 2032
- Table 22: Germany Light Tower Industry Volume (K Unit) Forecast, by Application 2019 & 2032
- Table 23: United Kingdom Light Tower Industry Revenue (Million) Forecast, by Application 2019 & 2032
- Table 24: United Kingdom Light Tower Industry Volume (K Unit) Forecast, by Application 2019 & 2032
- Table 25: France Light Tower Industry Revenue (Million) Forecast, by Application 2019 & 2032
- Table 26: France Light Tower Industry Volume (K Unit) Forecast, by Application 2019 & 2032
- Table 27: Spain Light Tower Industry Revenue (Million) Forecast, by Application 2019 & 2032
- Table 28: Spain Light Tower Industry Volume (K Unit) Forecast, by Application 2019 & 2032
- Table 29: Italy Light Tower Industry Revenue (Million) Forecast, by Application 2019 & 2032
- Table 30: Italy Light Tower Industry Volume (K Unit) Forecast, by Application 2019 & 2032
- Table 31: Spain Light Tower Industry Revenue (Million) Forecast, by Application 2019 & 2032
- Table 32: Spain Light Tower Industry Volume (K Unit) Forecast, by Application 2019 & 2032
- Table 33: Belgium Light Tower Industry Revenue (Million) Forecast, by Application 2019 & 2032
- Table 34: Belgium Light Tower Industry Volume (K Unit) Forecast, by Application 2019 & 2032
- Table 35: Netherland Light Tower Industry Revenue (Million) Forecast, by Application 2019 & 2032
- Table 36: Netherland Light Tower Industry Volume (K Unit) Forecast, by Application 2019 & 2032
- Table 37: Nordics Light Tower Industry Revenue (Million) Forecast, by Application 2019 & 2032
- Table 38: Nordics Light Tower Industry Volume (K Unit) Forecast, by Application 2019 & 2032
- Table 39: Rest of Europe Light Tower Industry Revenue (Million) Forecast, by Application 2019 & 2032
- Table 40: Rest of Europe Light Tower Industry Volume (K Unit) Forecast, by Application 2019 & 2032
- Table 41: Global Light Tower Industry Revenue Million Forecast, by Country 2019 & 2032
- Table 42: Global Light Tower Industry Volume K Unit Forecast, by Country 2019 & 2032
- Table 43: China Light Tower Industry Revenue (Million) Forecast, by Application 2019 & 2032
- Table 44: China Light Tower Industry Volume (K Unit) Forecast, by Application 2019 & 2032
- Table 45: Japan Light Tower Industry Revenue (Million) Forecast, by Application 2019 & 2032
- Table 46: Japan Light Tower Industry Volume (K Unit) Forecast, by Application 2019 & 2032
- Table 47: India Light Tower Industry Revenue (Million) Forecast, by Application 2019 & 2032
- Table 48: India Light Tower Industry Volume (K Unit) Forecast, by Application 2019 & 2032
- Table 49: South Korea Light Tower Industry Revenue (Million) Forecast, by Application 2019 & 2032
- Table 50: South Korea Light Tower Industry Volume (K Unit) Forecast, by Application 2019 & 2032
- Table 51: Southeast Asia Light Tower Industry Revenue (Million) Forecast, by Application 2019 & 2032
- Table 52: Southeast Asia Light Tower Industry Volume (K Unit) Forecast, by Application 2019 & 2032
- Table 53: Australia Light Tower Industry Revenue (Million) Forecast, by Application 2019 & 2032
- Table 54: Australia Light Tower Industry Volume (K Unit) Forecast, by Application 2019 & 2032
- Table 55: Indonesia Light Tower Industry Revenue (Million) Forecast, by Application 2019 & 2032
- Table 56: Indonesia Light Tower Industry Volume (K Unit) Forecast, by Application 2019 & 2032
- Table 57: Phillipes Light Tower Industry Revenue (Million) Forecast, by Application 2019 & 2032
- Table 58: Phillipes Light Tower Industry Volume (K Unit) Forecast, by Application 2019 & 2032
- Table 59: Singapore Light Tower Industry Revenue (Million) Forecast, by Application 2019 & 2032
- Table 60: Singapore Light Tower Industry Volume (K Unit) Forecast, by Application 2019 & 2032
- Table 61: Thailandc Light Tower Industry Revenue (Million) Forecast, by Application 2019 & 2032
- Table 62: Thailandc Light Tower Industry Volume (K Unit) Forecast, by Application 2019 & 2032
- Table 63: Rest of Asia Pacific Light Tower Industry Revenue (Million) Forecast, by Application 2019 & 2032
- Table 64: Rest of Asia Pacific Light Tower Industry Volume (K Unit) Forecast, by Application 2019 & 2032
- Table 65: Global Light Tower Industry Revenue Million Forecast, by Country 2019 & 2032
- Table 66: Global Light Tower Industry Volume K Unit Forecast, by Country 2019 & 2032
- Table 67: Brazil Light Tower Industry Revenue (Million) Forecast, by Application 2019 & 2032
- Table 68: Brazil Light Tower Industry Volume (K Unit) Forecast, by Application 2019 & 2032
- Table 69: Argentina Light Tower Industry Revenue (Million) Forecast, by Application 2019 & 2032
- Table 70: Argentina Light Tower Industry Volume (K Unit) Forecast, by Application 2019 & 2032
- Table 71: Peru Light Tower Industry Revenue (Million) Forecast, by Application 2019 & 2032
- Table 72: Peru Light Tower Industry Volume (K Unit) Forecast, by Application 2019 & 2032
- Table 73: Chile Light Tower Industry Revenue (Million) Forecast, by Application 2019 & 2032
- Table 74: Chile Light Tower Industry Volume (K Unit) Forecast, by Application 2019 & 2032
- Table 75: Colombia Light Tower Industry Revenue (Million) Forecast, by Application 2019 & 2032
- Table 76: Colombia Light Tower Industry Volume (K Unit) Forecast, by Application 2019 & 2032
- Table 77: Ecuador Light Tower Industry Revenue (Million) Forecast, by Application 2019 & 2032
- Table 78: Ecuador Light Tower Industry Volume (K Unit) Forecast, by Application 2019 & 2032
- Table 79: Venezuela Light Tower Industry Revenue (Million) Forecast, by Application 2019 & 2032
- Table 80: Venezuela Light Tower Industry Volume (K Unit) Forecast, by Application 2019 & 2032
- Table 81: Rest of South America Light Tower Industry Revenue (Million) Forecast, by Application 2019 & 2032
- Table 82: Rest of South America Light Tower Industry Volume (K Unit) Forecast, by Application 2019 & 2032
- Table 83: Global Light Tower Industry Revenue Million Forecast, by Country 2019 & 2032
- Table 84: Global Light Tower Industry Volume K Unit Forecast, by Country 2019 & 2032
- Table 85: United States Light Tower Industry Revenue (Million) Forecast, by Application 2019 & 2032
- Table 86: United States Light Tower Industry Volume (K Unit) Forecast, by Application 2019 & 2032
- Table 87: Canada Light Tower Industry Revenue (Million) Forecast, by Application 2019 & 2032
- Table 88: Canada Light Tower Industry Volume (K Unit) Forecast, by Application 2019 & 2032
- Table 89: Mexico Light Tower Industry Revenue (Million) Forecast, by Application 2019 & 2032
- Table 90: Mexico Light Tower Industry Volume (K Unit) Forecast, by Application 2019 & 2032
- Table 91: Global Light Tower Industry Revenue Million Forecast, by Country 2019 & 2032
- Table 92: Global Light Tower Industry Volume K Unit Forecast, by Country 2019 & 2032
- Table 93: United Arab Emirates Light Tower Industry Revenue (Million) Forecast, by Application 2019 & 2032
- Table 94: United Arab Emirates Light Tower Industry Volume (K Unit) Forecast, by Application 2019 & 2032
- Table 95: Saudi Arabia Light Tower Industry Revenue (Million) Forecast, by Application 2019 & 2032
- Table 96: Saudi Arabia Light Tower Industry Volume (K Unit) Forecast, by Application 2019 & 2032
- Table 97: South Africa Light Tower Industry Revenue (Million) Forecast, by Application 2019 & 2032
- Table 98: South Africa Light Tower Industry Volume (K Unit) Forecast, by Application 2019 & 2032
- Table 99: Rest of Middle East and Africa Light Tower Industry Revenue (Million) Forecast, by Application 2019 & 2032
- Table 100: Rest of Middle East and Africa Light Tower Industry Volume (K Unit) Forecast, by Application 2019 & 2032
- Table 101: Global Light Tower Industry Revenue Million Forecast, by Type 2019 & 2032
- Table 102: Global Light Tower Industry Volume K Unit Forecast, by Type 2019 & 2032
- Table 103: Global Light Tower Industry Revenue Million Forecast, by Type of Power Source 2019 & 2032
- Table 104: Global Light Tower Industry Volume K Unit Forecast, by Type of Power Source 2019 & 2032
- Table 105: Global Light Tower Industry Revenue Million Forecast, by End-user Industry 2019 & 2032
- Table 106: Global Light Tower Industry Volume K Unit Forecast, by End-user Industry 2019 & 2032
- Table 107: Global Light Tower Industry Revenue Million Forecast, by Country 2019 & 2032
- Table 108: Global Light Tower Industry Volume K Unit Forecast, by Country 2019 & 2032
- Table 109: Global Light Tower Industry Revenue Million Forecast, by Type 2019 & 2032
- Table 110: Global Light Tower Industry Volume K Unit Forecast, by Type 2019 & 2032
- Table 111: Global Light Tower Industry Revenue Million Forecast, by Type of Power Source 2019 & 2032
- Table 112: Global Light Tower Industry Volume K Unit Forecast, by Type of Power Source 2019 & 2032
- Table 113: Global Light Tower Industry Revenue Million Forecast, by End-user Industry 2019 & 2032
- Table 114: Global Light Tower Industry Volume K Unit Forecast, by End-user Industry 2019 & 2032
- Table 115: Global Light Tower Industry Revenue Million Forecast, by Country 2019 & 2032
- Table 116: Global Light Tower Industry Volume K Unit Forecast, by Country 2019 & 2032
- Table 117: Global Light Tower Industry Revenue Million Forecast, by Type 2019 & 2032
- Table 118: Global Light Tower Industry Volume K Unit Forecast, by Type 2019 & 2032
- Table 119: Global Light Tower Industry Revenue Million Forecast, by Type of Power Source 2019 & 2032
- Table 120: Global Light Tower Industry Volume K Unit Forecast, by Type of Power Source 2019 & 2032
- Table 121: Global Light Tower Industry Revenue Million Forecast, by End-user Industry 2019 & 2032
- Table 122: Global Light Tower Industry Volume K Unit Forecast, by End-user Industry 2019 & 2032
- Table 123: Global Light Tower Industry Revenue Million Forecast, by Country 2019 & 2032
- Table 124: Global Light Tower Industry Volume K Unit Forecast, by Country 2019 & 2032
- Table 125: Global Light Tower Industry Revenue Million Forecast, by Type 2019 & 2032
- Table 126: Global Light Tower Industry Volume K Unit Forecast, by Type 2019 & 2032
- Table 127: Global Light Tower Industry Revenue Million Forecast, by Type of Power Source 2019 & 2032
- Table 128: Global Light Tower Industry Volume K Unit Forecast, by Type of Power Source 2019 & 2032
- Table 129: Global Light Tower Industry Revenue Million Forecast, by End-user Industry 2019 & 2032
- Table 130: Global Light Tower Industry Volume K Unit Forecast, by End-user Industry 2019 & 2032
- Table 131: Global Light Tower Industry Revenue Million Forecast, by Country 2019 & 2032
- Table 132: Global Light Tower Industry Volume K Unit Forecast, by Country 2019 & 2032
- Table 133: Global Light Tower Industry Revenue Million Forecast, by Type 2019 & 2032
- Table 134: Global Light Tower Industry Volume K Unit Forecast, by Type 2019 & 2032
- Table 135: Global Light Tower Industry Revenue Million Forecast, by Type of Power Source 2019 & 2032
- Table 136: Global Light Tower Industry Volume K Unit Forecast, by Type of Power Source 2019 & 2032
- Table 137: Global Light Tower Industry Revenue Million Forecast, by End-user Industry 2019 & 2032
- Table 138: Global Light Tower Industry Volume K Unit Forecast, by End-user Industry 2019 & 2032
- Table 139: Global Light Tower Industry Revenue Million Forecast, by Country 2019 & 2032
- Table 140: Global Light Tower Industry Volume K Unit Forecast, by Country 2019 & 2032
Frequently Asked Questions
1. What is the projected Compound Annual Growth Rate (CAGR) of the Light Tower Industry?
The projected CAGR is approximately 5.00%.
2. Which companies are prominent players in the Light Tower Industry?
Key companies in the market include Westquip Diesel Sales, Doosan Portable Power, Generac Power Systems Inc, BMI Group, The Will-Burt Company, Xylem Inc, Atlas Copco AB, Youngman Richardson & Co Ltd, Wacker Neuson Group, Wanco Inc, J C Bamford Excavators Ltd, Inmesol Gensets SL, Colorado Standby, Larson Electronics LLC, Terex Corporation.
3. What are the main segments of the Light Tower Industry?
The market segments include Type, Type of Power Source, End-user Industry.
4. Can you provide details about the market size?
The market size is estimated to be USD XX Million as of 2022.
5. What are some drivers contributing to market growth?
Investments and Rapid Growth in the Oil and Gas. Mining and Construction Sectors; Focus on Reducing Light Tower Emissions.
6. What are the notable trends driving market growth?
LED Light Tower Accounts For the Largest Market Share.
7. Are there any restraints impacting market growth?
Environmental and Safe Use Concerns.
8. Can you provide examples of recent developments in the market?
February 2021 - Generac Power Systems announced its plans to increase its manufacturing capacity and respond to increasing demand for its power backup solutions and other energy technologies by opening new manufacturing, assembly, and distribution operation in South Carolina, USA.
9. What pricing options are available for accessing the report?
Pricing options include single-user, multi-user, and enterprise licenses priced at USD 4750, USD 5250, and USD 8750 respectively.
10. Is the market size provided in terms of value or volume?
The market size is provided in terms of value, measured in Million and volume, measured in K Unit.
11. Are there any specific market keywords associated with the report?
Yes, the market keyword associated with the report is "Light Tower Industry," which aids in identifying and referencing the specific market segment covered.
12. How do I determine which pricing option suits my needs best?
The pricing options vary based on user requirements and access needs. Individual users may opt for single-user licenses, while businesses requiring broader access may choose multi-user or enterprise licenses for cost-effective access to the report.
13. Are there any additional resources or data provided in the Light Tower Industry report?
While the report offers comprehensive insights, it's advisable to review the specific contents or supplementary materials provided to ascertain if additional resources or data are available.
14. How can I stay updated on further developments or reports in the Light Tower Industry?
To stay informed about further developments, trends, and reports in the Light Tower Industry, consider subscribing to industry newsletters, following relevant companies and organizations, or regularly checking reputable industry news sources and publications.
Methodology
Step 1 - Identification of Relevant Samples Size from Population Database


Step 2 - Approaches for Defining Global Market Size (Value, Volume* & Price*)

Note*: In applicable scenarios
Step 3 - Data Sources
Primary Research
- Web Analytics
- Survey Reports
- Research Institute
- Latest Research Reports
- Opinion Leaders
Secondary Research
- Annual Reports
- White Paper
- Latest Press Release
- Industry Association
- Paid Database
- Investor Presentations

Step 4 - Data Triangulation
Involves using different sources of information in order to increase the validity of a study
These sources are likely to be stakeholders in a program - participants, other researchers, program staff, other community members, and so on.
Then we put all data in single framework & apply various statistical tools to find out the dynamic on the market.
During the analysis stage, feedback from the stakeholder groups would be compared to determine areas of agreement as well as areas of divergence
