

Key Insights
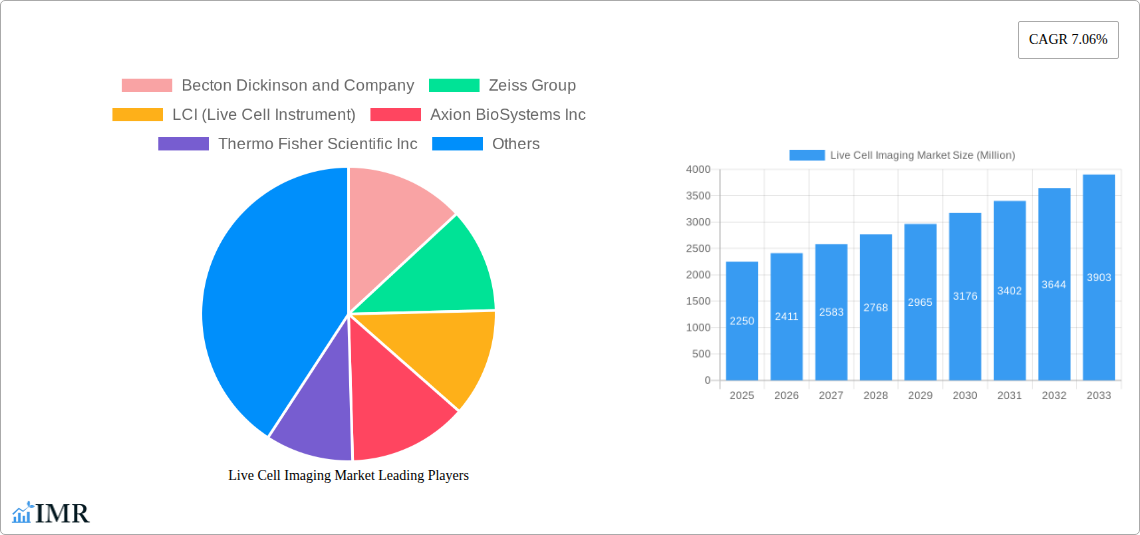
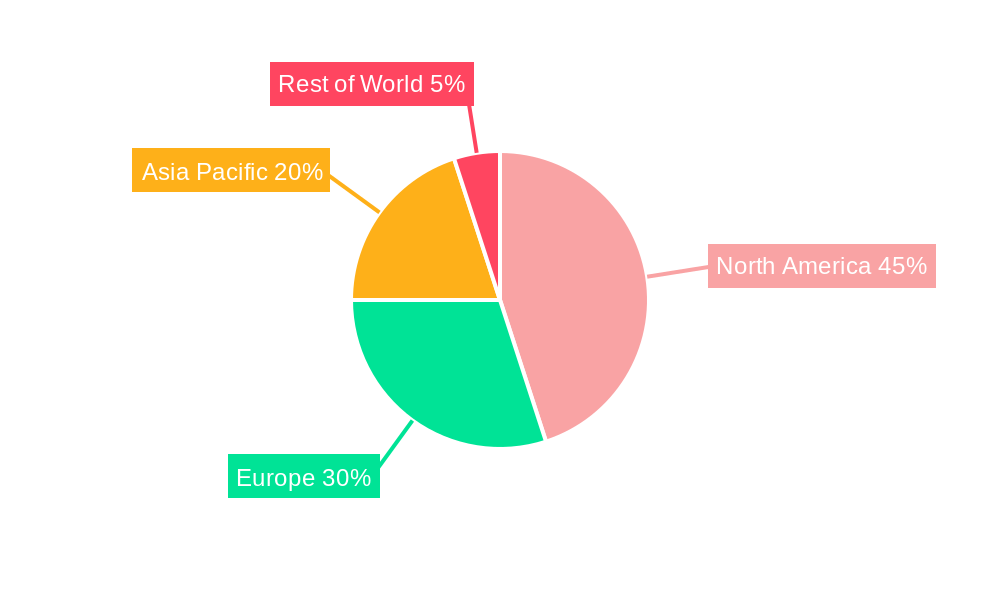
The live cell imaging market, valued at $2.25 billion in 2025, is projected to experience robust growth, driven by a Compound Annual Growth Rate (CAGR) of 7.06% from 2025 to 2033. This expansion is fueled by several key factors. Advancements in imaging technologies, such as super-resolution microscopy and automated image analysis, are enabling researchers to gain deeper insights into cellular processes with unprecedented detail. The increasing prevalence of chronic diseases, such as cancer and cardiovascular diseases, is driving demand for more effective drug discovery and development, significantly boosting the need for live cell imaging techniques. Furthermore, the rising adoption of personalized medicine necessitates detailed understanding of individual cellular responses, further fueling market growth. The market is segmented by capturing devices (consumables and other consumables), software and services, application (cell biology, developmental biology, stem cell biology, drug discovery, and other applications), and product (equipment). North America currently holds a significant market share due to the presence of major research institutions and pharmaceutical companies. However, the Asia-Pacific region is poised for rapid growth, driven by increasing investments in research infrastructure and a burgeoning life sciences sector.
The competitive landscape is characterized by established players like Becton Dickinson, Zeiss, Thermo Fisher Scientific, and Danaher (Leica Microsystems), alongside innovative smaller companies like Axion BioSystems and LCI. These companies are engaged in intense competition, focusing on developing advanced technologies, expanding product portfolios, and strategic partnerships to maintain a strong market presence. While the market exhibits strong growth potential, challenges remain, including the high cost of equipment and sophisticated software, and the need for skilled personnel to operate and analyze the complex data generated. Nevertheless, continuous technological innovation and increasing research funding are expected to mitigate these restraints, ensuring sustained growth of the live cell imaging market in the coming years. The market is also seeing increased adoption of cloud-based image analysis platforms, promoting collaboration and data sharing within research communities.
Live Cell Imaging Market: A Comprehensive Report (2019-2033)
This in-depth report provides a comprehensive analysis of the Live Cell Imaging market, encompassing market dynamics, growth trends, regional segmentation, product landscape, key players, and future outlook. The study period covers 2019-2033, with 2025 as the base year and a forecast period extending to 2033. The report segments the market by Image Capturing Devices (Consumables, Other Consumables), Software and Services, Application (Cell Biology, Developmental Biology, Stem Cell Biology, Drug Discovery, Other Applications), and Product (Equipment). The market size is valued in millions of units.
Live Cell Imaging Market Dynamics & Structure
The Live Cell Imaging market is characterized by moderate concentration, with several key players holding significant market share, but also a considerable number of smaller, specialized companies. Technological innovation, particularly in areas like AI-powered image analysis and label-free imaging, is a key driver. Regulatory frameworks related to medical device approvals and data privacy influence market dynamics. Competition from substitute technologies (e.g., traditional histological methods) exists, but is gradually being superseded by the advantages offered by live cell imaging. The market exhibits a considerable demand from academic research institutions, pharmaceutical companies, and biotechnology firms. M&A activity remains moderate, with xx deals recorded in the historical period (2019-2024), resulting in a xx% market share shift among top players.
- Market Concentration: Moderately concentrated, with top 5 players holding approximately xx% of market share in 2024.
- Technological Innovation: Rapid advancements in AI, automation, and label-free imaging are driving market growth.
- Regulatory Landscape: Stringent regulatory requirements (e.g., FDA approvals) impact product development and market entry.
- Competitive Landscape: Intense competition among established players and emerging innovative companies.
- M&A Activity: Moderate M&A activity, resulting in consolidation and market share shifts.
Live Cell Imaging Market Growth Trends & Insights
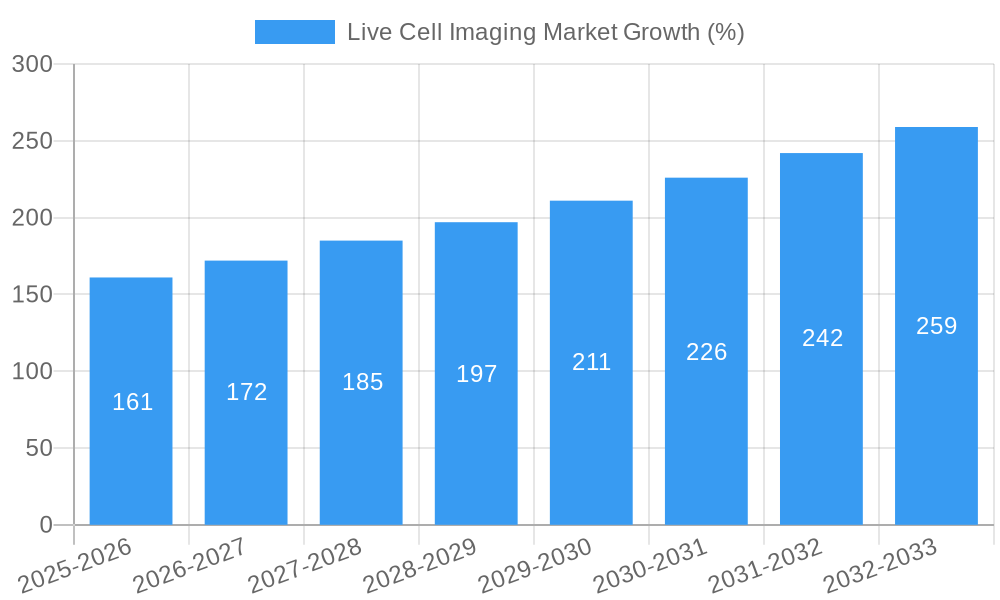
The Live Cell Imaging market is experiencing robust growth, driven by the increasing adoption of advanced imaging techniques in various research and drug discovery applications. The market size expanded from xx Million in 2019 to xx Million in 2024, exhibiting a CAGR of xx% during the historical period. This growth is fueled by factors such as increasing R&D investments in the life sciences, rising prevalence of chronic diseases, and the growing need for advanced drug discovery tools. Technological advancements, such as the integration of AI and automation, are further accelerating market growth. The adoption rate of live cell imaging technologies is steadily increasing across various research settings. The market penetration is estimated to be at xx% in 2024, projected to reach xx% by 2033. The market is expected to reach xx Million by 2033, exhibiting a CAGR of xx% during the forecast period.
Dominant Regions, Countries, or Segments in Live Cell Imaging Market
North America currently dominates the Live Cell Imaging market, driven by substantial R&D investments, a large pharmaceutical and biotechnology industry, and strong regulatory support. Europe follows as a significant market, while Asia-Pacific is experiencing the fastest growth, fueled by increasing healthcare spending and a growing life science research sector. Within the application segments, drug discovery currently holds the largest market share, followed by cell biology and stem cell biology. The equipment segment represents the largest share, but the software and services segment is showing higher growth due to increasing demand for advanced data analysis and interpretation tools.
- North America: High R&D spending, strong presence of major players, and advanced healthcare infrastructure contribute to market dominance.
- Europe: Significant market share, driven by research activities and pharmaceutical industry.
- Asia-Pacific: Fastest-growing region, fueled by increasing healthcare expenditure and expanding research infrastructure.
- Drug Discovery: Largest application segment, driven by high demand for efficient drug development tools.
- Equipment: Largest product segment, but the Software and Services segment is exhibiting higher growth.
Live Cell Imaging Market Product Landscape
The Live Cell Imaging market offers a wide array of products, including advanced microscopes, image analysis software, and specialized consumables. Recent innovations focus on high-resolution imaging, automation, and AI-powered analysis, leading to improved efficiency and data quality. Key features include improved sensitivity, reduced phototoxicity, and the ability to perform high-throughput screening. The ability to perform label-free imaging is emerging as a significant advantage, eliminating the need for potentially disruptive labeling techniques.
Key Drivers, Barriers & Challenges in Live Cell Imaging Market
Key Drivers:
- Increasing R&D investment in life sciences.
- Growing demand for high-throughput screening in drug discovery.
- Technological advancements like AI and automation.
- Rising prevalence of chronic diseases.
Key Challenges & Restraints:
- High cost of equipment and software.
- Complexity of image analysis.
- Stringent regulatory requirements.
- Skilled personnel required for operation and data analysis. The complexity of the systems leads to a barrier of entry for smaller labs without specialized personnel. This accounts for a xx% decrease in smaller lab utilization of these technologies per year.
Emerging Opportunities in Live Cell Imaging Market
- Expansion into emerging markets with growing healthcare investment.
- Development of more affordable and user-friendly systems for smaller research facilities.
- Integration with other advanced technologies, such as omics and CRISPR-Cas9.
- Application expansion in new fields like personalized medicine.
Growth Accelerators in the Live Cell Imaging Market Industry
Technological advancements in areas like AI-driven image analysis, super-resolution microscopy, and label-free imaging are key catalysts. Strategic partnerships between equipment manufacturers and software developers are streamlining workflows and improving data analysis capabilities. Continued market expansion into emerging economies with growing research investment and healthcare spending is also a significant driver of long-term growth.
Key Players Shaping the Live Cell Imaging Market Market
- Becton Dickinson and Company
- Zeiss Group
- LCI (Live Cell Instrument)
- Axion BioSystems Inc
- Thermo Fisher Scientific Inc
- Danaher (Leica Microsystems)
- Agilent Technologies Inc
- Sartorius AG
- Nikon Corporation Inc
- Olympus Corporation (EVIDENT)
- Merck KGaA (Sigma- Aldrich Corporation)
- PerkinElmer Inc
Notable Milestones in Live Cell Imaging Market Sector
- June 2023: Nanolive launched the 3D Cell Explorer 96focus, a label-free live cell imaging platform using AI-powered analysis. This significantly reduces costs and simplifies workflows.
- February 2023: Nikon Corporation launched the NSPARC detector for AX systems, enabling high-resolution live tissue imaging with minimal phototoxicity. This advancement improves the quality and efficiency of research.
In-Depth Live Cell Imaging Market Market Outlook
The Live Cell Imaging market is poised for continued robust growth, driven by ongoing technological innovation, expanding applications in various research areas, and increasing global healthcare expenditure. Strategic investments in research and development, coupled with the growing adoption of advanced imaging techniques, will propel market expansion. Opportunities exist in developing more accessible and user-friendly systems for broader adoption across research facilities. The market will continue to witness innovation in areas like label-free imaging, AI integration, and advanced data analysis tools which create a strong and positive outlook for the long term.
Live Cell Imaging Market Segmentation
-
1. Product
-
1.1. Equipment
- 1.1.1. Standalone Systems
- 1.1.2. Microscopes
- 1.1.3. Cell Analyzers
- 1.1.4. Image Capturing Devices
-
1.2. Consumables
- 1.2.1. Reagents and Kits
- 1.2.2. Other Consumables
- 1.3. Software and Services
-
1.1. Equipment
-
2. Application
- 2.1. Cell Biology
- 2.2. Developmental Biology
- 2.3. Stem Cell Biology
- 2.4. Drug Discovery
- 2.5. Other Applications
Live Cell Imaging Market Segmentation By Geography
-
1. North America
- 1.1. United States
- 1.2. Canada
- 1.3. Mexico
-
2. Europe
- 2.1. Germany
- 2.2. United Kingdom
- 2.3. France
- 2.4. Italy
- 2.5. Spain
- 2.6. Rest of Europe
-
3. Asia Pacific
- 3.1. China
- 3.2. Japan
- 3.3. India
- 3.4. Australia
- 3.5. South Korea
- 3.6. Rest of Asia Pacific
-
4. Middle East and Africa
- 4.1. GCC
- 4.2. South Africa
- 4.3. Rest of Middle East and Africa
-
5. South America
- 5.1. Brazil
- 5.2. Argentina
- 5.3. Rest of South America
Live Cell Imaging Market REPORT HIGHLIGHTS
| Aspects | Details |
|---|---|
| Study Period | 2019-2033 |
| Base Year | 2024 |
| Estimated Year | 2025 |
| Forecast Period | 2025-2033 |
| Historical Period | 2019-2024 |
| Growth Rate | CAGR of 7.06% from 2019-2033 |
| Segmentation |
|
Table of Contents
- 1. Introduction
- 1.1. Research Scope
- 1.2. Market Segmentation
- 1.3. Research Methodology
- 1.4. Definitions and Assumptions
- 2. Executive Summary
- 2.1. Introduction
- 3. Market Dynamics
- 3.1. Introduction
- 3.2. Market Drivers
- 3.2.1. Adoption of High-content Screening Techniques in Drug Discovery; Rising Prevalence of Chronic Disease Demanding Higher and Quicker Diagnostic Facilities; Government Funding for Cell-based Research
- 3.3. Market Restrains
- 3.3.1. High Cost of High-content Screening Systems; Shortage of Skilled Professionals
- 3.4. Market Trends
- 3.4.1. Standalone Systems Segment is Expected to Hold a Significant Market Share Over the Forecast Period
- 4. Market Factor Analysis
- 4.1. Porters Five Forces
- 4.2. Supply/Value Chain
- 4.3. PESTEL analysis
- 4.4. Market Entropy
- 4.5. Patent/Trademark Analysis
- 5. Global Live Cell Imaging Market Analysis, Insights and Forecast, 2019-2031
- 5.1. Market Analysis, Insights and Forecast - by Product
- 5.1.1. Equipment
- 5.1.1.1. Standalone Systems
- 5.1.1.2. Microscopes
- 5.1.1.3. Cell Analyzers
- 5.1.1.4. Image Capturing Devices
- 5.1.2. Consumables
- 5.1.2.1. Reagents and Kits
- 5.1.2.2. Other Consumables
- 5.1.3. Software and Services
- 5.1.1. Equipment
- 5.2. Market Analysis, Insights and Forecast - by Application
- 5.2.1. Cell Biology
- 5.2.2. Developmental Biology
- 5.2.3. Stem Cell Biology
- 5.2.4. Drug Discovery
- 5.2.5. Other Applications
- 5.3. Market Analysis, Insights and Forecast - by Region
- 5.3.1. North America
- 5.3.2. Europe
- 5.3.3. Asia Pacific
- 5.3.4. Middle East and Africa
- 5.3.5. South America
- 5.1. Market Analysis, Insights and Forecast - by Product
- 6. North America Live Cell Imaging Market Analysis, Insights and Forecast, 2019-2031
- 6.1. Market Analysis, Insights and Forecast - by Product
- 6.1.1. Equipment
- 6.1.1.1. Standalone Systems
- 6.1.1.2. Microscopes
- 6.1.1.3. Cell Analyzers
- 6.1.1.4. Image Capturing Devices
- 6.1.2. Consumables
- 6.1.2.1. Reagents and Kits
- 6.1.2.2. Other Consumables
- 6.1.3. Software and Services
- 6.1.1. Equipment
- 6.2. Market Analysis, Insights and Forecast - by Application
- 6.2.1. Cell Biology
- 6.2.2. Developmental Biology
- 6.2.3. Stem Cell Biology
- 6.2.4. Drug Discovery
- 6.2.5. Other Applications
- 6.1. Market Analysis, Insights and Forecast - by Product
- 7. Europe Live Cell Imaging Market Analysis, Insights and Forecast, 2019-2031
- 7.1. Market Analysis, Insights and Forecast - by Product
- 7.1.1. Equipment
- 7.1.1.1. Standalone Systems
- 7.1.1.2. Microscopes
- 7.1.1.3. Cell Analyzers
- 7.1.1.4. Image Capturing Devices
- 7.1.2. Consumables
- 7.1.2.1. Reagents and Kits
- 7.1.2.2. Other Consumables
- 7.1.3. Software and Services
- 7.1.1. Equipment
- 7.2. Market Analysis, Insights and Forecast - by Application
- 7.2.1. Cell Biology
- 7.2.2. Developmental Biology
- 7.2.3. Stem Cell Biology
- 7.2.4. Drug Discovery
- 7.2.5. Other Applications
- 7.1. Market Analysis, Insights and Forecast - by Product
- 8. Asia Pacific Live Cell Imaging Market Analysis, Insights and Forecast, 2019-2031
- 8.1. Market Analysis, Insights and Forecast - by Product
- 8.1.1. Equipment
- 8.1.1.1. Standalone Systems
- 8.1.1.2. Microscopes
- 8.1.1.3. Cell Analyzers
- 8.1.1.4. Image Capturing Devices
- 8.1.2. Consumables
- 8.1.2.1. Reagents and Kits
- 8.1.2.2. Other Consumables
- 8.1.3. Software and Services
- 8.1.1. Equipment
- 8.2. Market Analysis, Insights and Forecast - by Application
- 8.2.1. Cell Biology
- 8.2.2. Developmental Biology
- 8.2.3. Stem Cell Biology
- 8.2.4. Drug Discovery
- 8.2.5. Other Applications
- 8.1. Market Analysis, Insights and Forecast - by Product
- 9. Middle East and Africa Live Cell Imaging Market Analysis, Insights and Forecast, 2019-2031
- 9.1. Market Analysis, Insights and Forecast - by Product
- 9.1.1. Equipment
- 9.1.1.1. Standalone Systems
- 9.1.1.2. Microscopes
- 9.1.1.3. Cell Analyzers
- 9.1.1.4. Image Capturing Devices
- 9.1.2. Consumables
- 9.1.2.1. Reagents and Kits
- 9.1.2.2. Other Consumables
- 9.1.3. Software and Services
- 9.1.1. Equipment
- 9.2. Market Analysis, Insights and Forecast - by Application
- 9.2.1. Cell Biology
- 9.2.2. Developmental Biology
- 9.2.3. Stem Cell Biology
- 9.2.4. Drug Discovery
- 9.2.5. Other Applications
- 9.1. Market Analysis, Insights and Forecast - by Product
- 10. South America Live Cell Imaging Market Analysis, Insights and Forecast, 2019-2031
- 10.1. Market Analysis, Insights and Forecast - by Product
- 10.1.1. Equipment
- 10.1.1.1. Standalone Systems
- 10.1.1.2. Microscopes
- 10.1.1.3. Cell Analyzers
- 10.1.1.4. Image Capturing Devices
- 10.1.2. Consumables
- 10.1.2.1. Reagents and Kits
- 10.1.2.2. Other Consumables
- 10.1.3. Software and Services
- 10.1.1. Equipment
- 10.2. Market Analysis, Insights and Forecast - by Application
- 10.2.1. Cell Biology
- 10.2.2. Developmental Biology
- 10.2.3. Stem Cell Biology
- 10.2.4. Drug Discovery
- 10.2.5. Other Applications
- 10.1. Market Analysis, Insights and Forecast - by Product
- 11. North America Live Cell Imaging Market Analysis, Insights and Forecast, 2019-2031
- 11.1. Market Analysis, Insights and Forecast - By Country/Sub-region
- 11.1.1 United States
- 11.1.2 Canada
- 11.1.3 Mexico
- 12. Europe Live Cell Imaging Market Analysis, Insights and Forecast, 2019-2031
- 12.1. Market Analysis, Insights and Forecast - By Country/Sub-region
- 12.1.1 Germany
- 12.1.2 United Kingdom
- 12.1.3 France
- 12.1.4 Italy
- 12.1.5 Spain
- 12.1.6 Rest of Europe
- 13. Asia Pacific Live Cell Imaging Market Analysis, Insights and Forecast, 2019-2031
- 13.1. Market Analysis, Insights and Forecast - By Country/Sub-region
- 13.1.1 China
- 13.1.2 Japan
- 13.1.3 India
- 13.1.4 Australia
- 13.1.5 South Korea
- 13.1.6 Rest of Asia Pacific
- 14. Middle East and Africa Live Cell Imaging Market Analysis, Insights and Forecast, 2019-2031
- 14.1. Market Analysis, Insights and Forecast - By Country/Sub-region
- 14.1.1 GCC
- 14.1.2 South Africa
- 14.1.3 Rest of Middle East and Africa
- 15. South America Live Cell Imaging Market Analysis, Insights and Forecast, 2019-2031
- 15.1. Market Analysis, Insights and Forecast - By Country/Sub-region
- 15.1.1 Brazil
- 15.1.2 Argentina
- 15.1.3 Rest of South America
- 16. Competitive Analysis
- 16.1. Global Market Share Analysis 2024
- 16.2. Company Profiles
- 16.2.1 Becton Dickinson and Company
- 16.2.1.1. Overview
- 16.2.1.2. Products
- 16.2.1.3. SWOT Analysis
- 16.2.1.4. Recent Developments
- 16.2.1.5. Financials (Based on Availability)
- 16.2.2 Zeiss Group
- 16.2.2.1. Overview
- 16.2.2.2. Products
- 16.2.2.3. SWOT Analysis
- 16.2.2.4. Recent Developments
- 16.2.2.5. Financials (Based on Availability)
- 16.2.3 LCI (Live Cell Instrument)
- 16.2.3.1. Overview
- 16.2.3.2. Products
- 16.2.3.3. SWOT Analysis
- 16.2.3.4. Recent Developments
- 16.2.3.5. Financials (Based on Availability)
- 16.2.4 Axion BioSystems Inc
- 16.2.4.1. Overview
- 16.2.4.2. Products
- 16.2.4.3. SWOT Analysis
- 16.2.4.4. Recent Developments
- 16.2.4.5. Financials (Based on Availability)
- 16.2.5 Thermo Fisher Scientific Inc
- 16.2.5.1. Overview
- 16.2.5.2. Products
- 16.2.5.3. SWOT Analysis
- 16.2.5.4. Recent Developments
- 16.2.5.5. Financials (Based on Availability)
- 16.2.6 Danaher (Leica Microsystems)
- 16.2.6.1. Overview
- 16.2.6.2. Products
- 16.2.6.3. SWOT Analysis
- 16.2.6.4. Recent Developments
- 16.2.6.5. Financials (Based on Availability)
- 16.2.7 Agilent Technologies Inc
- 16.2.7.1. Overview
- 16.2.7.2. Products
- 16.2.7.3. SWOT Analysis
- 16.2.7.4. Recent Developments
- 16.2.7.5. Financials (Based on Availability)
- 16.2.8 Sartorius AG*List Not Exhaustive
- 16.2.8.1. Overview
- 16.2.8.2. Products
- 16.2.8.3. SWOT Analysis
- 16.2.8.4. Recent Developments
- 16.2.8.5. Financials (Based on Availability)
- 16.2.9 Nikon Corporation Inc
- 16.2.9.1. Overview
- 16.2.9.2. Products
- 16.2.9.3. SWOT Analysis
- 16.2.9.4. Recent Developments
- 16.2.9.5. Financials (Based on Availability)
- 16.2.10 Olympus Corporation (EVIDENT)
- 16.2.10.1. Overview
- 16.2.10.2. Products
- 16.2.10.3. SWOT Analysis
- 16.2.10.4. Recent Developments
- 16.2.10.5. Financials (Based on Availability)
- 16.2.11 Merck KGaA (Sigma- Aldrich Corporation)
- 16.2.11.1. Overview
- 16.2.11.2. Products
- 16.2.11.3. SWOT Analysis
- 16.2.11.4. Recent Developments
- 16.2.11.5. Financials (Based on Availability)
- 16.2.12 PerkinElmer Inc
- 16.2.12.1. Overview
- 16.2.12.2. Products
- 16.2.12.3. SWOT Analysis
- 16.2.12.4. Recent Developments
- 16.2.12.5. Financials (Based on Availability)
- 16.2.1 Becton Dickinson and Company
List of Figures
- Figure 1: Global Live Cell Imaging Market Revenue Breakdown (Million, %) by Region 2024 & 2032
- Figure 2: North America Live Cell Imaging Market Revenue (Million), by Country 2024 & 2032
- Figure 3: North America Live Cell Imaging Market Revenue Share (%), by Country 2024 & 2032
- Figure 4: Europe Live Cell Imaging Market Revenue (Million), by Country 2024 & 2032
- Figure 5: Europe Live Cell Imaging Market Revenue Share (%), by Country 2024 & 2032
- Figure 6: Asia Pacific Live Cell Imaging Market Revenue (Million), by Country 2024 & 2032
- Figure 7: Asia Pacific Live Cell Imaging Market Revenue Share (%), by Country 2024 & 2032
- Figure 8: Middle East and Africa Live Cell Imaging Market Revenue (Million), by Country 2024 & 2032
- Figure 9: Middle East and Africa Live Cell Imaging Market Revenue Share (%), by Country 2024 & 2032
- Figure 10: South America Live Cell Imaging Market Revenue (Million), by Country 2024 & 2032
- Figure 11: South America Live Cell Imaging Market Revenue Share (%), by Country 2024 & 2032
- Figure 12: North America Live Cell Imaging Market Revenue (Million), by Product 2024 & 2032
- Figure 13: North America Live Cell Imaging Market Revenue Share (%), by Product 2024 & 2032
- Figure 14: North America Live Cell Imaging Market Revenue (Million), by Application 2024 & 2032
- Figure 15: North America Live Cell Imaging Market Revenue Share (%), by Application 2024 & 2032
- Figure 16: North America Live Cell Imaging Market Revenue (Million), by Country 2024 & 2032
- Figure 17: North America Live Cell Imaging Market Revenue Share (%), by Country 2024 & 2032
- Figure 18: Europe Live Cell Imaging Market Revenue (Million), by Product 2024 & 2032
- Figure 19: Europe Live Cell Imaging Market Revenue Share (%), by Product 2024 & 2032
- Figure 20: Europe Live Cell Imaging Market Revenue (Million), by Application 2024 & 2032
- Figure 21: Europe Live Cell Imaging Market Revenue Share (%), by Application 2024 & 2032
- Figure 22: Europe Live Cell Imaging Market Revenue (Million), by Country 2024 & 2032
- Figure 23: Europe Live Cell Imaging Market Revenue Share (%), by Country 2024 & 2032
- Figure 24: Asia Pacific Live Cell Imaging Market Revenue (Million), by Product 2024 & 2032
- Figure 25: Asia Pacific Live Cell Imaging Market Revenue Share (%), by Product 2024 & 2032
- Figure 26: Asia Pacific Live Cell Imaging Market Revenue (Million), by Application 2024 & 2032
- Figure 27: Asia Pacific Live Cell Imaging Market Revenue Share (%), by Application 2024 & 2032
- Figure 28: Asia Pacific Live Cell Imaging Market Revenue (Million), by Country 2024 & 2032
- Figure 29: Asia Pacific Live Cell Imaging Market Revenue Share (%), by Country 2024 & 2032
- Figure 30: Middle East and Africa Live Cell Imaging Market Revenue (Million), by Product 2024 & 2032
- Figure 31: Middle East and Africa Live Cell Imaging Market Revenue Share (%), by Product 2024 & 2032
- Figure 32: Middle East and Africa Live Cell Imaging Market Revenue (Million), by Application 2024 & 2032
- Figure 33: Middle East and Africa Live Cell Imaging Market Revenue Share (%), by Application 2024 & 2032
- Figure 34: Middle East and Africa Live Cell Imaging Market Revenue (Million), by Country 2024 & 2032
- Figure 35: Middle East and Africa Live Cell Imaging Market Revenue Share (%), by Country 2024 & 2032
- Figure 36: South America Live Cell Imaging Market Revenue (Million), by Product 2024 & 2032
- Figure 37: South America Live Cell Imaging Market Revenue Share (%), by Product 2024 & 2032
- Figure 38: South America Live Cell Imaging Market Revenue (Million), by Application 2024 & 2032
- Figure 39: South America Live Cell Imaging Market Revenue Share (%), by Application 2024 & 2032
- Figure 40: South America Live Cell Imaging Market Revenue (Million), by Country 2024 & 2032
- Figure 41: South America Live Cell Imaging Market Revenue Share (%), by Country 2024 & 2032
List of Tables
- Table 1: Global Live Cell Imaging Market Revenue Million Forecast, by Region 2019 & 2032
- Table 2: Global Live Cell Imaging Market Revenue Million Forecast, by Product 2019 & 2032
- Table 3: Global Live Cell Imaging Market Revenue Million Forecast, by Application 2019 & 2032
- Table 4: Global Live Cell Imaging Market Revenue Million Forecast, by Region 2019 & 2032
- Table 5: Global Live Cell Imaging Market Revenue Million Forecast, by Country 2019 & 2032
- Table 6: United States Live Cell Imaging Market Revenue (Million) Forecast, by Application 2019 & 2032
- Table 7: Canada Live Cell Imaging Market Revenue (Million) Forecast, by Application 2019 & 2032
- Table 8: Mexico Live Cell Imaging Market Revenue (Million) Forecast, by Application 2019 & 2032
- Table 9: Global Live Cell Imaging Market Revenue Million Forecast, by Country 2019 & 2032
- Table 10: Germany Live Cell Imaging Market Revenue (Million) Forecast, by Application 2019 & 2032
- Table 11: United Kingdom Live Cell Imaging Market Revenue (Million) Forecast, by Application 2019 & 2032
- Table 12: France Live Cell Imaging Market Revenue (Million) Forecast, by Application 2019 & 2032
- Table 13: Italy Live Cell Imaging Market Revenue (Million) Forecast, by Application 2019 & 2032
- Table 14: Spain Live Cell Imaging Market Revenue (Million) Forecast, by Application 2019 & 2032
- Table 15: Rest of Europe Live Cell Imaging Market Revenue (Million) Forecast, by Application 2019 & 2032
- Table 16: Global Live Cell Imaging Market Revenue Million Forecast, by Country 2019 & 2032
- Table 17: China Live Cell Imaging Market Revenue (Million) Forecast, by Application 2019 & 2032
- Table 18: Japan Live Cell Imaging Market Revenue (Million) Forecast, by Application 2019 & 2032
- Table 19: India Live Cell Imaging Market Revenue (Million) Forecast, by Application 2019 & 2032
- Table 20: Australia Live Cell Imaging Market Revenue (Million) Forecast, by Application 2019 & 2032
- Table 21: South Korea Live Cell Imaging Market Revenue (Million) Forecast, by Application 2019 & 2032
- Table 22: Rest of Asia Pacific Live Cell Imaging Market Revenue (Million) Forecast, by Application 2019 & 2032
- Table 23: Global Live Cell Imaging Market Revenue Million Forecast, by Country 2019 & 2032
- Table 24: GCC Live Cell Imaging Market Revenue (Million) Forecast, by Application 2019 & 2032
- Table 25: South Africa Live Cell Imaging Market Revenue (Million) Forecast, by Application 2019 & 2032
- Table 26: Rest of Middle East and Africa Live Cell Imaging Market Revenue (Million) Forecast, by Application 2019 & 2032
- Table 27: Global Live Cell Imaging Market Revenue Million Forecast, by Country 2019 & 2032
- Table 28: Brazil Live Cell Imaging Market Revenue (Million) Forecast, by Application 2019 & 2032
- Table 29: Argentina Live Cell Imaging Market Revenue (Million) Forecast, by Application 2019 & 2032
- Table 30: Rest of South America Live Cell Imaging Market Revenue (Million) Forecast, by Application 2019 & 2032
- Table 31: Global Live Cell Imaging Market Revenue Million Forecast, by Product 2019 & 2032
- Table 32: Global Live Cell Imaging Market Revenue Million Forecast, by Application 2019 & 2032
- Table 33: Global Live Cell Imaging Market Revenue Million Forecast, by Country 2019 & 2032
- Table 34: United States Live Cell Imaging Market Revenue (Million) Forecast, by Application 2019 & 2032
- Table 35: Canada Live Cell Imaging Market Revenue (Million) Forecast, by Application 2019 & 2032
- Table 36: Mexico Live Cell Imaging Market Revenue (Million) Forecast, by Application 2019 & 2032
- Table 37: Global Live Cell Imaging Market Revenue Million Forecast, by Product 2019 & 2032
- Table 38: Global Live Cell Imaging Market Revenue Million Forecast, by Application 2019 & 2032
- Table 39: Global Live Cell Imaging Market Revenue Million Forecast, by Country 2019 & 2032
- Table 40: Germany Live Cell Imaging Market Revenue (Million) Forecast, by Application 2019 & 2032
- Table 41: United Kingdom Live Cell Imaging Market Revenue (Million) Forecast, by Application 2019 & 2032
- Table 42: France Live Cell Imaging Market Revenue (Million) Forecast, by Application 2019 & 2032
- Table 43: Italy Live Cell Imaging Market Revenue (Million) Forecast, by Application 2019 & 2032
- Table 44: Spain Live Cell Imaging Market Revenue (Million) Forecast, by Application 2019 & 2032
- Table 45: Rest of Europe Live Cell Imaging Market Revenue (Million) Forecast, by Application 2019 & 2032
- Table 46: Global Live Cell Imaging Market Revenue Million Forecast, by Product 2019 & 2032
- Table 47: Global Live Cell Imaging Market Revenue Million Forecast, by Application 2019 & 2032
- Table 48: Global Live Cell Imaging Market Revenue Million Forecast, by Country 2019 & 2032
- Table 49: China Live Cell Imaging Market Revenue (Million) Forecast, by Application 2019 & 2032
- Table 50: Japan Live Cell Imaging Market Revenue (Million) Forecast, by Application 2019 & 2032
- Table 51: India Live Cell Imaging Market Revenue (Million) Forecast, by Application 2019 & 2032
- Table 52: Australia Live Cell Imaging Market Revenue (Million) Forecast, by Application 2019 & 2032
- Table 53: South Korea Live Cell Imaging Market Revenue (Million) Forecast, by Application 2019 & 2032
- Table 54: Rest of Asia Pacific Live Cell Imaging Market Revenue (Million) Forecast, by Application 2019 & 2032
- Table 55: Global Live Cell Imaging Market Revenue Million Forecast, by Product 2019 & 2032
- Table 56: Global Live Cell Imaging Market Revenue Million Forecast, by Application 2019 & 2032
- Table 57: Global Live Cell Imaging Market Revenue Million Forecast, by Country 2019 & 2032
- Table 58: GCC Live Cell Imaging Market Revenue (Million) Forecast, by Application 2019 & 2032
- Table 59: South Africa Live Cell Imaging Market Revenue (Million) Forecast, by Application 2019 & 2032
- Table 60: Rest of Middle East and Africa Live Cell Imaging Market Revenue (Million) Forecast, by Application 2019 & 2032
- Table 61: Global Live Cell Imaging Market Revenue Million Forecast, by Product 2019 & 2032
- Table 62: Global Live Cell Imaging Market Revenue Million Forecast, by Application 2019 & 2032
- Table 63: Global Live Cell Imaging Market Revenue Million Forecast, by Country 2019 & 2032
- Table 64: Brazil Live Cell Imaging Market Revenue (Million) Forecast, by Application 2019 & 2032
- Table 65: Argentina Live Cell Imaging Market Revenue (Million) Forecast, by Application 2019 & 2032
- Table 66: Rest of South America Live Cell Imaging Market Revenue (Million) Forecast, by Application 2019 & 2032
Frequently Asked Questions
1. What is the projected Compound Annual Growth Rate (CAGR) of the Live Cell Imaging Market?
The projected CAGR is approximately 7.06%.
2. Which companies are prominent players in the Live Cell Imaging Market?
Key companies in the market include Becton Dickinson and Company, Zeiss Group, LCI (Live Cell Instrument), Axion BioSystems Inc, Thermo Fisher Scientific Inc, Danaher (Leica Microsystems), Agilent Technologies Inc, Sartorius AG*List Not Exhaustive, Nikon Corporation Inc, Olympus Corporation (EVIDENT), Merck KGaA (Sigma- Aldrich Corporation), PerkinElmer Inc.
3. What are the main segments of the Live Cell Imaging Market?
The market segments include Product, Application.
4. Can you provide details about the market size?
The market size is estimated to be USD 2.25 Million as of 2022.
5. What are some drivers contributing to market growth?
Adoption of High-content Screening Techniques in Drug Discovery; Rising Prevalence of Chronic Disease Demanding Higher and Quicker Diagnostic Facilities; Government Funding for Cell-based Research.
6. What are the notable trends driving market growth?
Standalone Systems Segment is Expected to Hold a Significant Market Share Over the Forecast Period.
7. Are there any restraints impacting market growth?
High Cost of High-content Screening Systems; Shortage of Skilled Professionals.
8. Can you provide examples of recent developments in the market?
June 2023: Nanolive launched the 3D Cell Explorer 96focus, an innovative platform that brings unlimited high content analysis to label-free live cell imaging without the need for labeling. With the aid of AI-powered digital assays and an automated workflow, the 3D Cell Explorer 96focus streamlines the imaging process, offering researchers a cost-effective and reliable means of conducting cell imaging experiments.
9. What pricing options are available for accessing the report?
Pricing options include single-user, multi-user, and enterprise licenses priced at USD 4750, USD 5250, and USD 8750 respectively.
10. Is the market size provided in terms of value or volume?
The market size is provided in terms of value, measured in Million.
11. Are there any specific market keywords associated with the report?
Yes, the market keyword associated with the report is "Live Cell Imaging Market," which aids in identifying and referencing the specific market segment covered.
12. How do I determine which pricing option suits my needs best?
The pricing options vary based on user requirements and access needs. Individual users may opt for single-user licenses, while businesses requiring broader access may choose multi-user or enterprise licenses for cost-effective access to the report.
13. Are there any additional resources or data provided in the Live Cell Imaging Market report?
While the report offers comprehensive insights, it's advisable to review the specific contents or supplementary materials provided to ascertain if additional resources or data are available.
14. How can I stay updated on further developments or reports in the Live Cell Imaging Market?
To stay informed about further developments, trends, and reports in the Live Cell Imaging Market, consider subscribing to industry newsletters, following relevant companies and organizations, or regularly checking reputable industry news sources and publications.
Methodology
Step 1 - Identification of Relevant Samples Size from Population Database


Step 2 - Approaches for Defining Global Market Size (Value, Volume* & Price*)

Note*: In applicable scenarios
Step 3 - Data Sources
Primary Research
- Web Analytics
- Survey Reports
- Research Institute
- Latest Research Reports
- Opinion Leaders
Secondary Research
- Annual Reports
- White Paper
- Latest Press Release
- Industry Association
- Paid Database
- Investor Presentations

Step 4 - Data Triangulation
Involves using different sources of information in order to increase the validity of a study
These sources are likely to be stakeholders in a program - participants, other researchers, program staff, other community members, and so on.
Then we put all data in single framework & apply various statistical tools to find out the dynamic on the market.
During the analysis stage, feedback from the stakeholder groups would be compared to determine areas of agreement as well as areas of divergence
