

Key Insights
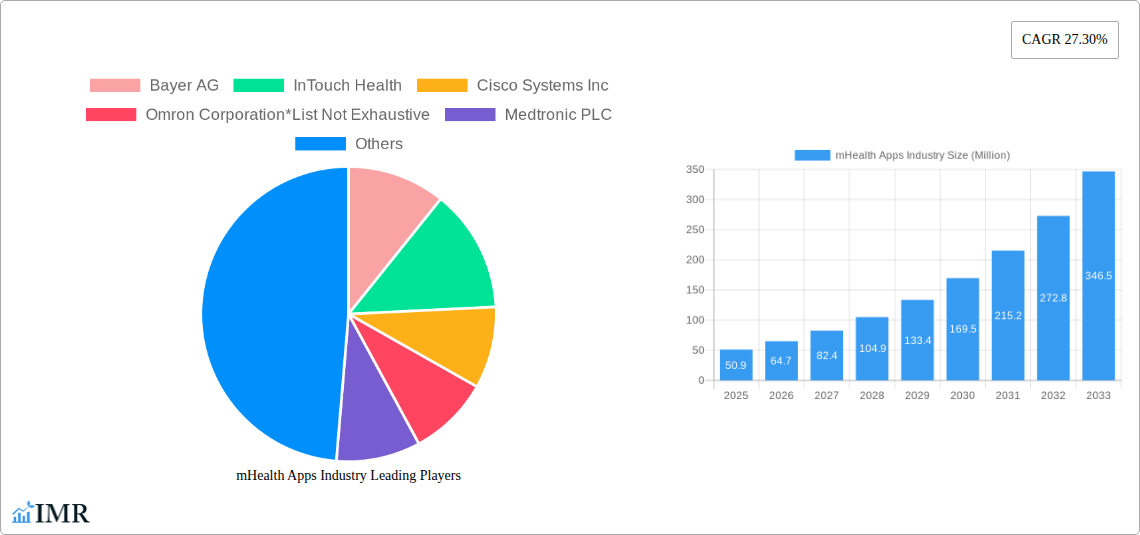
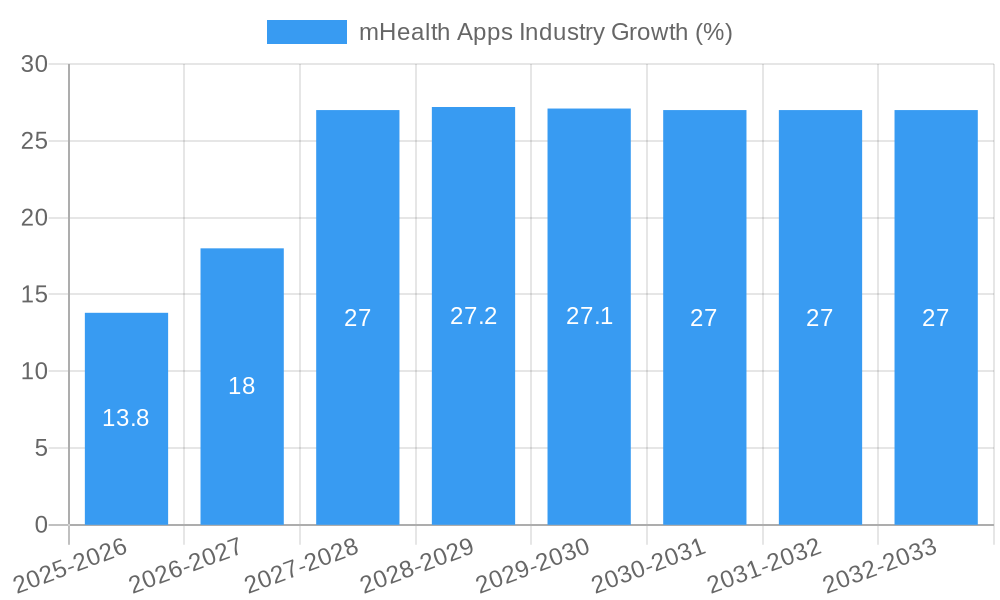
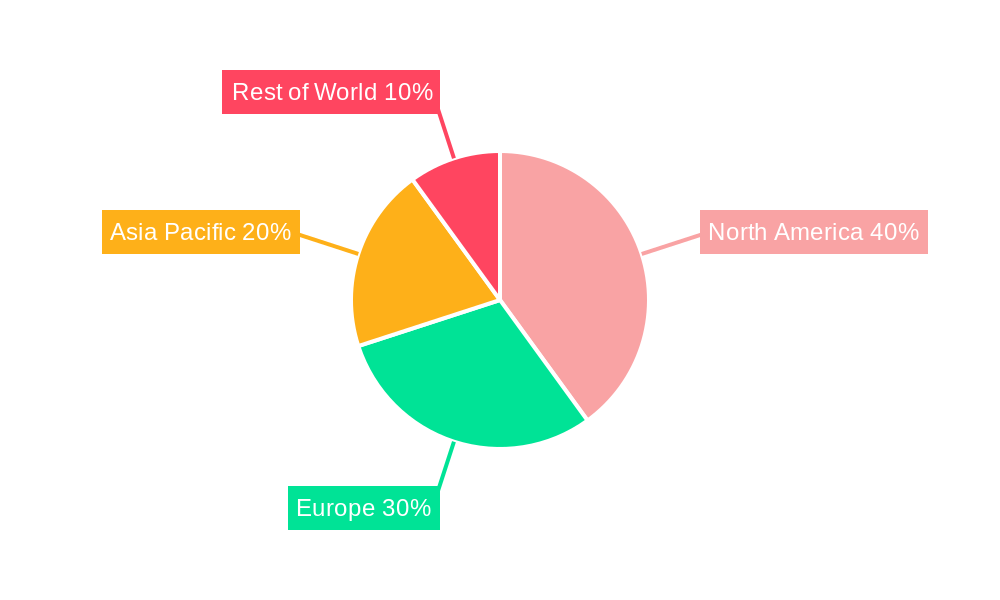
The mHealth app market, valued at $50.9 million in 2025, is experiencing robust growth, projected to expand at a compound annual growth rate (CAGR) of 27.30% from 2025 to 2033. This surge is driven by several key factors. Increasing smartphone penetration globally, coupled with rising healthcare costs and a growing demand for convenient, accessible healthcare solutions, are fueling market expansion. Furthermore, advancements in mobile technology, improved data security measures, and the increasing integration of wearable devices are enabling the development of sophisticated and user-friendly mHealth applications. The market's segmentation reflects diverse application areas, from remote patient monitoring (RPM) using devices like blood glucose and cardiac monitors to telehealth consultations and wellness programs. Major players like Bayer AG, Medtronic PLC, and Johnson & Johnson are actively investing in this sector, further propelling innovation and market growth. Specific service types such as monitoring services, post-acute care services, and teleconsultation are particularly significant contributors, indicating a shift towards proactive and remote healthcare management. Geographic variations exist, with North America and Europe currently holding substantial market share, but the Asia-Pacific region shows immense potential for future growth given its burgeoning technological landscape and expanding middle class.
The restraints to market growth include concerns surrounding data privacy and security, regulatory hurdles for app approval and implementation across different regions, and the digital literacy gap among certain populations hindering widespread adoption. However, continuous technological advancements, improving regulatory frameworks, and targeted public health initiatives aiming to bridge the digital divide are expected to mitigate these challenges. The future trajectory suggests a continued upward trend, with the development of more specialized and personalized mHealth applications catering to niche healthcare needs. Expansion into emerging markets and strategic partnerships between technology companies and healthcare providers will be crucial for sustainable growth in the years to come. The integration of artificial intelligence (AI) and machine learning (ML) into mHealth apps holds immense potential to further enhance diagnostic capabilities, personalized treatment plans, and overall patient care.
This comprehensive report provides an in-depth analysis of the mHealth apps industry, covering market dynamics, growth trends, regional segmentation, product landscape, key players, and future outlook. The study period spans 2019-2033, with a base year of 2025 and a forecast period of 2025-2033. This report is invaluable for industry professionals, investors, and stakeholders seeking to understand and capitalize on the opportunities within this rapidly evolving market. The total market size in 2025 is estimated at xx Million.
mHealth Apps Industry Market Dynamics & Structure
The mHealth apps market is characterized by a moderately fragmented structure with several large players and numerous smaller niche players competing intensely. Technological innovation, driven by advancements in mobile technology, AI, and data analytics, significantly impacts market growth. Regulatory frameworks, varying across geographies, present both opportunities and challenges. Competitive product substitutes, including traditional healthcare services, exert pressure on market share. The end-user demographics are expanding to encompass broader age groups and health conditions. M&A activity is relatively frequent, signifying consolidation and expansion efforts.
- Market Concentration: Moderately fragmented; top 5 players hold approximately xx% market share (2025).
- Technological Drivers: AI-powered diagnostics, wearable integration, remote patient monitoring advancements.
- Regulatory Landscape: Varying regulations across regions impact app development and deployment.
- Competitive Substitutes: Traditional healthcare services, telehealth platforms.
- End-User Demographics: Expanding to include older populations and chronic disease management.
- M&A Activity: xx major deals concluded in the last 5 years, indicating industry consolidation.
mHealth Apps Industry Growth Trends & Insights
The mHealth apps market demonstrates robust growth, driven by increasing smartphone penetration, rising healthcare costs, and a growing preference for convenient, remote healthcare solutions. The market is experiencing significant adoption rates, particularly in developed economies. Technological disruptions, such as the integration of AI and IoT devices, are further accelerating growth. Consumer behavior is shifting towards proactive health management and self-care, fueling demand for mHealth apps.
- Market Size (2025): xx Million
- CAGR (2025-2033): xx%
- Market Penetration (2025): xx% in developed countries, xx% in developing countries.
- Key Growth Drivers: Smartphone penetration, rising healthcare costs, technological advancements.
Dominant Regions, Countries, or Segments in mHealth Apps Industry
North America currently dominates the mHealth apps market, driven by high technological adoption, robust healthcare infrastructure, and favorable regulatory environments. Within the service types, Monitoring Services and Teleconsultation are leading segments, owing to their scalability and effectiveness. Healthcare providers are the primary stakeholders, accounting for a significant share of app usage and investment. Among device types, Remote Patient Monitoring Devices are experiencing substantial growth.
- Leading Region: North America (xx% market share in 2025)
- Leading Service Type: Monitoring Services (xx% of total market revenue in 2025)
- Leading Stakeholder: Healthcare Providers (xx% of total market revenue in 2025)
- Leading Device Type: Remote Patient Monitoring Devices (xx% of total market revenue in 2025)
- Key Growth Drivers (North America): Advanced technology infrastructure, high healthcare expenditure, favorable regulatory policies.
- Key Growth Drivers (Other Regions): Increasing smartphone penetration, rising government initiatives to promote telemedicine.
mHealth Apps Industry Product Landscape
mHealth apps offer a wide range of functionalities, from basic health tracking and wellness programs to sophisticated diagnostic tools and remote patient monitoring systems. Innovations include AI-powered diagnostic capabilities, integration with wearable sensors, and personalized health recommendations. Key performance indicators include user engagement, accuracy of data collection, and effectiveness in improving health outcomes. Unique selling propositions often include user-friendly interfaces, data security features, and integration with existing healthcare systems.
Key Drivers, Barriers & Challenges in mHealth Apps Industry
Key Drivers: Rising smartphone penetration, increasing healthcare costs, growing demand for convenient healthcare access, government initiatives promoting telehealth, technological advancements in mobile technology and AI.
Key Barriers & Challenges: Data privacy and security concerns, interoperability issues between different apps and healthcare systems, regulatory hurdles, reimbursement challenges, and lack of digital literacy among certain populations. The impact of these challenges is estimated to reduce the market growth by approximately xx% by 2033.
Emerging Opportunities in mHealth Apps Industry
Untapped markets in developing countries present significant opportunities. Innovative applications, such as AI-powered diagnostics and personalized medicine, are poised for rapid growth. Evolving consumer preferences towards proactive health management and personalized wellness solutions are creating new market niches. The integration of mHealth apps with wearable technology and other IoT devices presents immense potential.
Growth Accelerators in the mHealth Apps Industry
Technological advancements in areas like AI and machine learning, coupled with strategic partnerships between healthcare providers and technology companies, are accelerating market growth. Expanding market reach into under-served populations and strategic market expansion efforts in developing nations are expected to fuel long-term growth.
Key Players Shaping the mHealth Apps Market
- Bayer AG
- InTouch Health
- Cisco Systems Inc
- Omron Corporation
- Medtronic PLC
- Cerner Corporation
- Koninklijke Philips NV
- Johnson & Johnson
- AT&T Inc
- Athenahealth Inc
Notable Milestones in mHealth Apps Industry Sector
- 2020: Launch of several AI-powered diagnostic apps.
- 2021: Increased adoption of remote patient monitoring solutions during the COVID-19 pandemic.
- 2022: Significant investment in mHealth app development by major tech companies.
- 2023: Several mergers and acquisitions in the mHealth app sector.
In-Depth mHealth Apps Industry Market Outlook
The mHealth apps market is poised for continued robust growth, driven by technological advancements and increasing adoption. Strategic partnerships, expansion into new markets, and the development of innovative applications will shape the future of the industry. The market is expected to reach xx Million by 2033, presenting significant opportunities for investors and stakeholders.
mHealth Apps Industry Segmentation
-
1. Service Type
-
1.1. Monitoring Services
- 1.1.1. Independent Aging Solutions
- 1.1.2. Chronic Disease Management
- 1.1.3. Post-acute Care Services
-
1.2. Diagnostic Services
- 1.2.1. Self Diagnosis
- 1.2.2. Telemedicine Solutions
- 1.2.3. Medical
-
1.3. Treatment Services
- 1.3.1. Remote Patient Monitoring Services
- 1.3.2. Teleconsultation
- 1.4. Wellness and Fitness Solutions
- 1.5. Other Se
-
1.1. Monitoring Services
-
2. Device Type
- 2.1. Blood Glucose Monitors
- 2.2. Cardiac Monitors
- 2.3. Hemodynamic Monitors
- 2.4. Neurological Monitors
- 2.5. Respiratory Monitors
- 2.6. Body and Temperature Monitors
- 2.7. Remote Patient Monitoring Devices
- 2.8. Other Device Types
-
3. Stake Holder
- 3.1. Mobile Operators
- 3.2. Healthcare Providers
- 3.3. Application/Content Players
- 3.4. Other Stake Holders
mHealth Apps Industry Segmentation By Geography
-
1. North America
- 1.1. United States
- 1.2. Canada
- 1.3. Mexico
-
2. South America
- 2.1. Brazil
- 2.2. Argentina
- 2.3. Rest of South America
-
3. Europe
- 3.1. United Kingdom
- 3.2. Germany
- 3.3. France
- 3.4. Italy
- 3.5. Spain
- 3.6. Russia
- 3.7. Benelux
- 3.8. Nordics
- 3.9. Rest of Europe
-
4. Middle East & Africa
- 4.1. Turkey
- 4.2. Israel
- 4.3. GCC
- 4.4. North Africa
- 4.5. South Africa
- 4.6. Rest of Middle East & Africa
-
5. Asia Pacific
- 5.1. China
- 5.2. India
- 5.3. Japan
- 5.4. South Korea
- 5.5. ASEAN
- 5.6. Oceania
- 5.7. Rest of Asia Pacific
mHealth Apps Industry REPORT HIGHLIGHTS
| Aspects | Details |
|---|---|
| Study Period | 2019-2033 |
| Base Year | 2024 |
| Estimated Year | 2025 |
| Forecast Period | 2025-2033 |
| Historical Period | 2019-2024 |
| Growth Rate | CAGR of 27.30% from 2019-2033 |
| Segmentation |
|
Table of Contents
- 1. Introduction
- 1.1. Research Scope
- 1.2. Market Segmentation
- 1.3. Research Methodology
- 1.4. Definitions and Assumptions
- 2. Executive Summary
- 2.1. Introduction
- 3. Market Dynamics
- 3.1. Introduction
- 3.2. Market Drivers
- 3.2.1 ; Growing usage of Smartphones
- 3.2.2 Tablets
- 3.2.3 and Mobile Technology in Healthcare; Increasing Awareness of People for Chronic Diseases; Increasing Focus on Personalized Medicine and Patient-centered Approach; Increased Usage of Mobile Health App
- 3.3. Market Restrains
- 3.3.1. ; Data Insecurity; Provider Liability Concerns; Lower Adoption in Rural Areas
- 3.4. Market Trends
- 3.4.1. Remote Patient Monitoring Devices is the Leading Segment Under Devices Type that is Expected to Grow During the Forecast Period
- 4. Market Factor Analysis
- 4.1. Porters Five Forces
- 4.2. Supply/Value Chain
- 4.3. PESTEL analysis
- 4.4. Market Entropy
- 4.5. Patent/Trademark Analysis
- 5. Global mHealth Apps Industry Analysis, Insights and Forecast, 2019-2031
- 5.1. Market Analysis, Insights and Forecast - by Service Type
- 5.1.1. Monitoring Services
- 5.1.1.1. Independent Aging Solutions
- 5.1.1.2. Chronic Disease Management
- 5.1.1.3. Post-acute Care Services
- 5.1.2. Diagnostic Services
- 5.1.2.1. Self Diagnosis
- 5.1.2.2. Telemedicine Solutions
- 5.1.2.3. Medical
- 5.1.3. Treatment Services
- 5.1.3.1. Remote Patient Monitoring Services
- 5.1.3.2. Teleconsultation
- 5.1.4. Wellness and Fitness Solutions
- 5.1.5. Other Se
- 5.1.1. Monitoring Services
- 5.2. Market Analysis, Insights and Forecast - by Device Type
- 5.2.1. Blood Glucose Monitors
- 5.2.2. Cardiac Monitors
- 5.2.3. Hemodynamic Monitors
- 5.2.4. Neurological Monitors
- 5.2.5. Respiratory Monitors
- 5.2.6. Body and Temperature Monitors
- 5.2.7. Remote Patient Monitoring Devices
- 5.2.8. Other Device Types
- 5.3. Market Analysis, Insights and Forecast - by Stake Holder
- 5.3.1. Mobile Operators
- 5.3.2. Healthcare Providers
- 5.3.3. Application/Content Players
- 5.3.4. Other Stake Holders
- 5.4. Market Analysis, Insights and Forecast - by Region
- 5.4.1. North America
- 5.4.2. South America
- 5.4.3. Europe
- 5.4.4. Middle East & Africa
- 5.4.5. Asia Pacific
- 5.1. Market Analysis, Insights and Forecast - by Service Type
- 6. North America mHealth Apps Industry Analysis, Insights and Forecast, 2019-2031
- 6.1. Market Analysis, Insights and Forecast - by Service Type
- 6.1.1. Monitoring Services
- 6.1.1.1. Independent Aging Solutions
- 6.1.1.2. Chronic Disease Management
- 6.1.1.3. Post-acute Care Services
- 6.1.2. Diagnostic Services
- 6.1.2.1. Self Diagnosis
- 6.1.2.2. Telemedicine Solutions
- 6.1.2.3. Medical
- 6.1.3. Treatment Services
- 6.1.3.1. Remote Patient Monitoring Services
- 6.1.3.2. Teleconsultation
- 6.1.4. Wellness and Fitness Solutions
- 6.1.5. Other Se
- 6.1.1. Monitoring Services
- 6.2. Market Analysis, Insights and Forecast - by Device Type
- 6.2.1. Blood Glucose Monitors
- 6.2.2. Cardiac Monitors
- 6.2.3. Hemodynamic Monitors
- 6.2.4. Neurological Monitors
- 6.2.5. Respiratory Monitors
- 6.2.6. Body and Temperature Monitors
- 6.2.7. Remote Patient Monitoring Devices
- 6.2.8. Other Device Types
- 6.3. Market Analysis, Insights and Forecast - by Stake Holder
- 6.3.1. Mobile Operators
- 6.3.2. Healthcare Providers
- 6.3.3. Application/Content Players
- 6.3.4. Other Stake Holders
- 6.1. Market Analysis, Insights and Forecast - by Service Type
- 7. South America mHealth Apps Industry Analysis, Insights and Forecast, 2019-2031
- 7.1. Market Analysis, Insights and Forecast - by Service Type
- 7.1.1. Monitoring Services
- 7.1.1.1. Independent Aging Solutions
- 7.1.1.2. Chronic Disease Management
- 7.1.1.3. Post-acute Care Services
- 7.1.2. Diagnostic Services
- 7.1.2.1. Self Diagnosis
- 7.1.2.2. Telemedicine Solutions
- 7.1.2.3. Medical
- 7.1.3. Treatment Services
- 7.1.3.1. Remote Patient Monitoring Services
- 7.1.3.2. Teleconsultation
- 7.1.4. Wellness and Fitness Solutions
- 7.1.5. Other Se
- 7.1.1. Monitoring Services
- 7.2. Market Analysis, Insights and Forecast - by Device Type
- 7.2.1. Blood Glucose Monitors
- 7.2.2. Cardiac Monitors
- 7.2.3. Hemodynamic Monitors
- 7.2.4. Neurological Monitors
- 7.2.5. Respiratory Monitors
- 7.2.6. Body and Temperature Monitors
- 7.2.7. Remote Patient Monitoring Devices
- 7.2.8. Other Device Types
- 7.3. Market Analysis, Insights and Forecast - by Stake Holder
- 7.3.1. Mobile Operators
- 7.3.2. Healthcare Providers
- 7.3.3. Application/Content Players
- 7.3.4. Other Stake Holders
- 7.1. Market Analysis, Insights and Forecast - by Service Type
- 8. Europe mHealth Apps Industry Analysis, Insights and Forecast, 2019-2031
- 8.1. Market Analysis, Insights and Forecast - by Service Type
- 8.1.1. Monitoring Services
- 8.1.1.1. Independent Aging Solutions
- 8.1.1.2. Chronic Disease Management
- 8.1.1.3. Post-acute Care Services
- 8.1.2. Diagnostic Services
- 8.1.2.1. Self Diagnosis
- 8.1.2.2. Telemedicine Solutions
- 8.1.2.3. Medical
- 8.1.3. Treatment Services
- 8.1.3.1. Remote Patient Monitoring Services
- 8.1.3.2. Teleconsultation
- 8.1.4. Wellness and Fitness Solutions
- 8.1.5. Other Se
- 8.1.1. Monitoring Services
- 8.2. Market Analysis, Insights and Forecast - by Device Type
- 8.2.1. Blood Glucose Monitors
- 8.2.2. Cardiac Monitors
- 8.2.3. Hemodynamic Monitors
- 8.2.4. Neurological Monitors
- 8.2.5. Respiratory Monitors
- 8.2.6. Body and Temperature Monitors
- 8.2.7. Remote Patient Monitoring Devices
- 8.2.8. Other Device Types
- 8.3. Market Analysis, Insights and Forecast - by Stake Holder
- 8.3.1. Mobile Operators
- 8.3.2. Healthcare Providers
- 8.3.3. Application/Content Players
- 8.3.4. Other Stake Holders
- 8.1. Market Analysis, Insights and Forecast - by Service Type
- 9. Middle East & Africa mHealth Apps Industry Analysis, Insights and Forecast, 2019-2031
- 9.1. Market Analysis, Insights and Forecast - by Service Type
- 9.1.1. Monitoring Services
- 9.1.1.1. Independent Aging Solutions
- 9.1.1.2. Chronic Disease Management
- 9.1.1.3. Post-acute Care Services
- 9.1.2. Diagnostic Services
- 9.1.2.1. Self Diagnosis
- 9.1.2.2. Telemedicine Solutions
- 9.1.2.3. Medical
- 9.1.3. Treatment Services
- 9.1.3.1. Remote Patient Monitoring Services
- 9.1.3.2. Teleconsultation
- 9.1.4. Wellness and Fitness Solutions
- 9.1.5. Other Se
- 9.1.1. Monitoring Services
- 9.2. Market Analysis, Insights and Forecast - by Device Type
- 9.2.1. Blood Glucose Monitors
- 9.2.2. Cardiac Monitors
- 9.2.3. Hemodynamic Monitors
- 9.2.4. Neurological Monitors
- 9.2.5. Respiratory Monitors
- 9.2.6. Body and Temperature Monitors
- 9.2.7. Remote Patient Monitoring Devices
- 9.2.8. Other Device Types
- 9.3. Market Analysis, Insights and Forecast - by Stake Holder
- 9.3.1. Mobile Operators
- 9.3.2. Healthcare Providers
- 9.3.3. Application/Content Players
- 9.3.4. Other Stake Holders
- 9.1. Market Analysis, Insights and Forecast - by Service Type
- 10. Asia Pacific mHealth Apps Industry Analysis, Insights and Forecast, 2019-2031
- 10.1. Market Analysis, Insights and Forecast - by Service Type
- 10.1.1. Monitoring Services
- 10.1.1.1. Independent Aging Solutions
- 10.1.1.2. Chronic Disease Management
- 10.1.1.3. Post-acute Care Services
- 10.1.2. Diagnostic Services
- 10.1.2.1. Self Diagnosis
- 10.1.2.2. Telemedicine Solutions
- 10.1.2.3. Medical
- 10.1.3. Treatment Services
- 10.1.3.1. Remote Patient Monitoring Services
- 10.1.3.2. Teleconsultation
- 10.1.4. Wellness and Fitness Solutions
- 10.1.5. Other Se
- 10.1.1. Monitoring Services
- 10.2. Market Analysis, Insights and Forecast - by Device Type
- 10.2.1. Blood Glucose Monitors
- 10.2.2. Cardiac Monitors
- 10.2.3. Hemodynamic Monitors
- 10.2.4. Neurological Monitors
- 10.2.5. Respiratory Monitors
- 10.2.6. Body and Temperature Monitors
- 10.2.7. Remote Patient Monitoring Devices
- 10.2.8. Other Device Types
- 10.3. Market Analysis, Insights and Forecast - by Stake Holder
- 10.3.1. Mobile Operators
- 10.3.2. Healthcare Providers
- 10.3.3. Application/Content Players
- 10.3.4. Other Stake Holders
- 10.1. Market Analysis, Insights and Forecast - by Service Type
- 11. North America mHealth Apps Industry Analysis, Insights and Forecast, 2019-2031
- 11.1. Market Analysis, Insights and Forecast - By Country/Sub-region
- 11.1.1 United states
- 11.1.2 Canada
- 11.1.3 Mexico
- 12. South America mHealth Apps Industry Analysis, Insights and Forecast, 2019-2031
- 12.1. Market Analysis, Insights and Forecast - By Country/Sub-region
- 12.1.1 Brazil
- 12.1.2 Mexico
- 12.1.3 Rest of South America
- 13. Europe mHealth Apps Industry Analysis, Insights and Forecast, 2019-2031
- 13.1. Market Analysis, Insights and Forecast - By Country/Sub-region
- 13.1.1 United Kingdom
- 13.1.2 Germany
- 13.1.3 France
- 13.1.4 Italy
- 13.1.5 Spain
- 13.1.6 Russia
- 13.1.7 Rest of Europe
- 14. Asia Pacific mHealth Apps Industry Analysis, Insights and Forecast, 2019-2031
- 14.1. Market Analysis, Insights and Forecast - By Country/Sub-region
- 14.1.1 China
- 14.1.2 Japan
- 14.1.3 India
- 14.1.4 South Korea
- 14.1.5 Taiwan
- 14.1.6 Australia
- 14.1.7 Rest of Asia-Pacific
- 15. MEA mHealth Apps Industry Analysis, Insights and Forecast, 2019-2031
- 15.1. Market Analysis, Insights and Forecast - By Country/Sub-region
- 15.1.1 Middle East
- 15.1.2 Africa
- 16. Competitive Analysis
- 16.1. Global Market Share Analysis 2024
- 16.2. Company Profiles
- 16.2.1 Bayer AG
- 16.2.1.1. Overview
- 16.2.1.2. Products
- 16.2.1.3. SWOT Analysis
- 16.2.1.4. Recent Developments
- 16.2.1.5. Financials (Based on Availability)
- 16.2.2 InTouch Health
- 16.2.2.1. Overview
- 16.2.2.2. Products
- 16.2.2.3. SWOT Analysis
- 16.2.2.4. Recent Developments
- 16.2.2.5. Financials (Based on Availability)
- 16.2.3 Cisco Systems Inc
- 16.2.3.1. Overview
- 16.2.3.2. Products
- 16.2.3.3. SWOT Analysis
- 16.2.3.4. Recent Developments
- 16.2.3.5. Financials (Based on Availability)
- 16.2.4 Omron Corporation*List Not Exhaustive
- 16.2.4.1. Overview
- 16.2.4.2. Products
- 16.2.4.3. SWOT Analysis
- 16.2.4.4. Recent Developments
- 16.2.4.5. Financials (Based on Availability)
- 16.2.5 Medtronic PLC
- 16.2.5.1. Overview
- 16.2.5.2. Products
- 16.2.5.3. SWOT Analysis
- 16.2.5.4. Recent Developments
- 16.2.5.5. Financials (Based on Availability)
- 16.2.6 Cerner Corporation
- 16.2.6.1. Overview
- 16.2.6.2. Products
- 16.2.6.3. SWOT Analysis
- 16.2.6.4. Recent Developments
- 16.2.6.5. Financials (Based on Availability)
- 16.2.7 Koninklijke Philips NV
- 16.2.7.1. Overview
- 16.2.7.2. Products
- 16.2.7.3. SWOT Analysis
- 16.2.7.4. Recent Developments
- 16.2.7.5. Financials (Based on Availability)
- 16.2.8 Johnson & Johnson
- 16.2.8.1. Overview
- 16.2.8.2. Products
- 16.2.8.3. SWOT Analysis
- 16.2.8.4. Recent Developments
- 16.2.8.5. Financials (Based on Availability)
- 16.2.9 AT&T Inc
- 16.2.9.1. Overview
- 16.2.9.2. Products
- 16.2.9.3. SWOT Analysis
- 16.2.9.4. Recent Developments
- 16.2.9.5. Financials (Based on Availability)
- 16.2.10 Athenahealth Inc
- 16.2.10.1. Overview
- 16.2.10.2. Products
- 16.2.10.3. SWOT Analysis
- 16.2.10.4. Recent Developments
- 16.2.10.5. Financials (Based on Availability)
- 16.2.1 Bayer AG
List of Figures
- Figure 1: Global mHealth Apps Industry Revenue Breakdown (Million, %) by Region 2024 & 2032
- Figure 2: North America mHealth Apps Industry Revenue (Million), by Country 2024 & 2032
- Figure 3: North America mHealth Apps Industry Revenue Share (%), by Country 2024 & 2032
- Figure 4: South America mHealth Apps Industry Revenue (Million), by Country 2024 & 2032
- Figure 5: South America mHealth Apps Industry Revenue Share (%), by Country 2024 & 2032
- Figure 6: Europe mHealth Apps Industry Revenue (Million), by Country 2024 & 2032
- Figure 7: Europe mHealth Apps Industry Revenue Share (%), by Country 2024 & 2032
- Figure 8: Asia Pacific mHealth Apps Industry Revenue (Million), by Country 2024 & 2032
- Figure 9: Asia Pacific mHealth Apps Industry Revenue Share (%), by Country 2024 & 2032
- Figure 10: MEA mHealth Apps Industry Revenue (Million), by Country 2024 & 2032
- Figure 11: MEA mHealth Apps Industry Revenue Share (%), by Country 2024 & 2032
- Figure 12: North America mHealth Apps Industry Revenue (Million), by Service Type 2024 & 2032
- Figure 13: North America mHealth Apps Industry Revenue Share (%), by Service Type 2024 & 2032
- Figure 14: North America mHealth Apps Industry Revenue (Million), by Device Type 2024 & 2032
- Figure 15: North America mHealth Apps Industry Revenue Share (%), by Device Type 2024 & 2032
- Figure 16: North America mHealth Apps Industry Revenue (Million), by Stake Holder 2024 & 2032
- Figure 17: North America mHealth Apps Industry Revenue Share (%), by Stake Holder 2024 & 2032
- Figure 18: North America mHealth Apps Industry Revenue (Million), by Country 2024 & 2032
- Figure 19: North America mHealth Apps Industry Revenue Share (%), by Country 2024 & 2032
- Figure 20: South America mHealth Apps Industry Revenue (Million), by Service Type 2024 & 2032
- Figure 21: South America mHealth Apps Industry Revenue Share (%), by Service Type 2024 & 2032
- Figure 22: South America mHealth Apps Industry Revenue (Million), by Device Type 2024 & 2032
- Figure 23: South America mHealth Apps Industry Revenue Share (%), by Device Type 2024 & 2032
- Figure 24: South America mHealth Apps Industry Revenue (Million), by Stake Holder 2024 & 2032
- Figure 25: South America mHealth Apps Industry Revenue Share (%), by Stake Holder 2024 & 2032
- Figure 26: South America mHealth Apps Industry Revenue (Million), by Country 2024 & 2032
- Figure 27: South America mHealth Apps Industry Revenue Share (%), by Country 2024 & 2032
- Figure 28: Europe mHealth Apps Industry Revenue (Million), by Service Type 2024 & 2032
- Figure 29: Europe mHealth Apps Industry Revenue Share (%), by Service Type 2024 & 2032
- Figure 30: Europe mHealth Apps Industry Revenue (Million), by Device Type 2024 & 2032
- Figure 31: Europe mHealth Apps Industry Revenue Share (%), by Device Type 2024 & 2032
- Figure 32: Europe mHealth Apps Industry Revenue (Million), by Stake Holder 2024 & 2032
- Figure 33: Europe mHealth Apps Industry Revenue Share (%), by Stake Holder 2024 & 2032
- Figure 34: Europe mHealth Apps Industry Revenue (Million), by Country 2024 & 2032
- Figure 35: Europe mHealth Apps Industry Revenue Share (%), by Country 2024 & 2032
- Figure 36: Middle East & Africa mHealth Apps Industry Revenue (Million), by Service Type 2024 & 2032
- Figure 37: Middle East & Africa mHealth Apps Industry Revenue Share (%), by Service Type 2024 & 2032
- Figure 38: Middle East & Africa mHealth Apps Industry Revenue (Million), by Device Type 2024 & 2032
- Figure 39: Middle East & Africa mHealth Apps Industry Revenue Share (%), by Device Type 2024 & 2032
- Figure 40: Middle East & Africa mHealth Apps Industry Revenue (Million), by Stake Holder 2024 & 2032
- Figure 41: Middle East & Africa mHealth Apps Industry Revenue Share (%), by Stake Holder 2024 & 2032
- Figure 42: Middle East & Africa mHealth Apps Industry Revenue (Million), by Country 2024 & 2032
- Figure 43: Middle East & Africa mHealth Apps Industry Revenue Share (%), by Country 2024 & 2032
- Figure 44: Asia Pacific mHealth Apps Industry Revenue (Million), by Service Type 2024 & 2032
- Figure 45: Asia Pacific mHealth Apps Industry Revenue Share (%), by Service Type 2024 & 2032
- Figure 46: Asia Pacific mHealth Apps Industry Revenue (Million), by Device Type 2024 & 2032
- Figure 47: Asia Pacific mHealth Apps Industry Revenue Share (%), by Device Type 2024 & 2032
- Figure 48: Asia Pacific mHealth Apps Industry Revenue (Million), by Stake Holder 2024 & 2032
- Figure 49: Asia Pacific mHealth Apps Industry Revenue Share (%), by Stake Holder 2024 & 2032
- Figure 50: Asia Pacific mHealth Apps Industry Revenue (Million), by Country 2024 & 2032
- Figure 51: Asia Pacific mHealth Apps Industry Revenue Share (%), by Country 2024 & 2032
List of Tables
- Table 1: Global mHealth Apps Industry Revenue Million Forecast, by Region 2019 & 2032
- Table 2: Global mHealth Apps Industry Revenue Million Forecast, by Service Type 2019 & 2032
- Table 3: Global mHealth Apps Industry Revenue Million Forecast, by Device Type 2019 & 2032
- Table 4: Global mHealth Apps Industry Revenue Million Forecast, by Stake Holder 2019 & 2032
- Table 5: Global mHealth Apps Industry Revenue Million Forecast, by Region 2019 & 2032
- Table 6: Global mHealth Apps Industry Revenue Million Forecast, by Country 2019 & 2032
- Table 7: United states mHealth Apps Industry Revenue (Million) Forecast, by Application 2019 & 2032
- Table 8: Canada mHealth Apps Industry Revenue (Million) Forecast, by Application 2019 & 2032
- Table 9: Mexico mHealth Apps Industry Revenue (Million) Forecast, by Application 2019 & 2032
- Table 10: Global mHealth Apps Industry Revenue Million Forecast, by Country 2019 & 2032
- Table 11: Brazil mHealth Apps Industry Revenue (Million) Forecast, by Application 2019 & 2032
- Table 12: Mexico mHealth Apps Industry Revenue (Million) Forecast, by Application 2019 & 2032
- Table 13: Rest of South America mHealth Apps Industry Revenue (Million) Forecast, by Application 2019 & 2032
- Table 14: Global mHealth Apps Industry Revenue Million Forecast, by Country 2019 & 2032
- Table 15: United Kingdom mHealth Apps Industry Revenue (Million) Forecast, by Application 2019 & 2032
- Table 16: Germany mHealth Apps Industry Revenue (Million) Forecast, by Application 2019 & 2032
- Table 17: France mHealth Apps Industry Revenue (Million) Forecast, by Application 2019 & 2032
- Table 18: Italy mHealth Apps Industry Revenue (Million) Forecast, by Application 2019 & 2032
- Table 19: Spain mHealth Apps Industry Revenue (Million) Forecast, by Application 2019 & 2032
- Table 20: Russia mHealth Apps Industry Revenue (Million) Forecast, by Application 2019 & 2032
- Table 21: Rest of Europe mHealth Apps Industry Revenue (Million) Forecast, by Application 2019 & 2032
- Table 22: Global mHealth Apps Industry Revenue Million Forecast, by Country 2019 & 2032
- Table 23: China mHealth Apps Industry Revenue (Million) Forecast, by Application 2019 & 2032
- Table 24: Japan mHealth Apps Industry Revenue (Million) Forecast, by Application 2019 & 2032
- Table 25: India mHealth Apps Industry Revenue (Million) Forecast, by Application 2019 & 2032
- Table 26: South Korea mHealth Apps Industry Revenue (Million) Forecast, by Application 2019 & 2032
- Table 27: Taiwan mHealth Apps Industry Revenue (Million) Forecast, by Application 2019 & 2032
- Table 28: Australia mHealth Apps Industry Revenue (Million) Forecast, by Application 2019 & 2032
- Table 29: Rest of Asia-Pacific mHealth Apps Industry Revenue (Million) Forecast, by Application 2019 & 2032
- Table 30: Global mHealth Apps Industry Revenue Million Forecast, by Country 2019 & 2032
- Table 31: Middle East mHealth Apps Industry Revenue (Million) Forecast, by Application 2019 & 2032
- Table 32: Africa mHealth Apps Industry Revenue (Million) Forecast, by Application 2019 & 2032
- Table 33: Global mHealth Apps Industry Revenue Million Forecast, by Service Type 2019 & 2032
- Table 34: Global mHealth Apps Industry Revenue Million Forecast, by Device Type 2019 & 2032
- Table 35: Global mHealth Apps Industry Revenue Million Forecast, by Stake Holder 2019 & 2032
- Table 36: Global mHealth Apps Industry Revenue Million Forecast, by Country 2019 & 2032
- Table 37: United States mHealth Apps Industry Revenue (Million) Forecast, by Application 2019 & 2032
- Table 38: Canada mHealth Apps Industry Revenue (Million) Forecast, by Application 2019 & 2032
- Table 39: Mexico mHealth Apps Industry Revenue (Million) Forecast, by Application 2019 & 2032
- Table 40: Global mHealth Apps Industry Revenue Million Forecast, by Service Type 2019 & 2032
- Table 41: Global mHealth Apps Industry Revenue Million Forecast, by Device Type 2019 & 2032
- Table 42: Global mHealth Apps Industry Revenue Million Forecast, by Stake Holder 2019 & 2032
- Table 43: Global mHealth Apps Industry Revenue Million Forecast, by Country 2019 & 2032
- Table 44: Brazil mHealth Apps Industry Revenue (Million) Forecast, by Application 2019 & 2032
- Table 45: Argentina mHealth Apps Industry Revenue (Million) Forecast, by Application 2019 & 2032
- Table 46: Rest of South America mHealth Apps Industry Revenue (Million) Forecast, by Application 2019 & 2032
- Table 47: Global mHealth Apps Industry Revenue Million Forecast, by Service Type 2019 & 2032
- Table 48: Global mHealth Apps Industry Revenue Million Forecast, by Device Type 2019 & 2032
- Table 49: Global mHealth Apps Industry Revenue Million Forecast, by Stake Holder 2019 & 2032
- Table 50: Global mHealth Apps Industry Revenue Million Forecast, by Country 2019 & 2032
- Table 51: United Kingdom mHealth Apps Industry Revenue (Million) Forecast, by Application 2019 & 2032
- Table 52: Germany mHealth Apps Industry Revenue (Million) Forecast, by Application 2019 & 2032
- Table 53: France mHealth Apps Industry Revenue (Million) Forecast, by Application 2019 & 2032
- Table 54: Italy mHealth Apps Industry Revenue (Million) Forecast, by Application 2019 & 2032
- Table 55: Spain mHealth Apps Industry Revenue (Million) Forecast, by Application 2019 & 2032
- Table 56: Russia mHealth Apps Industry Revenue (Million) Forecast, by Application 2019 & 2032
- Table 57: Benelux mHealth Apps Industry Revenue (Million) Forecast, by Application 2019 & 2032
- Table 58: Nordics mHealth Apps Industry Revenue (Million) Forecast, by Application 2019 & 2032
- Table 59: Rest of Europe mHealth Apps Industry Revenue (Million) Forecast, by Application 2019 & 2032
- Table 60: Global mHealth Apps Industry Revenue Million Forecast, by Service Type 2019 & 2032
- Table 61: Global mHealth Apps Industry Revenue Million Forecast, by Device Type 2019 & 2032
- Table 62: Global mHealth Apps Industry Revenue Million Forecast, by Stake Holder 2019 & 2032
- Table 63: Global mHealth Apps Industry Revenue Million Forecast, by Country 2019 & 2032
- Table 64: Turkey mHealth Apps Industry Revenue (Million) Forecast, by Application 2019 & 2032
- Table 65: Israel mHealth Apps Industry Revenue (Million) Forecast, by Application 2019 & 2032
- Table 66: GCC mHealth Apps Industry Revenue (Million) Forecast, by Application 2019 & 2032
- Table 67: North Africa mHealth Apps Industry Revenue (Million) Forecast, by Application 2019 & 2032
- Table 68: South Africa mHealth Apps Industry Revenue (Million) Forecast, by Application 2019 & 2032
- Table 69: Rest of Middle East & Africa mHealth Apps Industry Revenue (Million) Forecast, by Application 2019 & 2032
- Table 70: Global mHealth Apps Industry Revenue Million Forecast, by Service Type 2019 & 2032
- Table 71: Global mHealth Apps Industry Revenue Million Forecast, by Device Type 2019 & 2032
- Table 72: Global mHealth Apps Industry Revenue Million Forecast, by Stake Holder 2019 & 2032
- Table 73: Global mHealth Apps Industry Revenue Million Forecast, by Country 2019 & 2032
- Table 74: China mHealth Apps Industry Revenue (Million) Forecast, by Application 2019 & 2032
- Table 75: India mHealth Apps Industry Revenue (Million) Forecast, by Application 2019 & 2032
- Table 76: Japan mHealth Apps Industry Revenue (Million) Forecast, by Application 2019 & 2032
- Table 77: South Korea mHealth Apps Industry Revenue (Million) Forecast, by Application 2019 & 2032
- Table 78: ASEAN mHealth Apps Industry Revenue (Million) Forecast, by Application 2019 & 2032
- Table 79: Oceania mHealth Apps Industry Revenue (Million) Forecast, by Application 2019 & 2032
- Table 80: Rest of Asia Pacific mHealth Apps Industry Revenue (Million) Forecast, by Application 2019 & 2032
Frequently Asked Questions
1. What is the projected Compound Annual Growth Rate (CAGR) of the mHealth Apps Industry?
The projected CAGR is approximately 27.30%.
2. Which companies are prominent players in the mHealth Apps Industry?
Key companies in the market include Bayer AG, InTouch Health, Cisco Systems Inc, Omron Corporation*List Not Exhaustive, Medtronic PLC, Cerner Corporation, Koninklijke Philips NV, Johnson & Johnson, AT&T Inc, Athenahealth Inc.
3. What are the main segments of the mHealth Apps Industry?
The market segments include Service Type, Device Type, Stake Holder.
4. Can you provide details about the market size?
The market size is estimated to be USD 50.9 Million as of 2022.
5. What are some drivers contributing to market growth?
; Growing usage of Smartphones. Tablets. and Mobile Technology in Healthcare; Increasing Awareness of People for Chronic Diseases; Increasing Focus on Personalized Medicine and Patient-centered Approach; Increased Usage of Mobile Health App.
6. What are the notable trends driving market growth?
Remote Patient Monitoring Devices is the Leading Segment Under Devices Type that is Expected to Grow During the Forecast Period.
7. Are there any restraints impacting market growth?
; Data Insecurity; Provider Liability Concerns; Lower Adoption in Rural Areas.
8. Can you provide examples of recent developments in the market?
N/A
9. What pricing options are available for accessing the report?
Pricing options include single-user, multi-user, and enterprise licenses priced at USD 3800, USD 4500, and USD 5800 respectively.
10. Is the market size provided in terms of value or volume?
The market size is provided in terms of value, measured in Million.
11. Are there any specific market keywords associated with the report?
Yes, the market keyword associated with the report is "mHealth Apps Industry," which aids in identifying and referencing the specific market segment covered.
12. How do I determine which pricing option suits my needs best?
The pricing options vary based on user requirements and access needs. Individual users may opt for single-user licenses, while businesses requiring broader access may choose multi-user or enterprise licenses for cost-effective access to the report.
13. Are there any additional resources or data provided in the mHealth Apps Industry report?
While the report offers comprehensive insights, it's advisable to review the specific contents or supplementary materials provided to ascertain if additional resources or data are available.
14. How can I stay updated on further developments or reports in the mHealth Apps Industry?
To stay informed about further developments, trends, and reports in the mHealth Apps Industry, consider subscribing to industry newsletters, following relevant companies and organizations, or regularly checking reputable industry news sources and publications.
Methodology
Step 1 - Identification of Relevant Samples Size from Population Database


Step 2 - Approaches for Defining Global Market Size (Value, Volume* & Price*)

Note*: In applicable scenarios
Step 3 - Data Sources
Primary Research
- Web Analytics
- Survey Reports
- Research Institute
- Latest Research Reports
- Opinion Leaders
Secondary Research
- Annual Reports
- White Paper
- Latest Press Release
- Industry Association
- Paid Database
- Investor Presentations

Step 4 - Data Triangulation
Involves using different sources of information in order to increase the validity of a study
These sources are likely to be stakeholders in a program - participants, other researchers, program staff, other community members, and so on.
Then we put all data in single framework & apply various statistical tools to find out the dynamic on the market.
During the analysis stage, feedback from the stakeholder groups would be compared to determine areas of agreement as well as areas of divergence
