

Key Insights
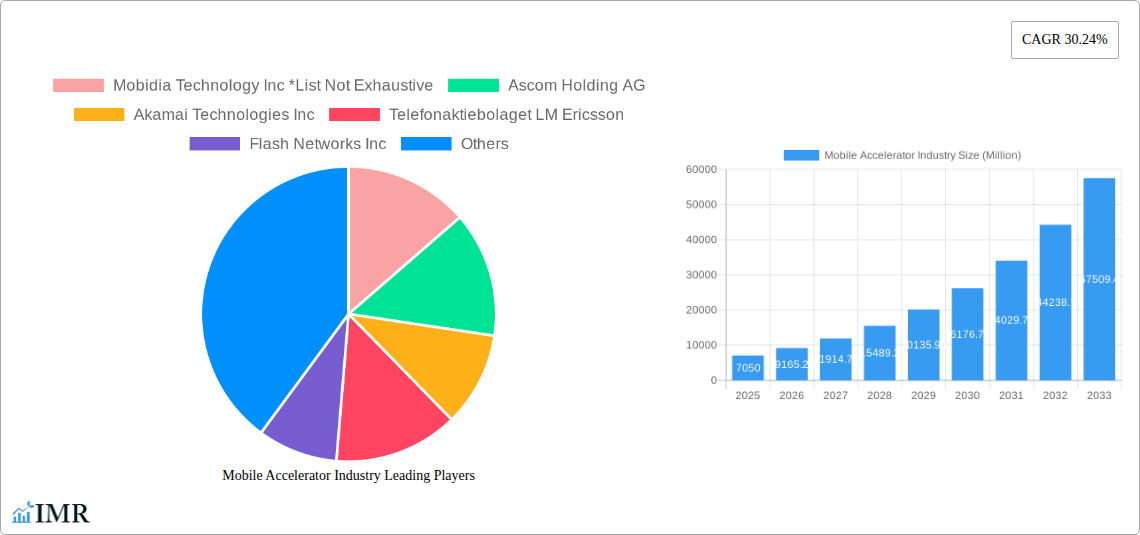
The mobile accelerator market, valued at $7.05 billion in 2025, is projected for robust growth, exhibiting a compound annual growth rate (CAGR) of 30.24% from 2025 to 2033. This expansion is driven by several key factors. The proliferation of mobile devices, particularly smartphones and tablets, fuels the demand for faster and more efficient mobile applications and content delivery. The increasing reliance on mobile applications for various activities, including gaming, e-commerce, and social networking, necessitates optimized performance, which mobile accelerators effectively address. Furthermore, the growth of 5G networks and the expanding adoption of cloud-based services are creating opportunities for enhanced mobile experiences, thus boosting the market for solutions that can optimize performance in these evolving environments. The market segmentation reveals significant potential across diverse application areas. Gaming, e-commerce, and location-based services are among the leading application segments driving demand. Similarly, the market is segmented by device type (smartphones, tablets, etc.) and acceleration type (content delivery network acceleration, WAN optimization, etc.), offering diverse opportunities for specialized solutions.
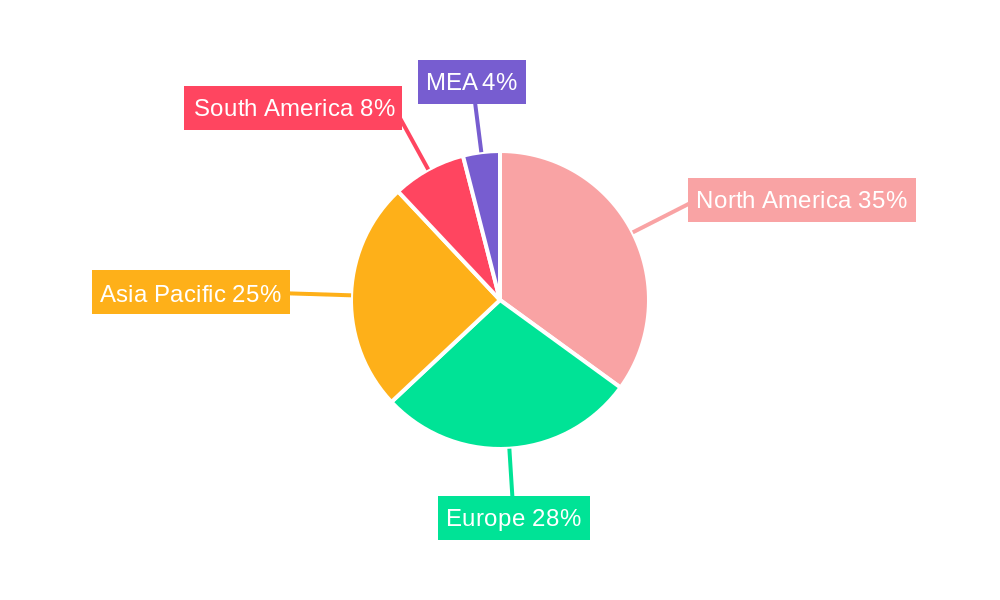
Geographic distribution indicates strong market presence in North America and Europe, driven by technological advancements and high adoption rates. However, the Asia-Pacific region is poised for significant growth, fueled by the rapid expansion of mobile internet usage and increasing smartphone penetration in emerging economies like India and China. Competition is fierce, with established players like Akamai Technologies, Ericsson, and Qualcomm alongside emerging innovators. While challenges such as the need for continuous technological innovation and security concerns exist, the overall market outlook remains highly positive, driven by the unrelenting growth of mobile technology and data consumption. This favorable environment anticipates substantial market expansion over the forecast period.
Mobile Accelerator Industry Market Report: 2019-2033
This comprehensive report provides a detailed analysis of the Mobile Accelerator market, encompassing its current state, future trajectory, and key players. With a focus on market dynamics, growth trends, and emerging opportunities, this report is an invaluable resource for industry professionals, investors, and strategists seeking to navigate this rapidly evolving landscape. The report covers the period 2019-2033, with a base year of 2025 and a forecast period of 2025-2033. The total market size is projected to reach xx Million units by 2033.
Mobile Accelerator Industry Market Dynamics & Structure
The mobile accelerator market is characterized by a moderately concentrated landscape with several key players holding significant market share. Technological innovation, particularly in 5G and edge computing, is a primary growth driver. Regulatory frameworks, including data privacy regulations and network security standards, significantly influence market dynamics. Competitive pressures stem from both established players and emerging startups. The market experiences substantial M&A activity, with larger companies acquiring smaller, innovative firms to expand their product portfolios and technological capabilities.
- Market Concentration: The top 5 players hold approximately xx% of the market share in 2025.
- Technological Innovation: Advancements in AI, machine learning, and edge computing are driving demand for sophisticated mobile acceleration solutions.
- Regulatory Landscape: Compliance with GDPR, CCPA, and other data privacy regulations shapes product development and deployment strategies.
- Competitive Substitutes: Software-defined networking (SDN) and network function virtualization (NFV) technologies pose some level of competitive threat.
- End-User Demographics: The market is driven by increasing smartphone and tablet penetration, especially in developing economies.
- M&A Activity: An average of xx M&A deals were recorded annually during the historical period (2019-2024).
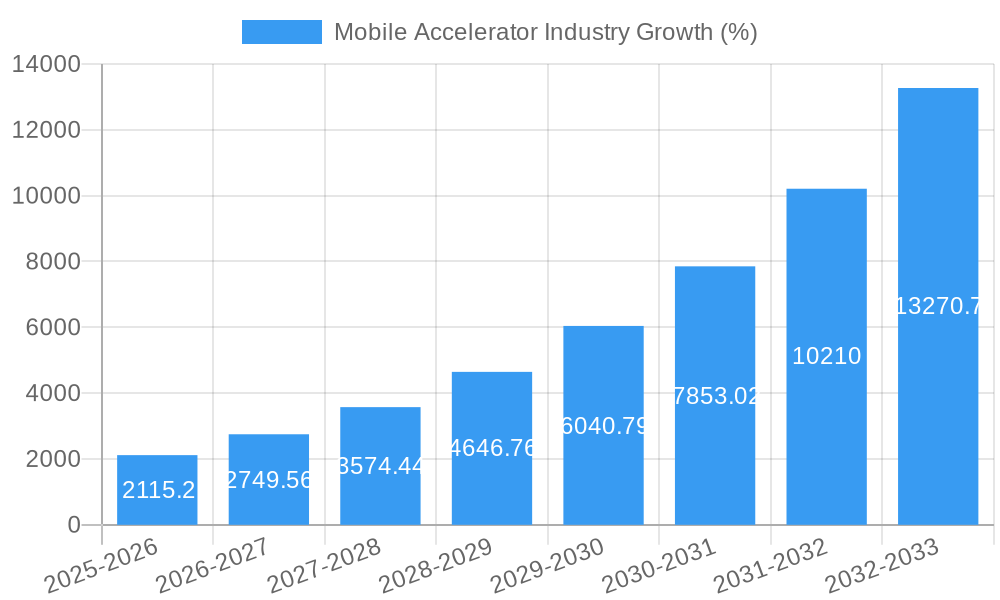
Mobile Accelerator Industry Growth Trends & Insights
The mobile accelerator market has experienced substantial growth throughout the historical period (2019-2024), fueled by the explosive growth of mobile data consumption and the increasing demand for high-performance mobile applications. The market is projected to maintain a healthy Compound Annual Growth Rate (CAGR) of xx% from 2025 to 2033. This growth is driven by several key factors, including the proliferation of smartphones and tablets, the rise of mobile gaming and e-commerce, and the increasing adoption of cloud-based services. Furthermore, technological advancements like 5G are expected to further accelerate market growth. The market penetration rate for mobile accelerators is projected to reach xx% by 2033. Consumer behavior shifts, notably a preference for high-quality mobile experiences, also support the market's expansion. The adoption of mobile accelerators across various sectors indicates significant future growth potential.
Dominant Regions, Countries, or Segments in Mobile Accelerator Industry
North America currently dominates the mobile accelerator market, driven by high smartphone penetration, robust technological infrastructure, and a large base of mobile application developers. However, the Asia-Pacific region is projected to experience the fastest growth rate, fueled by increasing smartphone adoption in emerging markets.
By Device:
- Smartphones: Smartphones remain the dominant device segment, accounting for xx% of the market in 2025.
- Tablets: Tablets contribute a significant share (xx%), driven by increased usage for media consumption and productivity.
- Other Devices: Other devices, including wearables and IoT devices, represent a growing segment with significant future potential.
By Type:
- Content Delivery Network (CDN) Acceleration: This segment holds the largest market share (xx%) due to the growing demand for seamless streaming and content delivery.
- Mobile Application Accelerator: This segment is witnessing rapid growth due to the rising popularity of mobile games and apps.
- WAN Optimization: This segment is experiencing steady growth driven by the increasing adoption of cloud-based services.
By Application:
- Gaming Applications: The gaming industry is a major driver, accounting for a significant portion of the market (xx%).
- M-Commerce Applications: The rise of mobile commerce fuels the demand for efficient and reliable mobile acceleration solutions.
- Social Networking Applications: The massive user base of social media platforms contributes significantly to the growth of this segment.
Mobile Accelerator Industry Product Landscape
The mobile accelerator market offers a diverse range of products, from hardware-based solutions to software-defined offerings. Recent innovations focus on enhancing performance, reducing latency, and improving security. Products are tailored to specific applications and device types, offering unique selling propositions such as improved bandwidth utilization, enhanced data compression, and advanced caching mechanisms. Key technological advancements include AI-powered optimization and integration with 5G networks.
Key Drivers, Barriers & Challenges in Mobile Accelerator Industry
Key Drivers:
- Increased mobile data consumption: The exponential growth in mobile data usage necessitates efficient acceleration solutions.
- 5G network deployment: The rollout of 5G networks creates opportunities for enhanced mobile acceleration technologies.
- Growth of mobile applications: The increasing number and complexity of mobile applications demand optimized performance.
Key Challenges:
- High initial investment costs: Implementing mobile acceleration solutions can require significant upfront investment.
- Interoperability issues: Ensuring compatibility across different devices, networks, and applications can be challenging.
- Security concerns: Protecting sensitive data transmitted over mobile networks is a crucial concern.
Emerging Opportunities in Mobile Accelerator Industry
- Expansion into emerging markets: Untapped potential exists in developing economies with rapidly growing mobile user bases.
- Integration with IoT devices: The proliferation of IoT devices presents new opportunities for mobile acceleration solutions.
- Development of AI-powered acceleration technologies: AI can optimize network performance and enhance user experience.
Growth Accelerators in the Mobile Accelerator Industry Industry
The long-term growth of the mobile accelerator market is driven by technological advancements, strategic partnerships, and expansion into new markets. 5G technology promises significantly improved speeds and lower latency, fueling demand for advanced mobile acceleration solutions. Collaborations between technology providers and mobile network operators are crucial for successful market penetration. Expanding into new markets, especially developing economies with rapidly growing mobile user bases, offers significant growth potential.
Key Players Shaping the Mobile Accelerator Industry Market
- Mobidia Technology Inc
- Ascom Holding AG
- Akamai Technologies Inc
- Telefonaktiebolaget LM Ericsson
- Flash Networks Inc
- F5 Networks Inc
- Juniper Networks Inc
- Huawei Technologies Co Ltd
- Riverbed Technologies Inc
- Rockstart Inc
- Qualcomm Inc
Notable Milestones in Mobile Accelerator Industry Sector
- November 2023: Huawei Technologies Co. Ltd unveiled two new all-flash storage products, the OceanStor Pacific 9920 and OceanStor Dorado 2100, enhancing data center efficiency and reliability, indirectly boosting mobile acceleration capabilities.
- October 2023: Sasken Technologies announced a collaboration with Qualcomm Technologies, Inc., fostering IoT innovation and impacting the future of connected devices and services, indirectly impacting the mobile accelerator market.
In-Depth Mobile Accelerator Industry Market Outlook
The future of the mobile accelerator market is bright, driven by continued growth in mobile data consumption, the widespread adoption of 5G technology, and the proliferation of mobile applications. Strategic partnerships and innovative product development will be crucial for success. The market is poised for significant expansion, particularly in emerging markets, presenting lucrative opportunities for both established players and new entrants. Companies focusing on AI-powered optimization and edge computing solutions are expected to gain a competitive advantage.
Mobile Accelerator Industry Segmentation
-
1. Device
- 1.1. Smartphones
- 1.2. Tablets
- 1.3. Other Devices
-
2. Type
- 2.1. Content/Web Applications
- 2.2. Content Delivery Network Acceleration
- 2.3. WAN Optimization
- 2.4. Mobile Application Accelerator
- 2.5. Device/User End Acceleration
- 2.6. Other Types
-
3. Application
- 3.1. Gaming Applications
- 3.2. M-Commerce Applications
- 3.3. Location-based Service Applications
- 3.4. Social Networking Applications
- 3.5. Music and Messaging Applications
- 3.6. Other Applications
Mobile Accelerator Industry Segmentation By Geography
- 1. North America
- 2. Europe
- 3. Asia Pacific
- 4. Latin America
- 5. Middle East and Africa
Mobile Accelerator Industry REPORT HIGHLIGHTS
| Aspects | Details |
|---|---|
| Study Period | 2019-2033 |
| Base Year | 2024 |
| Estimated Year | 2025 |
| Forecast Period | 2025-2033 |
| Historical Period | 2019-2024 |
| Growth Rate | CAGR of 30.24% from 2019-2033 |
| Segmentation |
|
Table of Contents
- 1. Introduction
- 1.1. Research Scope
- 1.2. Market Segmentation
- 1.3. Research Methodology
- 1.4. Definitions and Assumptions
- 2. Executive Summary
- 2.1. Introduction
- 3. Market Dynamics
- 3.1. Introduction
- 3.2. Market Drivers
- 3.2.1. Increasing Mobile Traffic and Mobile Marketing Trends
- 3.3. Market Restrains
- 3.3.1. Security Challenges as the Data is shared with Third-party Vendors
- 3.4. Market Trends
- 3.4.1. Increasing Mobile Traffic and Mobile Marketing Trends is Expected to Drive the Market Growth
- 4. Market Factor Analysis
- 4.1. Porters Five Forces
- 4.2. Supply/Value Chain
- 4.3. PESTEL analysis
- 4.4. Market Entropy
- 4.5. Patent/Trademark Analysis
- 5. Global Mobile Accelerator Industry Analysis, Insights and Forecast, 2019-2031
- 5.1. Market Analysis, Insights and Forecast - by Device
- 5.1.1. Smartphones
- 5.1.2. Tablets
- 5.1.3. Other Devices
- 5.2. Market Analysis, Insights and Forecast - by Type
- 5.2.1. Content/Web Applications
- 5.2.2. Content Delivery Network Acceleration
- 5.2.3. WAN Optimization
- 5.2.4. Mobile Application Accelerator
- 5.2.5. Device/User End Acceleration
- 5.2.6. Other Types
- 5.3. Market Analysis, Insights and Forecast - by Application
- 5.3.1. Gaming Applications
- 5.3.2. M-Commerce Applications
- 5.3.3. Location-based Service Applications
- 5.3.4. Social Networking Applications
- 5.3.5. Music and Messaging Applications
- 5.3.6. Other Applications
- 5.4. Market Analysis, Insights and Forecast - by Region
- 5.4.1. North America
- 5.4.2. Europe
- 5.4.3. Asia Pacific
- 5.4.4. Latin America
- 5.4.5. Middle East and Africa
- 5.1. Market Analysis, Insights and Forecast - by Device
- 6. North America Mobile Accelerator Industry Analysis, Insights and Forecast, 2019-2031
- 6.1. Market Analysis, Insights and Forecast - by Device
- 6.1.1. Smartphones
- 6.1.2. Tablets
- 6.1.3. Other Devices
- 6.2. Market Analysis, Insights and Forecast - by Type
- 6.2.1. Content/Web Applications
- 6.2.2. Content Delivery Network Acceleration
- 6.2.3. WAN Optimization
- 6.2.4. Mobile Application Accelerator
- 6.2.5. Device/User End Acceleration
- 6.2.6. Other Types
- 6.3. Market Analysis, Insights and Forecast - by Application
- 6.3.1. Gaming Applications
- 6.3.2. M-Commerce Applications
- 6.3.3. Location-based Service Applications
- 6.3.4. Social Networking Applications
- 6.3.5. Music and Messaging Applications
- 6.3.6. Other Applications
- 6.1. Market Analysis, Insights and Forecast - by Device
- 7. Europe Mobile Accelerator Industry Analysis, Insights and Forecast, 2019-2031
- 7.1. Market Analysis, Insights and Forecast - by Device
- 7.1.1. Smartphones
- 7.1.2. Tablets
- 7.1.3. Other Devices
- 7.2. Market Analysis, Insights and Forecast - by Type
- 7.2.1. Content/Web Applications
- 7.2.2. Content Delivery Network Acceleration
- 7.2.3. WAN Optimization
- 7.2.4. Mobile Application Accelerator
- 7.2.5. Device/User End Acceleration
- 7.2.6. Other Types
- 7.3. Market Analysis, Insights and Forecast - by Application
- 7.3.1. Gaming Applications
- 7.3.2. M-Commerce Applications
- 7.3.3. Location-based Service Applications
- 7.3.4. Social Networking Applications
- 7.3.5. Music and Messaging Applications
- 7.3.6. Other Applications
- 7.1. Market Analysis, Insights and Forecast - by Device
- 8. Asia Pacific Mobile Accelerator Industry Analysis, Insights and Forecast, 2019-2031
- 8.1. Market Analysis, Insights and Forecast - by Device
- 8.1.1. Smartphones
- 8.1.2. Tablets
- 8.1.3. Other Devices
- 8.2. Market Analysis, Insights and Forecast - by Type
- 8.2.1. Content/Web Applications
- 8.2.2. Content Delivery Network Acceleration
- 8.2.3. WAN Optimization
- 8.2.4. Mobile Application Accelerator
- 8.2.5. Device/User End Acceleration
- 8.2.6. Other Types
- 8.3. Market Analysis, Insights and Forecast - by Application
- 8.3.1. Gaming Applications
- 8.3.2. M-Commerce Applications
- 8.3.3. Location-based Service Applications
- 8.3.4. Social Networking Applications
- 8.3.5. Music and Messaging Applications
- 8.3.6. Other Applications
- 8.1. Market Analysis, Insights and Forecast - by Device
- 9. Latin America Mobile Accelerator Industry Analysis, Insights and Forecast, 2019-2031
- 9.1. Market Analysis, Insights and Forecast - by Device
- 9.1.1. Smartphones
- 9.1.2. Tablets
- 9.1.3. Other Devices
- 9.2. Market Analysis, Insights and Forecast - by Type
- 9.2.1. Content/Web Applications
- 9.2.2. Content Delivery Network Acceleration
- 9.2.3. WAN Optimization
- 9.2.4. Mobile Application Accelerator
- 9.2.5. Device/User End Acceleration
- 9.2.6. Other Types
- 9.3. Market Analysis, Insights and Forecast - by Application
- 9.3.1. Gaming Applications
- 9.3.2. M-Commerce Applications
- 9.3.3. Location-based Service Applications
- 9.3.4. Social Networking Applications
- 9.3.5. Music and Messaging Applications
- 9.3.6. Other Applications
- 9.1. Market Analysis, Insights and Forecast - by Device
- 10. Middle East and Africa Mobile Accelerator Industry Analysis, Insights and Forecast, 2019-2031
- 10.1. Market Analysis, Insights and Forecast - by Device
- 10.1.1. Smartphones
- 10.1.2. Tablets
- 10.1.3. Other Devices
- 10.2. Market Analysis, Insights and Forecast - by Type
- 10.2.1. Content/Web Applications
- 10.2.2. Content Delivery Network Acceleration
- 10.2.3. WAN Optimization
- 10.2.4. Mobile Application Accelerator
- 10.2.5. Device/User End Acceleration
- 10.2.6. Other Types
- 10.3. Market Analysis, Insights and Forecast - by Application
- 10.3.1. Gaming Applications
- 10.3.2. M-Commerce Applications
- 10.3.3. Location-based Service Applications
- 10.3.4. Social Networking Applications
- 10.3.5. Music and Messaging Applications
- 10.3.6. Other Applications
- 10.1. Market Analysis, Insights and Forecast - by Device
- 11. North America Mobile Accelerator Industry Analysis, Insights and Forecast, 2019-2031
- 11.1. Market Analysis, Insights and Forecast - By Country/Sub-region
- 11.1.1 United States
- 11.1.2 Canada
- 11.1.3 Mexico
- 12. Europe Mobile Accelerator Industry Analysis, Insights and Forecast, 2019-2031
- 12.1. Market Analysis, Insights and Forecast - By Country/Sub-region
- 12.1.1 Germany
- 12.1.2 United Kingdom
- 12.1.3 France
- 12.1.4 Spain
- 12.1.5 Italy
- 12.1.6 Spain
- 12.1.7 Belgium
- 12.1.8 Netherland
- 12.1.9 Nordics
- 12.1.10 Rest of Europe
- 13. Asia Pacific Mobile Accelerator Industry Analysis, Insights and Forecast, 2019-2031
- 13.1. Market Analysis, Insights and Forecast - By Country/Sub-region
- 13.1.1 China
- 13.1.2 Japan
- 13.1.3 India
- 13.1.4 South Korea
- 13.1.5 Southeast Asia
- 13.1.6 Australia
- 13.1.7 Indonesia
- 13.1.8 Phillipes
- 13.1.9 Singapore
- 13.1.10 Thailandc
- 13.1.11 Rest of Asia Pacific
- 14. South America Mobile Accelerator Industry Analysis, Insights and Forecast, 2019-2031
- 14.1. Market Analysis, Insights and Forecast - By Country/Sub-region
- 14.1.1 Brazil
- 14.1.2 Argentina
- 14.1.3 Peru
- 14.1.4 Chile
- 14.1.5 Colombia
- 14.1.6 Ecuador
- 14.1.7 Venezuela
- 14.1.8 Rest of South America
- 15. North America Mobile Accelerator Industry Analysis, Insights and Forecast, 2019-2031
- 15.1. Market Analysis, Insights and Forecast - By Country/Sub-region
- 15.1.1 United States
- 15.1.2 Canada
- 15.1.3 Mexico
- 16. MEA Mobile Accelerator Industry Analysis, Insights and Forecast, 2019-2031
- 16.1. Market Analysis, Insights and Forecast - By Country/Sub-region
- 16.1.1 United Arab Emirates
- 16.1.2 Saudi Arabia
- 16.1.3 South Africa
- 16.1.4 Rest of Middle East and Africa
- 17. Competitive Analysis
- 17.1. Global Market Share Analysis 2024
- 17.2. Company Profiles
- 17.2.1 Mobidia Technology Inc *List Not Exhaustive
- 17.2.1.1. Overview
- 17.2.1.2. Products
- 17.2.1.3. SWOT Analysis
- 17.2.1.4. Recent Developments
- 17.2.1.5. Financials (Based on Availability)
- 17.2.2 Ascom Holding AG
- 17.2.2.1. Overview
- 17.2.2.2. Products
- 17.2.2.3. SWOT Analysis
- 17.2.2.4. Recent Developments
- 17.2.2.5. Financials (Based on Availability)
- 17.2.3 Akamai Technologies Inc
- 17.2.3.1. Overview
- 17.2.3.2. Products
- 17.2.3.3. SWOT Analysis
- 17.2.3.4. Recent Developments
- 17.2.3.5. Financials (Based on Availability)
- 17.2.4 Telefonaktiebolaget LM Ericsson
- 17.2.4.1. Overview
- 17.2.4.2. Products
- 17.2.4.3. SWOT Analysis
- 17.2.4.4. Recent Developments
- 17.2.4.5. Financials (Based on Availability)
- 17.2.5 Flash Networks Inc
- 17.2.5.1. Overview
- 17.2.5.2. Products
- 17.2.5.3. SWOT Analysis
- 17.2.5.4. Recent Developments
- 17.2.5.5. Financials (Based on Availability)
- 17.2.6 F5 Networks Inc
- 17.2.6.1. Overview
- 17.2.6.2. Products
- 17.2.6.3. SWOT Analysis
- 17.2.6.4. Recent Developments
- 17.2.6.5. Financials (Based on Availability)
- 17.2.7 Juniper Networks Inc
- 17.2.7.1. Overview
- 17.2.7.2. Products
- 17.2.7.3. SWOT Analysis
- 17.2.7.4. Recent Developments
- 17.2.7.5. Financials (Based on Availability)
- 17.2.8 Huawei Technologies Co Ltd
- 17.2.8.1. Overview
- 17.2.8.2. Products
- 17.2.8.3. SWOT Analysis
- 17.2.8.4. Recent Developments
- 17.2.8.5. Financials (Based on Availability)
- 17.2.9 Riverbed Technologies Inc
- 17.2.9.1. Overview
- 17.2.9.2. Products
- 17.2.9.3. SWOT Analysis
- 17.2.9.4. Recent Developments
- 17.2.9.5. Financials (Based on Availability)
- 17.2.10 Rockstart Inc
- 17.2.10.1. Overview
- 17.2.10.2. Products
- 17.2.10.3. SWOT Analysis
- 17.2.10.4. Recent Developments
- 17.2.10.5. Financials (Based on Availability)
- 17.2.11 Qualcomm Inc
- 17.2.11.1. Overview
- 17.2.11.2. Products
- 17.2.11.3. SWOT Analysis
- 17.2.11.4. Recent Developments
- 17.2.11.5. Financials (Based on Availability)
- 17.2.1 Mobidia Technology Inc *List Not Exhaustive
List of Figures
- Figure 1: Global Mobile Accelerator Industry Revenue Breakdown (Million, %) by Region 2024 & 2032
- Figure 2: North America Mobile Accelerator Industry Revenue (Million), by Country 2024 & 2032
- Figure 3: North America Mobile Accelerator Industry Revenue Share (%), by Country 2024 & 2032
- Figure 4: Europe Mobile Accelerator Industry Revenue (Million), by Country 2024 & 2032
- Figure 5: Europe Mobile Accelerator Industry Revenue Share (%), by Country 2024 & 2032
- Figure 6: Asia Pacific Mobile Accelerator Industry Revenue (Million), by Country 2024 & 2032
- Figure 7: Asia Pacific Mobile Accelerator Industry Revenue Share (%), by Country 2024 & 2032
- Figure 8: South America Mobile Accelerator Industry Revenue (Million), by Country 2024 & 2032
- Figure 9: South America Mobile Accelerator Industry Revenue Share (%), by Country 2024 & 2032
- Figure 10: North America Mobile Accelerator Industry Revenue (Million), by Country 2024 & 2032
- Figure 11: North America Mobile Accelerator Industry Revenue Share (%), by Country 2024 & 2032
- Figure 12: MEA Mobile Accelerator Industry Revenue (Million), by Country 2024 & 2032
- Figure 13: MEA Mobile Accelerator Industry Revenue Share (%), by Country 2024 & 2032
- Figure 14: North America Mobile Accelerator Industry Revenue (Million), by Device 2024 & 2032
- Figure 15: North America Mobile Accelerator Industry Revenue Share (%), by Device 2024 & 2032
- Figure 16: North America Mobile Accelerator Industry Revenue (Million), by Type 2024 & 2032
- Figure 17: North America Mobile Accelerator Industry Revenue Share (%), by Type 2024 & 2032
- Figure 18: North America Mobile Accelerator Industry Revenue (Million), by Application 2024 & 2032
- Figure 19: North America Mobile Accelerator Industry Revenue Share (%), by Application 2024 & 2032
- Figure 20: North America Mobile Accelerator Industry Revenue (Million), by Country 2024 & 2032
- Figure 21: North America Mobile Accelerator Industry Revenue Share (%), by Country 2024 & 2032
- Figure 22: Europe Mobile Accelerator Industry Revenue (Million), by Device 2024 & 2032
- Figure 23: Europe Mobile Accelerator Industry Revenue Share (%), by Device 2024 & 2032
- Figure 24: Europe Mobile Accelerator Industry Revenue (Million), by Type 2024 & 2032
- Figure 25: Europe Mobile Accelerator Industry Revenue Share (%), by Type 2024 & 2032
- Figure 26: Europe Mobile Accelerator Industry Revenue (Million), by Application 2024 & 2032
- Figure 27: Europe Mobile Accelerator Industry Revenue Share (%), by Application 2024 & 2032
- Figure 28: Europe Mobile Accelerator Industry Revenue (Million), by Country 2024 & 2032
- Figure 29: Europe Mobile Accelerator Industry Revenue Share (%), by Country 2024 & 2032
- Figure 30: Asia Pacific Mobile Accelerator Industry Revenue (Million), by Device 2024 & 2032
- Figure 31: Asia Pacific Mobile Accelerator Industry Revenue Share (%), by Device 2024 & 2032
- Figure 32: Asia Pacific Mobile Accelerator Industry Revenue (Million), by Type 2024 & 2032
- Figure 33: Asia Pacific Mobile Accelerator Industry Revenue Share (%), by Type 2024 & 2032
- Figure 34: Asia Pacific Mobile Accelerator Industry Revenue (Million), by Application 2024 & 2032
- Figure 35: Asia Pacific Mobile Accelerator Industry Revenue Share (%), by Application 2024 & 2032
- Figure 36: Asia Pacific Mobile Accelerator Industry Revenue (Million), by Country 2024 & 2032
- Figure 37: Asia Pacific Mobile Accelerator Industry Revenue Share (%), by Country 2024 & 2032
- Figure 38: Latin America Mobile Accelerator Industry Revenue (Million), by Device 2024 & 2032
- Figure 39: Latin America Mobile Accelerator Industry Revenue Share (%), by Device 2024 & 2032
- Figure 40: Latin America Mobile Accelerator Industry Revenue (Million), by Type 2024 & 2032
- Figure 41: Latin America Mobile Accelerator Industry Revenue Share (%), by Type 2024 & 2032
- Figure 42: Latin America Mobile Accelerator Industry Revenue (Million), by Application 2024 & 2032
- Figure 43: Latin America Mobile Accelerator Industry Revenue Share (%), by Application 2024 & 2032
- Figure 44: Latin America Mobile Accelerator Industry Revenue (Million), by Country 2024 & 2032
- Figure 45: Latin America Mobile Accelerator Industry Revenue Share (%), by Country 2024 & 2032
- Figure 46: Middle East and Africa Mobile Accelerator Industry Revenue (Million), by Device 2024 & 2032
- Figure 47: Middle East and Africa Mobile Accelerator Industry Revenue Share (%), by Device 2024 & 2032
- Figure 48: Middle East and Africa Mobile Accelerator Industry Revenue (Million), by Type 2024 & 2032
- Figure 49: Middle East and Africa Mobile Accelerator Industry Revenue Share (%), by Type 2024 & 2032
- Figure 50: Middle East and Africa Mobile Accelerator Industry Revenue (Million), by Application 2024 & 2032
- Figure 51: Middle East and Africa Mobile Accelerator Industry Revenue Share (%), by Application 2024 & 2032
- Figure 52: Middle East and Africa Mobile Accelerator Industry Revenue (Million), by Country 2024 & 2032
- Figure 53: Middle East and Africa Mobile Accelerator Industry Revenue Share (%), by Country 2024 & 2032
List of Tables
- Table 1: Global Mobile Accelerator Industry Revenue Million Forecast, by Region 2019 & 2032
- Table 2: Global Mobile Accelerator Industry Revenue Million Forecast, by Device 2019 & 2032
- Table 3: Global Mobile Accelerator Industry Revenue Million Forecast, by Type 2019 & 2032
- Table 4: Global Mobile Accelerator Industry Revenue Million Forecast, by Application 2019 & 2032
- Table 5: Global Mobile Accelerator Industry Revenue Million Forecast, by Region 2019 & 2032
- Table 6: Global Mobile Accelerator Industry Revenue Million Forecast, by Country 2019 & 2032
- Table 7: United States Mobile Accelerator Industry Revenue (Million) Forecast, by Application 2019 & 2032
- Table 8: Canada Mobile Accelerator Industry Revenue (Million) Forecast, by Application 2019 & 2032
- Table 9: Mexico Mobile Accelerator Industry Revenue (Million) Forecast, by Application 2019 & 2032
- Table 10: Global Mobile Accelerator Industry Revenue Million Forecast, by Country 2019 & 2032
- Table 11: Germany Mobile Accelerator Industry Revenue (Million) Forecast, by Application 2019 & 2032
- Table 12: United Kingdom Mobile Accelerator Industry Revenue (Million) Forecast, by Application 2019 & 2032
- Table 13: France Mobile Accelerator Industry Revenue (Million) Forecast, by Application 2019 & 2032
- Table 14: Spain Mobile Accelerator Industry Revenue (Million) Forecast, by Application 2019 & 2032
- Table 15: Italy Mobile Accelerator Industry Revenue (Million) Forecast, by Application 2019 & 2032
- Table 16: Spain Mobile Accelerator Industry Revenue (Million) Forecast, by Application 2019 & 2032
- Table 17: Belgium Mobile Accelerator Industry Revenue (Million) Forecast, by Application 2019 & 2032
- Table 18: Netherland Mobile Accelerator Industry Revenue (Million) Forecast, by Application 2019 & 2032
- Table 19: Nordics Mobile Accelerator Industry Revenue (Million) Forecast, by Application 2019 & 2032
- Table 20: Rest of Europe Mobile Accelerator Industry Revenue (Million) Forecast, by Application 2019 & 2032
- Table 21: Global Mobile Accelerator Industry Revenue Million Forecast, by Country 2019 & 2032
- Table 22: China Mobile Accelerator Industry Revenue (Million) Forecast, by Application 2019 & 2032
- Table 23: Japan Mobile Accelerator Industry Revenue (Million) Forecast, by Application 2019 & 2032
- Table 24: India Mobile Accelerator Industry Revenue (Million) Forecast, by Application 2019 & 2032
- Table 25: South Korea Mobile Accelerator Industry Revenue (Million) Forecast, by Application 2019 & 2032
- Table 26: Southeast Asia Mobile Accelerator Industry Revenue (Million) Forecast, by Application 2019 & 2032
- Table 27: Australia Mobile Accelerator Industry Revenue (Million) Forecast, by Application 2019 & 2032
- Table 28: Indonesia Mobile Accelerator Industry Revenue (Million) Forecast, by Application 2019 & 2032
- Table 29: Phillipes Mobile Accelerator Industry Revenue (Million) Forecast, by Application 2019 & 2032
- Table 30: Singapore Mobile Accelerator Industry Revenue (Million) Forecast, by Application 2019 & 2032
- Table 31: Thailandc Mobile Accelerator Industry Revenue (Million) Forecast, by Application 2019 & 2032
- Table 32: Rest of Asia Pacific Mobile Accelerator Industry Revenue (Million) Forecast, by Application 2019 & 2032
- Table 33: Global Mobile Accelerator Industry Revenue Million Forecast, by Country 2019 & 2032
- Table 34: Brazil Mobile Accelerator Industry Revenue (Million) Forecast, by Application 2019 & 2032
- Table 35: Argentina Mobile Accelerator Industry Revenue (Million) Forecast, by Application 2019 & 2032
- Table 36: Peru Mobile Accelerator Industry Revenue (Million) Forecast, by Application 2019 & 2032
- Table 37: Chile Mobile Accelerator Industry Revenue (Million) Forecast, by Application 2019 & 2032
- Table 38: Colombia Mobile Accelerator Industry Revenue (Million) Forecast, by Application 2019 & 2032
- Table 39: Ecuador Mobile Accelerator Industry Revenue (Million) Forecast, by Application 2019 & 2032
- Table 40: Venezuela Mobile Accelerator Industry Revenue (Million) Forecast, by Application 2019 & 2032
- Table 41: Rest of South America Mobile Accelerator Industry Revenue (Million) Forecast, by Application 2019 & 2032
- Table 42: Global Mobile Accelerator Industry Revenue Million Forecast, by Country 2019 & 2032
- Table 43: United States Mobile Accelerator Industry Revenue (Million) Forecast, by Application 2019 & 2032
- Table 44: Canada Mobile Accelerator Industry Revenue (Million) Forecast, by Application 2019 & 2032
- Table 45: Mexico Mobile Accelerator Industry Revenue (Million) Forecast, by Application 2019 & 2032
- Table 46: Global Mobile Accelerator Industry Revenue Million Forecast, by Country 2019 & 2032
- Table 47: United Arab Emirates Mobile Accelerator Industry Revenue (Million) Forecast, by Application 2019 & 2032
- Table 48: Saudi Arabia Mobile Accelerator Industry Revenue (Million) Forecast, by Application 2019 & 2032
- Table 49: South Africa Mobile Accelerator Industry Revenue (Million) Forecast, by Application 2019 & 2032
- Table 50: Rest of Middle East and Africa Mobile Accelerator Industry Revenue (Million) Forecast, by Application 2019 & 2032
- Table 51: Global Mobile Accelerator Industry Revenue Million Forecast, by Device 2019 & 2032
- Table 52: Global Mobile Accelerator Industry Revenue Million Forecast, by Type 2019 & 2032
- Table 53: Global Mobile Accelerator Industry Revenue Million Forecast, by Application 2019 & 2032
- Table 54: Global Mobile Accelerator Industry Revenue Million Forecast, by Country 2019 & 2032
- Table 55: Global Mobile Accelerator Industry Revenue Million Forecast, by Device 2019 & 2032
- Table 56: Global Mobile Accelerator Industry Revenue Million Forecast, by Type 2019 & 2032
- Table 57: Global Mobile Accelerator Industry Revenue Million Forecast, by Application 2019 & 2032
- Table 58: Global Mobile Accelerator Industry Revenue Million Forecast, by Country 2019 & 2032
- Table 59: Global Mobile Accelerator Industry Revenue Million Forecast, by Device 2019 & 2032
- Table 60: Global Mobile Accelerator Industry Revenue Million Forecast, by Type 2019 & 2032
- Table 61: Global Mobile Accelerator Industry Revenue Million Forecast, by Application 2019 & 2032
- Table 62: Global Mobile Accelerator Industry Revenue Million Forecast, by Country 2019 & 2032
- Table 63: Global Mobile Accelerator Industry Revenue Million Forecast, by Device 2019 & 2032
- Table 64: Global Mobile Accelerator Industry Revenue Million Forecast, by Type 2019 & 2032
- Table 65: Global Mobile Accelerator Industry Revenue Million Forecast, by Application 2019 & 2032
- Table 66: Global Mobile Accelerator Industry Revenue Million Forecast, by Country 2019 & 2032
- Table 67: Global Mobile Accelerator Industry Revenue Million Forecast, by Device 2019 & 2032
- Table 68: Global Mobile Accelerator Industry Revenue Million Forecast, by Type 2019 & 2032
- Table 69: Global Mobile Accelerator Industry Revenue Million Forecast, by Application 2019 & 2032
- Table 70: Global Mobile Accelerator Industry Revenue Million Forecast, by Country 2019 & 2032
Frequently Asked Questions
1. What is the projected Compound Annual Growth Rate (CAGR) of the Mobile Accelerator Industry?
The projected CAGR is approximately 30.24%.
2. Which companies are prominent players in the Mobile Accelerator Industry?
Key companies in the market include Mobidia Technology Inc *List Not Exhaustive, Ascom Holding AG, Akamai Technologies Inc, Telefonaktiebolaget LM Ericsson, Flash Networks Inc, F5 Networks Inc, Juniper Networks Inc, Huawei Technologies Co Ltd, Riverbed Technologies Inc, Rockstart Inc, Qualcomm Inc.
3. What are the main segments of the Mobile Accelerator Industry?
The market segments include Device, Type, Application.
4. Can you provide details about the market size?
The market size is estimated to be USD 7.05 Million as of 2022.
5. What are some drivers contributing to market growth?
Increasing Mobile Traffic and Mobile Marketing Trends.
6. What are the notable trends driving market growth?
Increasing Mobile Traffic and Mobile Marketing Trends is Expected to Drive the Market Growth.
7. Are there any restraints impacting market growth?
Security Challenges as the Data is shared with Third-party Vendors.
8. Can you provide examples of recent developments in the market?
November 2023 - Huawei Technologies Co. Ltd unveiled two new all-flash storage products, the OceanStor Pacific 9920 and OceanStor Dorado 2100, to promote the industry vision of All Flash for All Scenarios. The products have been designed to help customers build more efficient and reliable data centers.
9. What pricing options are available for accessing the report?
Pricing options include single-user, multi-user, and enterprise licenses priced at USD 4750, USD 5250, and USD 8750 respectively.
10. Is the market size provided in terms of value or volume?
The market size is provided in terms of value, measured in Million.
11. Are there any specific market keywords associated with the report?
Yes, the market keyword associated with the report is "Mobile Accelerator Industry," which aids in identifying and referencing the specific market segment covered.
12. How do I determine which pricing option suits my needs best?
The pricing options vary based on user requirements and access needs. Individual users may opt for single-user licenses, while businesses requiring broader access may choose multi-user or enterprise licenses for cost-effective access to the report.
13. Are there any additional resources or data provided in the Mobile Accelerator Industry report?
While the report offers comprehensive insights, it's advisable to review the specific contents or supplementary materials provided to ascertain if additional resources or data are available.
14. How can I stay updated on further developments or reports in the Mobile Accelerator Industry?
To stay informed about further developments, trends, and reports in the Mobile Accelerator Industry, consider subscribing to industry newsletters, following relevant companies and organizations, or regularly checking reputable industry news sources and publications.
Methodology
Step 1 - Identification of Relevant Samples Size from Population Database


Step 2 - Approaches for Defining Global Market Size (Value, Volume* & Price*)

Note*: In applicable scenarios
Step 3 - Data Sources
Primary Research
- Web Analytics
- Survey Reports
- Research Institute
- Latest Research Reports
- Opinion Leaders
Secondary Research
- Annual Reports
- White Paper
- Latest Press Release
- Industry Association
- Paid Database
- Investor Presentations

Step 4 - Data Triangulation
Involves using different sources of information in order to increase the validity of a study
These sources are likely to be stakeholders in a program - participants, other researchers, program staff, other community members, and so on.
Then we put all data in single framework & apply various statistical tools to find out the dynamic on the market.
During the analysis stage, feedback from the stakeholder groups would be compared to determine areas of agreement as well as areas of divergence
