

Key Insights
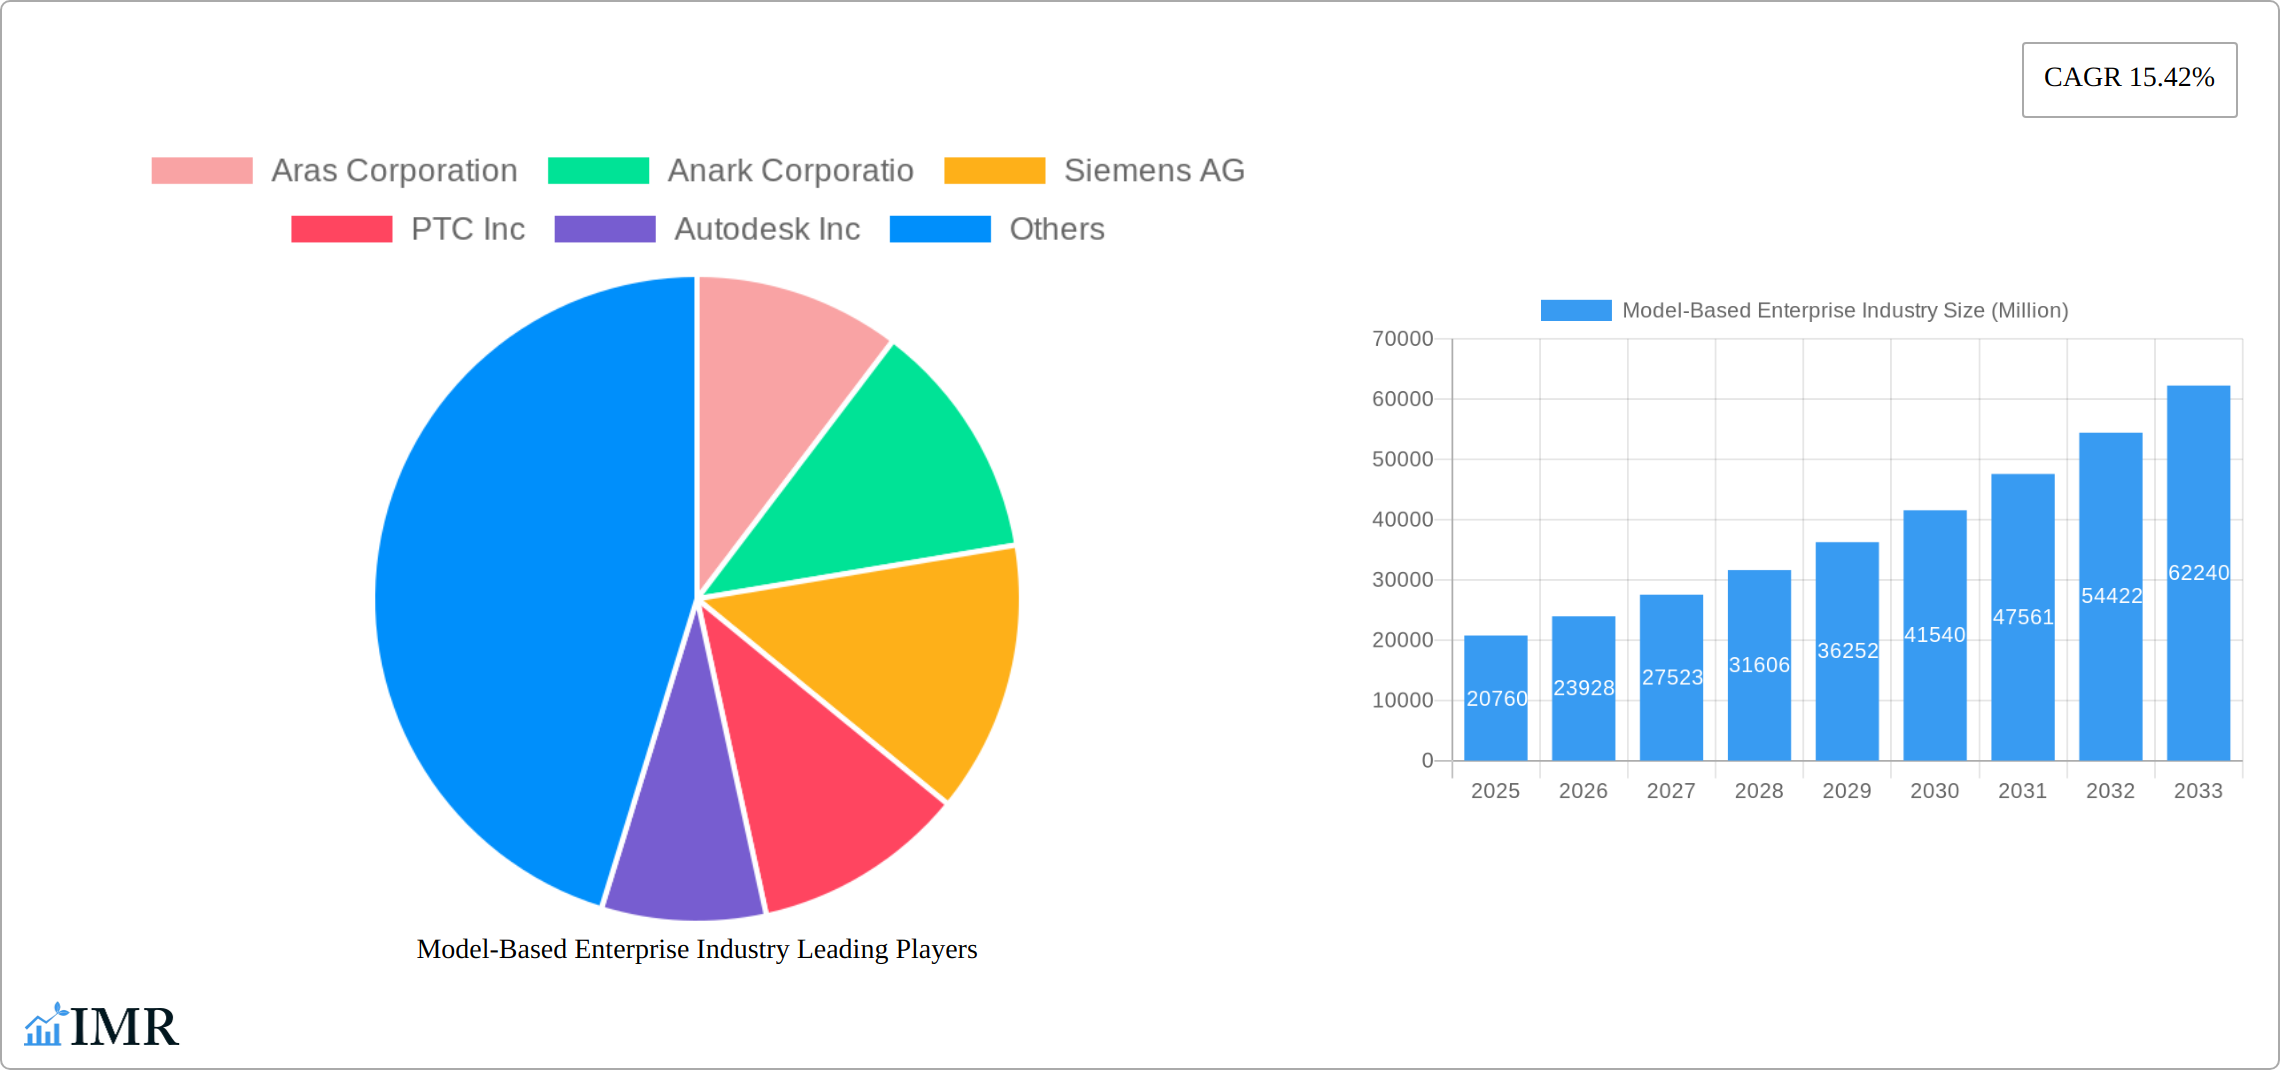
The Model-Based Enterprise (MBE) industry is experiencing robust growth, projected to reach $20.76 billion in 2025 and maintain a Compound Annual Growth Rate (CAGR) of 15.42% from 2025 to 2033. This expansion is fueled by several key drivers. The increasing complexity of products across various sectors, including aerospace and defense, automotive, and construction, necessitates efficient design and manufacturing processes. MBE solutions offer a centralized platform for managing product data throughout the entire lifecycle, streamlining collaboration and reducing errors. Furthermore, the rising adoption of cloud-based MBE solutions enhances accessibility and scalability, contributing significantly to market growth. While initial investment costs can be a restraint for some organizations, the long-term cost savings and improved efficiency outweigh the initial hurdles. The market segmentation reveals a strong demand for both solutions and services, with cloud deployment gaining significant traction over on-premise solutions due to flexibility and cost-effectiveness. North America is expected to hold a significant market share, followed by Europe and Asia Pacific, reflecting the high concentration of technologically advanced industries in these regions.
The competitive landscape is characterized by a mix of established players like Siemens AG, Dassault Systèmes SE, and PTC Inc., alongside emerging technology providers. These companies are continuously innovating to enhance their MBE offerings with advanced features like artificial intelligence and machine learning for improved predictive capabilities and automation. The future growth of the MBE market hinges on continued technological advancements, increased industry adoption, and successful integration with other enterprise systems. The potential for integrating MBE with digital twin technologies and the Internet of Things (IoT) will further drive market expansion, creating opportunities for substantial growth within the next decade. Strong government initiatives promoting digital transformation in various industries also underpin the long-term outlook for the MBE market.
This comprehensive report provides a detailed analysis of the Model-Based Enterprise (MBE) industry, encompassing market dynamics, growth trends, regional insights, competitive landscape, and future outlook. The study period covers 2019-2033, with 2025 as the base year and a forecast period of 2025-2033. The report caters to industry professionals, investors, and strategic decision-makers seeking to understand and capitalize on opportunities within this rapidly evolving sector. The parent market is Software and the child market is Enterprise Software.
Model-Based Enterprise Industry Market Dynamics & Structure
The Model-Based Enterprise (MBE) market, valued at xx million in 2024, is characterized by moderate concentration, with key players like Aras Corporation, Anark Corporation, Siemens AG, PTC Inc, Autodesk Inc, Oracle Corporation, Dassault Systèmes SE, General Electric Company, HCL Technologies Limited, and SAP SE vying for market share. Technological innovation, particularly in areas like AI and digital twins, is a significant driver. Stringent regulatory compliance requirements across various industries also shape market dynamics. The increasing adoption of cloud-based solutions and the rise of digital transformation initiatives are pushing the market forward. The competitive landscape is further influenced by the availability of substitute solutions and the ongoing mergers and acquisitions (M&A) activity. The past five years have witnessed approximately xx M&A deals, indicating consolidation within the sector.
- Market Concentration: Moderately concentrated, with top 5 players holding approximately xx% market share in 2024.
- Technological Innovation: AI, IoT, and digital twin technologies are key innovation drivers.
- Regulatory Frameworks: Compliance requirements (e.g., industry-specific standards) influence adoption rates.
- Competitive Substitutes: Traditional engineering methods and standalone software solutions pose competition.
- End-User Demographics: Growth is driven by large enterprises across diverse industries.
- M&A Trends: Consolidation is evident, with xx M&A deals recorded from 2019-2024.
Model-Based Enterprise Industry Growth Trends & Insights
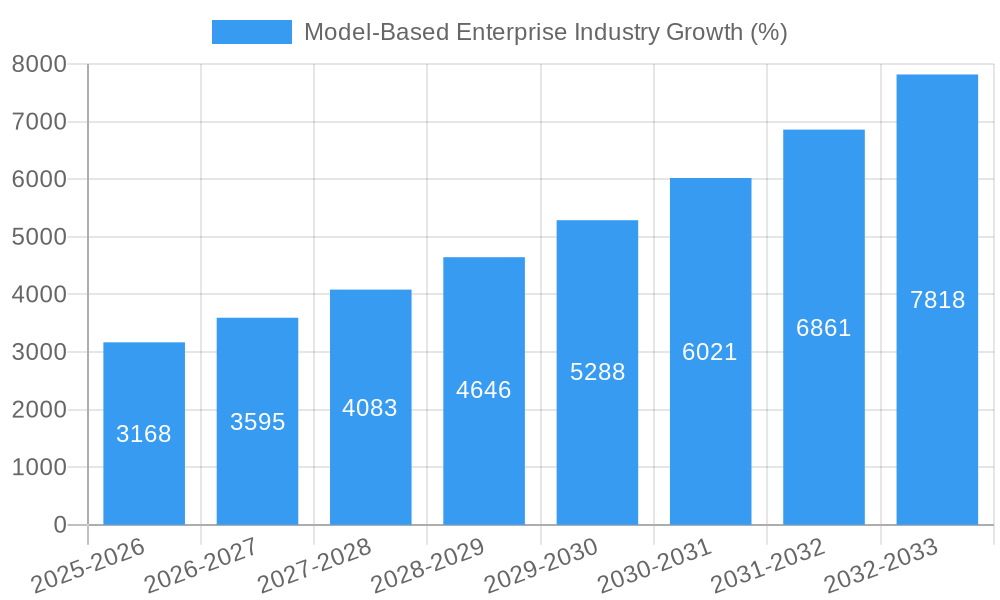
The MBE market has exhibited substantial growth throughout the historical period (2019-2024), experiencing a Compound Annual Growth Rate (CAGR) of xx%. This growth is fueled by the increasing adoption of MBE principles across diverse industries like aerospace & defense, automotive, and manufacturing. The market penetration rate is currently at xx% and is projected to reach xx% by 2033. Technological disruptions, such as the rise of cloud computing and digital twin technologies, are accelerating the adoption of MBE solutions. The shift toward digitalization and the need for improved product development processes are further fueling market expansion. The market size is expected to reach xx million by 2025 and xx million by 2033, driven by increasing demand for efficient product development and lifecycle management.
Dominant Regions, Countries, or Segments in Model-Based Enterprise Industry
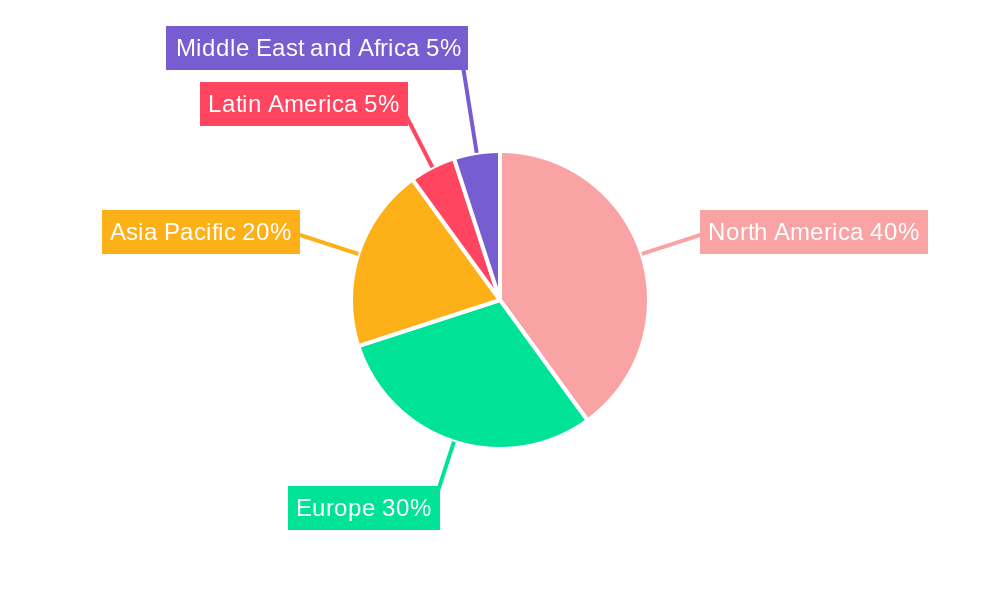
North America currently holds the largest market share in the MBE industry, driven by high technological advancements, substantial investments in R&D, and the presence of major industry players. Europe is another significant region, characterized by robust regulatory frameworks and a strong focus on industrial efficiency.
By Offering: The solutions segment dominates the market, accounting for xx% of the market revenue in 2024.
By Deployment Mode: The cloud-based deployment model is rapidly gaining traction, exhibiting higher growth compared to on-premise solutions due to its scalability and cost-effectiveness.
By End User: The Aerospace & Defense sector represents a significant portion of the market due to stringent safety and regulatory requirements that necessitate advanced modeling and simulation techniques. The Automotive sector is also a major contributor, driven by the need for efficient vehicle design and development processes.
- North America: High adoption rates driven by technological advancements and a strong presence of major players.
- Europe: Significant market size due to a focus on industrial efficiency and regulatory frameworks.
- Asia-Pacific: Rapid growth potential fueled by increasing industrialization and government initiatives.
- Solutions: Higher market share due to the extensive capabilities offered.
- Cloud Deployment: Fastest growth segment due to scalability and cost-effectiveness.
- Aerospace & Defense: Significant market share driven by safety and regulatory requirements.
Model-Based Enterprise Industry Product Landscape
MBE solutions encompass a range of software and services, including CAD/CAM software, PLM systems, and simulation tools. Recent innovations focus on enhancing interoperability, improving data management capabilities, and integrating advanced technologies such as AI and digital twins. These innovations aim to streamline product development processes, optimize manufacturing workflows, and improve overall product quality and efficiency. Key selling propositions include reduced development time, improved collaboration, enhanced product quality, and optimized lifecycle management. Technological advancements involve integrating AI for predictive analytics, incorporating AR/VR for immersive design reviews, and leveraging cloud platforms for seamless data access.
Key Drivers, Barriers & Challenges in Model-Based Enterprise Industry
Key Drivers:
- Increasing demand for efficient product development and lifecycle management.
- Growing adoption of digital twin technologies.
- Rise of cloud-based MBE solutions.
- Government initiatives promoting digitalization in various industries.
Key Barriers & Challenges:
- High initial investment costs.
- Complexity of implementation and integration.
- Lack of skilled workforce.
- Interoperability issues between different software systems. This impacts efficiency by approximately xx%.
- Data security and privacy concerns.
Emerging Opportunities in Model-Based Enterprise Industry
Emerging opportunities lie in untapped markets like the construction and retail sectors, which are beginning to adopt MBE practices. Innovative applications are emerging in areas such as sustainable product design and predictive maintenance. The growing demand for customized solutions and the increasing adoption of MBE in the Internet of Things (IoT) environment present further opportunities.
Growth Accelerators in the Model-Based Enterprise Industry Industry
Long-term growth will be driven by technological advancements, strategic partnerships between software vendors and industry players, and market expansion strategies targeting emerging industries and geographic regions. The increasing adoption of digitalization across various sectors will fuel the growth, and the integration of MBE with other technologies, such as AI, will further accelerate market expansion.
Key Players Shaping the Model-Based Enterprise Industry Market
- Aras Corporation
- Anark Corporation
- Siemens AG
- PTC Inc
- Autodesk Inc
- Oracle Corporation
- Dassault Systèmes SE
- General Electric Company
- HCL Technologies Limited
- SAP SE
Notable Milestones in Model-Based Enterprise Industry Sector
- September 2023: Tech Soft 3D launched iBase-t, integrating HOOPS Exchange for simplified product development and maintenance.
- May 2023: Agacad acquired SBS Group, expanding its BIM solutions with time and cost management tools.
In-Depth Model-Based Enterprise Industry Market Outlook
The MBE market is poised for continued growth, driven by increasing digitalization and the demand for efficient product development. Strategic opportunities lie in developing innovative solutions that address emerging industry needs and leveraging strategic partnerships to expand market reach. The focus on integrating advanced technologies, such as AI and IoT, will further drive market expansion and create new avenues for growth. The long-term outlook remains positive, with substantial growth potential across various sectors and geographical regions.
Model-Based Enterprise Industry Segmentation
-
1. Offering
- 1.1. Solutions
- 1.2. Services
-
2. Deployment Mode
- 2.1. On-premise
- 2.2. Cloud
-
3. End User
- 3.1. Aerospace and Defense
- 3.2. Automotive
- 3.3. Construction
- 3.4. Power and Energy
- 3.5. Retail
- 3.6. Other End Users
Model-Based Enterprise Industry Segmentation By Geography
- 1. North America
- 2. Europe
- 3. Asia Pacific
- 4. Latin America
- 5. Middle East and Africa
Model-Based Enterprise Industry REPORT HIGHLIGHTS
| Aspects | Details |
|---|---|
| Study Period | 2019-2033 |
| Base Year | 2024 |
| Estimated Year | 2025 |
| Forecast Period | 2025-2033 |
| Historical Period | 2019-2024 |
| Growth Rate | CAGR of 15.42% from 2019-2033 |
| Segmentation |
|
Table of Contents
- 1. Introduction
- 1.1. Research Scope
- 1.2. Market Segmentation
- 1.3. Research Methodology
- 1.4. Definitions and Assumptions
- 2. Executive Summary
- 2.1. Introduction
- 3. Market Dynamics
- 3.1. Introduction
- 3.2. Market Drivers
- 3.2.1. Evolving Software Capabilities; Rising Adoption of IoT and Cloud-based Platforms
- 3.3. Market Restrains
- 3.3.1 Shortage of Skilled Workers
- 3.3.2 Data Security Concerns
- 3.3.3 and the Initial Investment Costs Hinder Business Operations
- 3.4. Market Trends
- 3.4.1. Automotive Sector to Witness Major Growth
- 4. Market Factor Analysis
- 4.1. Porters Five Forces
- 4.2. Supply/Value Chain
- 4.3. PESTEL analysis
- 4.4. Market Entropy
- 4.5. Patent/Trademark Analysis
- 5. Global Model-Based Enterprise Industry Analysis, Insights and Forecast, 2019-2031
- 5.1. Market Analysis, Insights and Forecast - by Offering
- 5.1.1. Solutions
- 5.1.2. Services
- 5.2. Market Analysis, Insights and Forecast - by Deployment Mode
- 5.2.1. On-premise
- 5.2.2. Cloud
- 5.3. Market Analysis, Insights and Forecast - by End User
- 5.3.1. Aerospace and Defense
- 5.3.2. Automotive
- 5.3.3. Construction
- 5.3.4. Power and Energy
- 5.3.5. Retail
- 5.3.6. Other End Users
- 5.4. Market Analysis, Insights and Forecast - by Region
- 5.4.1. North America
- 5.4.2. Europe
- 5.4.3. Asia Pacific
- 5.4.4. Latin America
- 5.4.5. Middle East and Africa
- 5.1. Market Analysis, Insights and Forecast - by Offering
- 6. North America Model-Based Enterprise Industry Analysis, Insights and Forecast, 2019-2031
- 6.1. Market Analysis, Insights and Forecast - by Offering
- 6.1.1. Solutions
- 6.1.2. Services
- 6.2. Market Analysis, Insights and Forecast - by Deployment Mode
- 6.2.1. On-premise
- 6.2.2. Cloud
- 6.3. Market Analysis, Insights and Forecast - by End User
- 6.3.1. Aerospace and Defense
- 6.3.2. Automotive
- 6.3.3. Construction
- 6.3.4. Power and Energy
- 6.3.5. Retail
- 6.3.6. Other End Users
- 6.1. Market Analysis, Insights and Forecast - by Offering
- 7. Europe Model-Based Enterprise Industry Analysis, Insights and Forecast, 2019-2031
- 7.1. Market Analysis, Insights and Forecast - by Offering
- 7.1.1. Solutions
- 7.1.2. Services
- 7.2. Market Analysis, Insights and Forecast - by Deployment Mode
- 7.2.1. On-premise
- 7.2.2. Cloud
- 7.3. Market Analysis, Insights and Forecast - by End User
- 7.3.1. Aerospace and Defense
- 7.3.2. Automotive
- 7.3.3. Construction
- 7.3.4. Power and Energy
- 7.3.5. Retail
- 7.3.6. Other End Users
- 7.1. Market Analysis, Insights and Forecast - by Offering
- 8. Asia Pacific Model-Based Enterprise Industry Analysis, Insights and Forecast, 2019-2031
- 8.1. Market Analysis, Insights and Forecast - by Offering
- 8.1.1. Solutions
- 8.1.2. Services
- 8.2. Market Analysis, Insights and Forecast - by Deployment Mode
- 8.2.1. On-premise
- 8.2.2. Cloud
- 8.3. Market Analysis, Insights and Forecast - by End User
- 8.3.1. Aerospace and Defense
- 8.3.2. Automotive
- 8.3.3. Construction
- 8.3.4. Power and Energy
- 8.3.5. Retail
- 8.3.6. Other End Users
- 8.1. Market Analysis, Insights and Forecast - by Offering
- 9. Latin America Model-Based Enterprise Industry Analysis, Insights and Forecast, 2019-2031
- 9.1. Market Analysis, Insights and Forecast - by Offering
- 9.1.1. Solutions
- 9.1.2. Services
- 9.2. Market Analysis, Insights and Forecast - by Deployment Mode
- 9.2.1. On-premise
- 9.2.2. Cloud
- 9.3. Market Analysis, Insights and Forecast - by End User
- 9.3.1. Aerospace and Defense
- 9.3.2. Automotive
- 9.3.3. Construction
- 9.3.4. Power and Energy
- 9.3.5. Retail
- 9.3.6. Other End Users
- 9.1. Market Analysis, Insights and Forecast - by Offering
- 10. Middle East and Africa Model-Based Enterprise Industry Analysis, Insights and Forecast, 2019-2031
- 10.1. Market Analysis, Insights and Forecast - by Offering
- 10.1.1. Solutions
- 10.1.2. Services
- 10.2. Market Analysis, Insights and Forecast - by Deployment Mode
- 10.2.1. On-premise
- 10.2.2. Cloud
- 10.3. Market Analysis, Insights and Forecast - by End User
- 10.3.1. Aerospace and Defense
- 10.3.2. Automotive
- 10.3.3. Construction
- 10.3.4. Power and Energy
- 10.3.5. Retail
- 10.3.6. Other End Users
- 10.1. Market Analysis, Insights and Forecast - by Offering
- 11. North America Model-Based Enterprise Industry Analysis, Insights and Forecast, 2019-2031
- 11.1. Market Analysis, Insights and Forecast - By Country/Sub-region
- 11.1.1.
- 12. Europe Model-Based Enterprise Industry Analysis, Insights and Forecast, 2019-2031
- 12.1. Market Analysis, Insights and Forecast - By Country/Sub-region
- 12.1.1.
- 13. Asia Pacific Model-Based Enterprise Industry Analysis, Insights and Forecast, 2019-2031
- 13.1. Market Analysis, Insights and Forecast - By Country/Sub-region
- 13.1.1.
- 14. Latin America Model-Based Enterprise Industry Analysis, Insights and Forecast, 2019-2031
- 14.1. Market Analysis, Insights and Forecast - By Country/Sub-region
- 14.1.1.
- 15. Middle East and Africa Model-Based Enterprise Industry Analysis, Insights and Forecast, 2019-2031
- 15.1. Market Analysis, Insights and Forecast - By Country/Sub-region
- 15.1.1.
- 16. Competitive Analysis
- 16.1. Global Market Share Analysis 2024
- 16.2. Company Profiles
- 16.2.1 Aras Corporation
- 16.2.1.1. Overview
- 16.2.1.2. Products
- 16.2.1.3. SWOT Analysis
- 16.2.1.4. Recent Developments
- 16.2.1.5. Financials (Based on Availability)
- 16.2.2 Anark Corporatio
- 16.2.2.1. Overview
- 16.2.2.2. Products
- 16.2.2.3. SWOT Analysis
- 16.2.2.4. Recent Developments
- 16.2.2.5. Financials (Based on Availability)
- 16.2.3 Siemens AG
- 16.2.3.1. Overview
- 16.2.3.2. Products
- 16.2.3.3. SWOT Analysis
- 16.2.3.4. Recent Developments
- 16.2.3.5. Financials (Based on Availability)
- 16.2.4 PTC Inc
- 16.2.4.1. Overview
- 16.2.4.2. Products
- 16.2.4.3. SWOT Analysis
- 16.2.4.4. Recent Developments
- 16.2.4.5. Financials (Based on Availability)
- 16.2.5 Autodesk Inc
- 16.2.5.1. Overview
- 16.2.5.2. Products
- 16.2.5.3. SWOT Analysis
- 16.2.5.4. Recent Developments
- 16.2.5.5. Financials (Based on Availability)
- 16.2.6 Oracle Corporation
- 16.2.6.1. Overview
- 16.2.6.2. Products
- 16.2.6.3. SWOT Analysis
- 16.2.6.4. Recent Developments
- 16.2.6.5. Financials (Based on Availability)
- 16.2.7 Dassault Systèmes SE
- 16.2.7.1. Overview
- 16.2.7.2. Products
- 16.2.7.3. SWOT Analysis
- 16.2.7.4. Recent Developments
- 16.2.7.5. Financials (Based on Availability)
- 16.2.8 General Electric Company
- 16.2.8.1. Overview
- 16.2.8.2. Products
- 16.2.8.3. SWOT Analysis
- 16.2.8.4. Recent Developments
- 16.2.8.5. Financials (Based on Availability)
- 16.2.9 HCL Technologies Limited
- 16.2.9.1. Overview
- 16.2.9.2. Products
- 16.2.9.3. SWOT Analysis
- 16.2.9.4. Recent Developments
- 16.2.9.5. Financials (Based on Availability)
- 16.2.10 SAP SE
- 16.2.10.1. Overview
- 16.2.10.2. Products
- 16.2.10.3. SWOT Analysis
- 16.2.10.4. Recent Developments
- 16.2.10.5. Financials (Based on Availability)
- 16.2.1 Aras Corporation
List of Figures
- Figure 1: Global Model-Based Enterprise Industry Revenue Breakdown (Million, %) by Region 2024 & 2032
- Figure 2: North America Model-Based Enterprise Industry Revenue (Million), by Country 2024 & 2032
- Figure 3: North America Model-Based Enterprise Industry Revenue Share (%), by Country 2024 & 2032
- Figure 4: Europe Model-Based Enterprise Industry Revenue (Million), by Country 2024 & 2032
- Figure 5: Europe Model-Based Enterprise Industry Revenue Share (%), by Country 2024 & 2032
- Figure 6: Asia Pacific Model-Based Enterprise Industry Revenue (Million), by Country 2024 & 2032
- Figure 7: Asia Pacific Model-Based Enterprise Industry Revenue Share (%), by Country 2024 & 2032
- Figure 8: Latin America Model-Based Enterprise Industry Revenue (Million), by Country 2024 & 2032
- Figure 9: Latin America Model-Based Enterprise Industry Revenue Share (%), by Country 2024 & 2032
- Figure 10: Middle East and Africa Model-Based Enterprise Industry Revenue (Million), by Country 2024 & 2032
- Figure 11: Middle East and Africa Model-Based Enterprise Industry Revenue Share (%), by Country 2024 & 2032
- Figure 12: North America Model-Based Enterprise Industry Revenue (Million), by Offering 2024 & 2032
- Figure 13: North America Model-Based Enterprise Industry Revenue Share (%), by Offering 2024 & 2032
- Figure 14: North America Model-Based Enterprise Industry Revenue (Million), by Deployment Mode 2024 & 2032
- Figure 15: North America Model-Based Enterprise Industry Revenue Share (%), by Deployment Mode 2024 & 2032
- Figure 16: North America Model-Based Enterprise Industry Revenue (Million), by End User 2024 & 2032
- Figure 17: North America Model-Based Enterprise Industry Revenue Share (%), by End User 2024 & 2032
- Figure 18: North America Model-Based Enterprise Industry Revenue (Million), by Country 2024 & 2032
- Figure 19: North America Model-Based Enterprise Industry Revenue Share (%), by Country 2024 & 2032
- Figure 20: Europe Model-Based Enterprise Industry Revenue (Million), by Offering 2024 & 2032
- Figure 21: Europe Model-Based Enterprise Industry Revenue Share (%), by Offering 2024 & 2032
- Figure 22: Europe Model-Based Enterprise Industry Revenue (Million), by Deployment Mode 2024 & 2032
- Figure 23: Europe Model-Based Enterprise Industry Revenue Share (%), by Deployment Mode 2024 & 2032
- Figure 24: Europe Model-Based Enterprise Industry Revenue (Million), by End User 2024 & 2032
- Figure 25: Europe Model-Based Enterprise Industry Revenue Share (%), by End User 2024 & 2032
- Figure 26: Europe Model-Based Enterprise Industry Revenue (Million), by Country 2024 & 2032
- Figure 27: Europe Model-Based Enterprise Industry Revenue Share (%), by Country 2024 & 2032
- Figure 28: Asia Pacific Model-Based Enterprise Industry Revenue (Million), by Offering 2024 & 2032
- Figure 29: Asia Pacific Model-Based Enterprise Industry Revenue Share (%), by Offering 2024 & 2032
- Figure 30: Asia Pacific Model-Based Enterprise Industry Revenue (Million), by Deployment Mode 2024 & 2032
- Figure 31: Asia Pacific Model-Based Enterprise Industry Revenue Share (%), by Deployment Mode 2024 & 2032
- Figure 32: Asia Pacific Model-Based Enterprise Industry Revenue (Million), by End User 2024 & 2032
- Figure 33: Asia Pacific Model-Based Enterprise Industry Revenue Share (%), by End User 2024 & 2032
- Figure 34: Asia Pacific Model-Based Enterprise Industry Revenue (Million), by Country 2024 & 2032
- Figure 35: Asia Pacific Model-Based Enterprise Industry Revenue Share (%), by Country 2024 & 2032
- Figure 36: Latin America Model-Based Enterprise Industry Revenue (Million), by Offering 2024 & 2032
- Figure 37: Latin America Model-Based Enterprise Industry Revenue Share (%), by Offering 2024 & 2032
- Figure 38: Latin America Model-Based Enterprise Industry Revenue (Million), by Deployment Mode 2024 & 2032
- Figure 39: Latin America Model-Based Enterprise Industry Revenue Share (%), by Deployment Mode 2024 & 2032
- Figure 40: Latin America Model-Based Enterprise Industry Revenue (Million), by End User 2024 & 2032
- Figure 41: Latin America Model-Based Enterprise Industry Revenue Share (%), by End User 2024 & 2032
- Figure 42: Latin America Model-Based Enterprise Industry Revenue (Million), by Country 2024 & 2032
- Figure 43: Latin America Model-Based Enterprise Industry Revenue Share (%), by Country 2024 & 2032
- Figure 44: Middle East and Africa Model-Based Enterprise Industry Revenue (Million), by Offering 2024 & 2032
- Figure 45: Middle East and Africa Model-Based Enterprise Industry Revenue Share (%), by Offering 2024 & 2032
- Figure 46: Middle East and Africa Model-Based Enterprise Industry Revenue (Million), by Deployment Mode 2024 & 2032
- Figure 47: Middle East and Africa Model-Based Enterprise Industry Revenue Share (%), by Deployment Mode 2024 & 2032
- Figure 48: Middle East and Africa Model-Based Enterprise Industry Revenue (Million), by End User 2024 & 2032
- Figure 49: Middle East and Africa Model-Based Enterprise Industry Revenue Share (%), by End User 2024 & 2032
- Figure 50: Middle East and Africa Model-Based Enterprise Industry Revenue (Million), by Country 2024 & 2032
- Figure 51: Middle East and Africa Model-Based Enterprise Industry Revenue Share (%), by Country 2024 & 2032
List of Tables
- Table 1: Global Model-Based Enterprise Industry Revenue Million Forecast, by Region 2019 & 2032
- Table 2: Global Model-Based Enterprise Industry Revenue Million Forecast, by Offering 2019 & 2032
- Table 3: Global Model-Based Enterprise Industry Revenue Million Forecast, by Deployment Mode 2019 & 2032
- Table 4: Global Model-Based Enterprise Industry Revenue Million Forecast, by End User 2019 & 2032
- Table 5: Global Model-Based Enterprise Industry Revenue Million Forecast, by Region 2019 & 2032
- Table 6: Global Model-Based Enterprise Industry Revenue Million Forecast, by Country 2019 & 2032
- Table 7: Model-Based Enterprise Industry Revenue (Million) Forecast, by Application 2019 & 2032
- Table 8: Global Model-Based Enterprise Industry Revenue Million Forecast, by Country 2019 & 2032
- Table 9: Model-Based Enterprise Industry Revenue (Million) Forecast, by Application 2019 & 2032
- Table 10: Global Model-Based Enterprise Industry Revenue Million Forecast, by Country 2019 & 2032
- Table 11: Model-Based Enterprise Industry Revenue (Million) Forecast, by Application 2019 & 2032
- Table 12: Global Model-Based Enterprise Industry Revenue Million Forecast, by Country 2019 & 2032
- Table 13: Model-Based Enterprise Industry Revenue (Million) Forecast, by Application 2019 & 2032
- Table 14: Global Model-Based Enterprise Industry Revenue Million Forecast, by Country 2019 & 2032
- Table 15: Model-Based Enterprise Industry Revenue (Million) Forecast, by Application 2019 & 2032
- Table 16: Global Model-Based Enterprise Industry Revenue Million Forecast, by Offering 2019 & 2032
- Table 17: Global Model-Based Enterprise Industry Revenue Million Forecast, by Deployment Mode 2019 & 2032
- Table 18: Global Model-Based Enterprise Industry Revenue Million Forecast, by End User 2019 & 2032
- Table 19: Global Model-Based Enterprise Industry Revenue Million Forecast, by Country 2019 & 2032
- Table 20: Global Model-Based Enterprise Industry Revenue Million Forecast, by Offering 2019 & 2032
- Table 21: Global Model-Based Enterprise Industry Revenue Million Forecast, by Deployment Mode 2019 & 2032
- Table 22: Global Model-Based Enterprise Industry Revenue Million Forecast, by End User 2019 & 2032
- Table 23: Global Model-Based Enterprise Industry Revenue Million Forecast, by Country 2019 & 2032
- Table 24: Global Model-Based Enterprise Industry Revenue Million Forecast, by Offering 2019 & 2032
- Table 25: Global Model-Based Enterprise Industry Revenue Million Forecast, by Deployment Mode 2019 & 2032
- Table 26: Global Model-Based Enterprise Industry Revenue Million Forecast, by End User 2019 & 2032
- Table 27: Global Model-Based Enterprise Industry Revenue Million Forecast, by Country 2019 & 2032
- Table 28: Global Model-Based Enterprise Industry Revenue Million Forecast, by Offering 2019 & 2032
- Table 29: Global Model-Based Enterprise Industry Revenue Million Forecast, by Deployment Mode 2019 & 2032
- Table 30: Global Model-Based Enterprise Industry Revenue Million Forecast, by End User 2019 & 2032
- Table 31: Global Model-Based Enterprise Industry Revenue Million Forecast, by Country 2019 & 2032
- Table 32: Global Model-Based Enterprise Industry Revenue Million Forecast, by Offering 2019 & 2032
- Table 33: Global Model-Based Enterprise Industry Revenue Million Forecast, by Deployment Mode 2019 & 2032
- Table 34: Global Model-Based Enterprise Industry Revenue Million Forecast, by End User 2019 & 2032
- Table 35: Global Model-Based Enterprise Industry Revenue Million Forecast, by Country 2019 & 2032
Frequently Asked Questions
1. What is the projected Compound Annual Growth Rate (CAGR) of the Model-Based Enterprise Industry?
The projected CAGR is approximately 15.42%.
2. Which companies are prominent players in the Model-Based Enterprise Industry?
Key companies in the market include Aras Corporation, Anark Corporatio, Siemens AG, PTC Inc, Autodesk Inc, Oracle Corporation, Dassault Systèmes SE, General Electric Company, HCL Technologies Limited, SAP SE.
3. What are the main segments of the Model-Based Enterprise Industry?
The market segments include Offering, Deployment Mode, End User.
4. Can you provide details about the market size?
The market size is estimated to be USD 20.76 Million as of 2022.
5. What are some drivers contributing to market growth?
Evolving Software Capabilities; Rising Adoption of IoT and Cloud-based Platforms.
6. What are the notable trends driving market growth?
Automotive Sector to Witness Major Growth.
7. Are there any restraints impacting market growth?
Shortage of Skilled Workers. Data Security Concerns. and the Initial Investment Costs Hinder Business Operations.
8. Can you provide examples of recent developments in the market?
September 2023 - Tech Soft 3D, the provider of engineering software development toolkits, introduced iBase-t, which assists its users in simplifying how complex products are built and maintained. It integrated HOOPS Exchange, the CAD import and export library, into iBase-t's Solumina iSeries Manufacturing Operations Platform.
9. What pricing options are available for accessing the report?
Pricing options include single-user, multi-user, and enterprise licenses priced at USD 4750, USD 5250, and USD 8750 respectively.
10. Is the market size provided in terms of value or volume?
The market size is provided in terms of value, measured in Million.
11. Are there any specific market keywords associated with the report?
Yes, the market keyword associated with the report is "Model-Based Enterprise Industry," which aids in identifying and referencing the specific market segment covered.
12. How do I determine which pricing option suits my needs best?
The pricing options vary based on user requirements and access needs. Individual users may opt for single-user licenses, while businesses requiring broader access may choose multi-user or enterprise licenses for cost-effective access to the report.
13. Are there any additional resources or data provided in the Model-Based Enterprise Industry report?
While the report offers comprehensive insights, it's advisable to review the specific contents or supplementary materials provided to ascertain if additional resources or data are available.
14. How can I stay updated on further developments or reports in the Model-Based Enterprise Industry?
To stay informed about further developments, trends, and reports in the Model-Based Enterprise Industry, consider subscribing to industry newsletters, following relevant companies and organizations, or regularly checking reputable industry news sources and publications.
Methodology
Step 1 - Identification of Relevant Samples Size from Population Database


Step 2 - Approaches for Defining Global Market Size (Value, Volume* & Price*)

Note*: In applicable scenarios
Step 3 - Data Sources
Primary Research
- Web Analytics
- Survey Reports
- Research Institute
- Latest Research Reports
- Opinion Leaders
Secondary Research
- Annual Reports
- White Paper
- Latest Press Release
- Industry Association
- Paid Database
- Investor Presentations

Step 4 - Data Triangulation
Involves using different sources of information in order to increase the validity of a study
These sources are likely to be stakeholders in a program - participants, other researchers, program staff, other community members, and so on.
Then we put all data in single framework & apply various statistical tools to find out the dynamic on the market.
During the analysis stage, feedback from the stakeholder groups would be compared to determine areas of agreement as well as areas of divergence
