

Key Insights
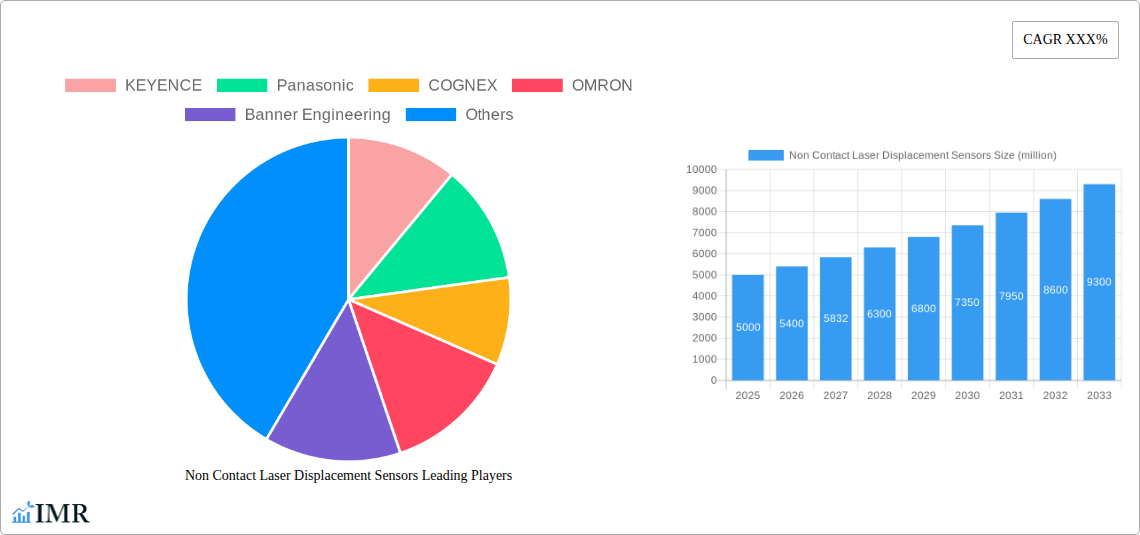
The non-contact laser displacement sensor market is experiencing robust growth, driven by increasing automation across diverse industries and a rising demand for precise and reliable measurement solutions. The market, estimated at $5 billion in 2025, is projected to expand significantly over the forecast period (2025-2033), with a compound annual growth rate (CAGR) of approximately 8%. Key drivers include the escalating adoption of Industry 4.0 technologies, the need for enhanced quality control and process optimization, and the growing prevalence of advanced manufacturing techniques in sectors like automotive, electronics, and semiconductor manufacturing. Furthermore, continuous advancements in sensor technology, leading to improved accuracy, speed, and reliability, are fueling market expansion. The market is segmented by sensor type (e.g., triangulation, confocal), application (e.g., dimensional measurement, surface profile analysis), and industry. Leading players like Keyence, Panasonic, and Cognex are investing heavily in research and development to maintain their competitive edge, offering innovative solutions to meet evolving customer demands.
The market's growth is not without challenges. High initial investment costs associated with implementing these advanced sensor systems can act as a restraint, particularly for small and medium-sized enterprises. Furthermore, potential disruptions from emerging technologies and the need for skilled personnel to operate and maintain these complex systems pose additional hurdles. However, the long-term benefits in terms of improved efficiency, reduced production costs, and enhanced product quality are expected to outweigh these challenges, driving sustained market growth throughout the forecast period. Regional variations exist, with North America and Europe currently dominating the market share due to established industrial bases and technological advancements. However, rapidly developing economies in Asia-Pacific are projected to witness significant growth in the coming years, fuelled by increasing industrialization and infrastructure development.
Non-Contact Laser Displacement Sensors Market Report: 2019-2033
This comprehensive report provides an in-depth analysis of the Non-Contact Laser Displacement Sensors market, encompassing market dynamics, growth trends, regional analysis, product landscape, key players, and future outlook. The study covers the period 2019-2033, with a focus on the forecast period 2025-2033 and a base year of 2025. The parent market is industrial automation, while child markets include automotive, electronics, and packaging. The global market size is estimated at xx million units in 2025, and is projected to reach xx million units by 2033.
Non-Contact Laser Displacement Sensors Market Dynamics & Structure
This section analyzes the competitive landscape, technological advancements, regulatory influences, and market trends within the non-contact laser displacement sensor industry. The market is moderately concentrated, with KEYENCE, Panasonic, and Cognex holding significant market share (combined xx%). However, smaller players like Micro-Epsilon and Baumer are also making significant inroads.
- Market Concentration: Highly concentrated, with top 5 players holding approximately xx% market share in 2025.
- Technological Innovation: Continuous advancements in laser technology, miniaturization, and improved accuracy are key drivers. Innovation barriers include high R&D costs and stringent regulatory compliance.
- Regulatory Frameworks: Safety regulations (e.g., laser safety standards) and environmental regulations (e.g., RoHS compliance) influence sensor design and manufacturing.
- Competitive Substitutes: Contact measurement techniques (e.g., linear encoders) pose competition, but non-contact sensors offer superior advantages in speed and precision.
- End-User Demographics: Automotive, electronics, packaging, and metalworking industries are the major end-users, with automotive dominating. Growing automation across these industries fuels market growth.
- M&A Trends: Consolidation is expected to continue, with larger players acquiring smaller companies to expand their product portfolios and geographical reach. Approximately xx M&A deals were recorded in the historical period (2019-2024).
Non-Contact Laser Displacement Sensors Growth Trends & Insights
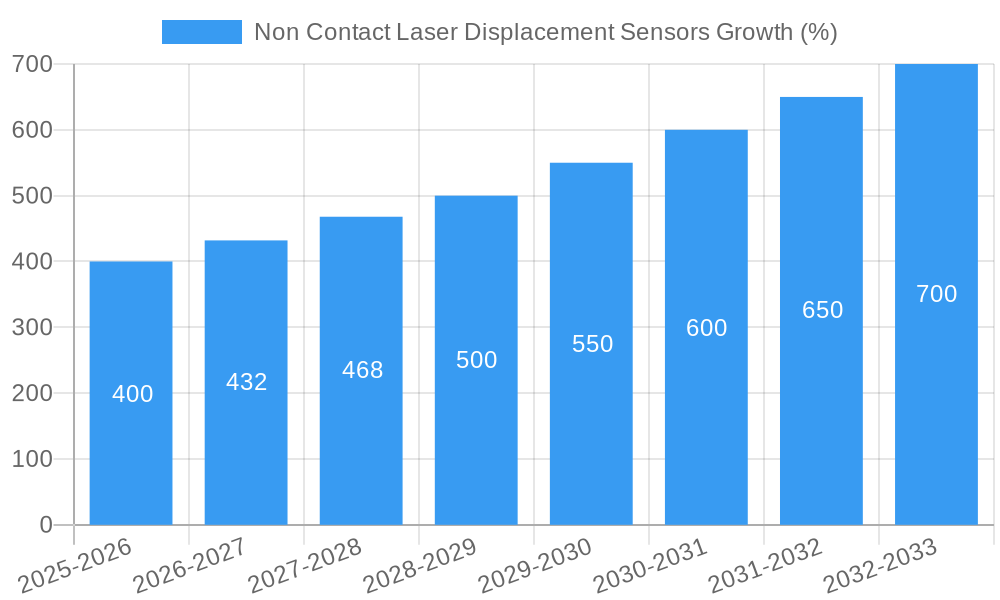
The non-contact laser displacement sensor market has experienced significant growth over the historical period (2019-2024), driven by increasing automation across various industries. The market exhibited a CAGR of xx% during this period and is projected to maintain a CAGR of xx% from 2025 to 2033. This growth is fueled by factors such as rising demand for high-precision measurement, increased adoption of automation in manufacturing processes, and the development of advanced sensor technologies. Market penetration in key industries is expected to increase significantly during the forecast period. Technological disruptions, such as the development of more compact and cost-effective sensors, are further driving adoption. Consumer behavior shifts towards greater automation are impacting the market's trajectory.
Dominant Regions, Countries, or Segments in Non-Contact Laser Displacement Sensors
The North American and European regions currently hold the largest market share in terms of both consumption and manufacturing. However, the Asia-Pacific region is experiencing the fastest growth, driven by rapid industrialization and expanding manufacturing sectors in countries like China, Japan, and South Korea.
- Key Drivers:
- North America & Europe: Established industrial base, high adoption rates, and stringent quality standards.
- Asia-Pacific: Rapid industrialization, expanding manufacturing base, and government initiatives promoting automation.
- Dominance Factors: Strong industrial base, robust technological capabilities, and high demand for advanced manufacturing solutions contribute to the dominance of the North American and European markets.
Non-Contact Laser Displacement Sensors Product Landscape
Non-contact laser displacement sensors offer a range of functionalities including distance measurement, vibration detection, and surface profiling. Technological advancements are focused on improving accuracy, speed, and measurement range. Unique selling propositions include non-contact operation, high precision, and versatility across various applications. Miniaturization and the integration of advanced signal processing capabilities are also key trends.
Key Drivers, Barriers & Challenges in Non-Contact Laser Displacement Sensors
Key Drivers: Increasing demand for automation in manufacturing, growing need for high-precision measurements, and the development of more cost-effective and reliable sensors are key drivers. Government initiatives promoting industrial automation in various regions also contribute to growth.
Key Challenges: High initial investment costs, potential for interference from environmental factors (e.g., dust, vibration), and the need for skilled technicians for installation and maintenance present challenges. Supply chain disruptions can also impact availability and pricing. Competitive pressures from alternative measurement technologies pose a further challenge.
Emerging Opportunities in Non-Contact Laser Displacement Sensors
Emerging opportunities include the growing demand for non-contact measurement in industries such as healthcare, robotics, and 3D printing. The development of more sophisticated sensors with advanced functionalities, such as integrated data processing and wireless communication, presents significant opportunities. Furthermore, there is potential for growth in developing economies as industrialization progresses.
Growth Accelerators in the Non Contact Laser Displacement Sensors Industry
Technological breakthroughs, such as the development of more efficient and cost-effective laser sources, are accelerating market growth. Strategic partnerships between sensor manufacturers and system integrators are expanding market reach. Market expansion strategies focused on emerging markets are also contributing to long-term growth.
Key Players Shaping the Non Contact Laser Displacement Sensors Market
- KEYENCE
- Panasonic
- COGNEX
- OMRON
- Banner Engineering
- Micro-Epsilon
- Baumer
- SENSOPART
- ELAG Elektronik
- Balluff
- Acuity
- MTI Instruments (VITREK)
Notable Milestones in Non Contact Laser Displacement Sensors Sector
- 2020: Launch of a new high-precision laser displacement sensor by KEYENCE.
- 2021: Acquisition of a smaller sensor manufacturer by Panasonic.
- 2022: Introduction of a cost-effective laser sensor by Micro-Epsilon.
- 2023: Development of a new sensor with integrated data processing capabilities by Cognex.
- 2024: Expansion of a major sensor manufacturer into a new emerging market.
In-Depth Non Contact Laser Displacement Sensors Market Outlook
The non-contact laser displacement sensor market is poised for sustained growth, driven by ongoing technological advancements and increasing demand across various industries. Strategic opportunities lie in developing innovative sensor technologies and expanding into emerging markets. The long-term outlook is positive, with significant potential for market expansion and increased adoption rates.
Non Contact Laser Displacement Sensors Segmentation
-
1. Application
- 1.1. Automotive Industry
- 1.2. Aerospace and Military Industry
- 1.3. Industrial Manufacturing
- 1.4. Electronics and Photovoltaic Industry
- 1.5. Others
-
2. Type
- 2.1. 1D Laser Displacement Sensors
- 2.2. 2D Laser Displacement Sensors
- 2.3. 3D Laser Displacement Sensors
Non Contact Laser Displacement Sensors Segmentation By Geography
-
1. North America
- 1.1. United States
- 1.2. Canada
- 1.3. Mexico
-
2. South America
- 2.1. Brazil
- 2.2. Argentina
- 2.3. Rest of South America
-
3. Europe
- 3.1. United Kingdom
- 3.2. Germany
- 3.3. France
- 3.4. Italy
- 3.5. Spain
- 3.6. Russia
- 3.7. Benelux
- 3.8. Nordics
- 3.9. Rest of Europe
-
4. Middle East & Africa
- 4.1. Turkey
- 4.2. Israel
- 4.3. GCC
- 4.4. North Africa
- 4.5. South Africa
- 4.6. Rest of Middle East & Africa
-
5. Asia Pacific
- 5.1. China
- 5.2. India
- 5.3. Japan
- 5.4. South Korea
- 5.5. ASEAN
- 5.6. Oceania
- 5.7. Rest of Asia Pacific

Non Contact Laser Displacement Sensors REPORT HIGHLIGHTS
| Aspects | Details |
|---|---|
| Study Period | 2019-2033 |
| Base Year | 2024 |
| Estimated Year | 2025 |
| Forecast Period | 2025-2033 |
| Historical Period | 2019-2024 |
| Growth Rate | CAGR of XXX% from 2019-2033 |
| Segmentation |
|
Table of Contents
- 1. Introduction
- 1.1. Research Scope
- 1.2. Market Segmentation
- 1.3. Research Methodology
- 1.4. Definitions and Assumptions
- 2. Executive Summary
- 2.1. Introduction
- 3. Market Dynamics
- 3.1. Introduction
- 3.2. Market Drivers
- 3.3. Market Restrains
- 3.4. Market Trends
- 4. Market Factor Analysis
- 4.1. Porters Five Forces
- 4.2. Supply/Value Chain
- 4.3. PESTEL analysis
- 4.4. Market Entropy
- 4.5. Patent/Trademark Analysis
- 5. Global Non Contact Laser Displacement Sensors Analysis, Insights and Forecast, 2019-2031
- 5.1. Market Analysis, Insights and Forecast - by Application
- 5.1.1. Automotive Industry
- 5.1.2. Aerospace and Military Industry
- 5.1.3. Industrial Manufacturing
- 5.1.4. Electronics and Photovoltaic Industry
- 5.1.5. Others
- 5.2. Market Analysis, Insights and Forecast - by Type
- 5.2.1. 1D Laser Displacement Sensors
- 5.2.2. 2D Laser Displacement Sensors
- 5.2.3. 3D Laser Displacement Sensors
- 5.3. Market Analysis, Insights and Forecast - by Region
- 5.3.1. North America
- 5.3.2. South America
- 5.3.3. Europe
- 5.3.4. Middle East & Africa
- 5.3.5. Asia Pacific
- 5.1. Market Analysis, Insights and Forecast - by Application
- 6. North America Non Contact Laser Displacement Sensors Analysis, Insights and Forecast, 2019-2031
- 6.1. Market Analysis, Insights and Forecast - by Application
- 6.1.1. Automotive Industry
- 6.1.2. Aerospace and Military Industry
- 6.1.3. Industrial Manufacturing
- 6.1.4. Electronics and Photovoltaic Industry
- 6.1.5. Others
- 6.2. Market Analysis, Insights and Forecast - by Type
- 6.2.1. 1D Laser Displacement Sensors
- 6.2.2. 2D Laser Displacement Sensors
- 6.2.3. 3D Laser Displacement Sensors
- 6.1. Market Analysis, Insights and Forecast - by Application
- 7. South America Non Contact Laser Displacement Sensors Analysis, Insights and Forecast, 2019-2031
- 7.1. Market Analysis, Insights and Forecast - by Application
- 7.1.1. Automotive Industry
- 7.1.2. Aerospace and Military Industry
- 7.1.3. Industrial Manufacturing
- 7.1.4. Electronics and Photovoltaic Industry
- 7.1.5. Others
- 7.2. Market Analysis, Insights and Forecast - by Type
- 7.2.1. 1D Laser Displacement Sensors
- 7.2.2. 2D Laser Displacement Sensors
- 7.2.3. 3D Laser Displacement Sensors
- 7.1. Market Analysis, Insights and Forecast - by Application
- 8. Europe Non Contact Laser Displacement Sensors Analysis, Insights and Forecast, 2019-2031
- 8.1. Market Analysis, Insights and Forecast - by Application
- 8.1.1. Automotive Industry
- 8.1.2. Aerospace and Military Industry
- 8.1.3. Industrial Manufacturing
- 8.1.4. Electronics and Photovoltaic Industry
- 8.1.5. Others
- 8.2. Market Analysis, Insights and Forecast - by Type
- 8.2.1. 1D Laser Displacement Sensors
- 8.2.2. 2D Laser Displacement Sensors
- 8.2.3. 3D Laser Displacement Sensors
- 8.1. Market Analysis, Insights and Forecast - by Application
- 9. Middle East & Africa Non Contact Laser Displacement Sensors Analysis, Insights and Forecast, 2019-2031
- 9.1. Market Analysis, Insights and Forecast - by Application
- 9.1.1. Automotive Industry
- 9.1.2. Aerospace and Military Industry
- 9.1.3. Industrial Manufacturing
- 9.1.4. Electronics and Photovoltaic Industry
- 9.1.5. Others
- 9.2. Market Analysis, Insights and Forecast - by Type
- 9.2.1. 1D Laser Displacement Sensors
- 9.2.2. 2D Laser Displacement Sensors
- 9.2.3. 3D Laser Displacement Sensors
- 9.1. Market Analysis, Insights and Forecast - by Application
- 10. Asia Pacific Non Contact Laser Displacement Sensors Analysis, Insights and Forecast, 2019-2031
- 10.1. Market Analysis, Insights and Forecast - by Application
- 10.1.1. Automotive Industry
- 10.1.2. Aerospace and Military Industry
- 10.1.3. Industrial Manufacturing
- 10.1.4. Electronics and Photovoltaic Industry
- 10.1.5. Others
- 10.2. Market Analysis, Insights and Forecast - by Type
- 10.2.1. 1D Laser Displacement Sensors
- 10.2.2. 2D Laser Displacement Sensors
- 10.2.3. 3D Laser Displacement Sensors
- 10.1. Market Analysis, Insights and Forecast - by Application
- 11. Competitive Analysis
- 11.1. Global Market Share Analysis 2024
- 11.2. Company Profiles
- 11.2.1 KEYENCE
- 11.2.1.1. Overview
- 11.2.1.2. Products
- 11.2.1.3. SWOT Analysis
- 11.2.1.4. Recent Developments
- 11.2.1.5. Financials (Based on Availability)
- 11.2.2 Panasonic
- 11.2.2.1. Overview
- 11.2.2.2. Products
- 11.2.2.3. SWOT Analysis
- 11.2.2.4. Recent Developments
- 11.2.2.5. Financials (Based on Availability)
- 11.2.3 COGNEX
- 11.2.3.1. Overview
- 11.2.3.2. Products
- 11.2.3.3. SWOT Analysis
- 11.2.3.4. Recent Developments
- 11.2.3.5. Financials (Based on Availability)
- 11.2.4 OMRON
- 11.2.4.1. Overview
- 11.2.4.2. Products
- 11.2.4.3. SWOT Analysis
- 11.2.4.4. Recent Developments
- 11.2.4.5. Financials (Based on Availability)
- 11.2.5 Banner Engineering
- 11.2.5.1. Overview
- 11.2.5.2. Products
- 11.2.5.3. SWOT Analysis
- 11.2.5.4. Recent Developments
- 11.2.5.5. Financials (Based on Availability)
- 11.2.6 Micro-Epsilon
- 11.2.6.1. Overview
- 11.2.6.2. Products
- 11.2.6.3. SWOT Analysis
- 11.2.6.4. Recent Developments
- 11.2.6.5. Financials (Based on Availability)
- 11.2.7 Baumer
- 11.2.7.1. Overview
- 11.2.7.2. Products
- 11.2.7.3. SWOT Analysis
- 11.2.7.4. Recent Developments
- 11.2.7.5. Financials (Based on Availability)
- 11.2.8 SENSOPART
- 11.2.8.1. Overview
- 11.2.8.2. Products
- 11.2.8.3. SWOT Analysis
- 11.2.8.4. Recent Developments
- 11.2.8.5. Financials (Based on Availability)
- 11.2.9 ELAG Elektronik
- 11.2.9.1. Overview
- 11.2.9.2. Products
- 11.2.9.3. SWOT Analysis
- 11.2.9.4. Recent Developments
- 11.2.9.5. Financials (Based on Availability)
- 11.2.10 Balluff
- 11.2.10.1. Overview
- 11.2.10.2. Products
- 11.2.10.3. SWOT Analysis
- 11.2.10.4. Recent Developments
- 11.2.10.5. Financials (Based on Availability)
- 11.2.11 Acuity
- 11.2.11.1. Overview
- 11.2.11.2. Products
- 11.2.11.3. SWOT Analysis
- 11.2.11.4. Recent Developments
- 11.2.11.5. Financials (Based on Availability)
- 11.2.12 MTI Instruments (VITREK)
- 11.2.12.1. Overview
- 11.2.12.2. Products
- 11.2.12.3. SWOT Analysis
- 11.2.12.4. Recent Developments
- 11.2.12.5. Financials (Based on Availability)
- 11.2.1 KEYENCE
List of Figures
- Figure 1: Global Non Contact Laser Displacement Sensors Revenue Breakdown (million, %) by Region 2024 & 2032
- Figure 2: North America Non Contact Laser Displacement Sensors Revenue (million), by Application 2024 & 2032
- Figure 3: North America Non Contact Laser Displacement Sensors Revenue Share (%), by Application 2024 & 2032
- Figure 4: North America Non Contact Laser Displacement Sensors Revenue (million), by Type 2024 & 2032
- Figure 5: North America Non Contact Laser Displacement Sensors Revenue Share (%), by Type 2024 & 2032
- Figure 6: North America Non Contact Laser Displacement Sensors Revenue (million), by Country 2024 & 2032
- Figure 7: North America Non Contact Laser Displacement Sensors Revenue Share (%), by Country 2024 & 2032
- Figure 8: South America Non Contact Laser Displacement Sensors Revenue (million), by Application 2024 & 2032
- Figure 9: South America Non Contact Laser Displacement Sensors Revenue Share (%), by Application 2024 & 2032
- Figure 10: South America Non Contact Laser Displacement Sensors Revenue (million), by Type 2024 & 2032
- Figure 11: South America Non Contact Laser Displacement Sensors Revenue Share (%), by Type 2024 & 2032
- Figure 12: South America Non Contact Laser Displacement Sensors Revenue (million), by Country 2024 & 2032
- Figure 13: South America Non Contact Laser Displacement Sensors Revenue Share (%), by Country 2024 & 2032
- Figure 14: Europe Non Contact Laser Displacement Sensors Revenue (million), by Application 2024 & 2032
- Figure 15: Europe Non Contact Laser Displacement Sensors Revenue Share (%), by Application 2024 & 2032
- Figure 16: Europe Non Contact Laser Displacement Sensors Revenue (million), by Type 2024 & 2032
- Figure 17: Europe Non Contact Laser Displacement Sensors Revenue Share (%), by Type 2024 & 2032
- Figure 18: Europe Non Contact Laser Displacement Sensors Revenue (million), by Country 2024 & 2032
- Figure 19: Europe Non Contact Laser Displacement Sensors Revenue Share (%), by Country 2024 & 2032
- Figure 20: Middle East & Africa Non Contact Laser Displacement Sensors Revenue (million), by Application 2024 & 2032
- Figure 21: Middle East & Africa Non Contact Laser Displacement Sensors Revenue Share (%), by Application 2024 & 2032
- Figure 22: Middle East & Africa Non Contact Laser Displacement Sensors Revenue (million), by Type 2024 & 2032
- Figure 23: Middle East & Africa Non Contact Laser Displacement Sensors Revenue Share (%), by Type 2024 & 2032
- Figure 24: Middle East & Africa Non Contact Laser Displacement Sensors Revenue (million), by Country 2024 & 2032
- Figure 25: Middle East & Africa Non Contact Laser Displacement Sensors Revenue Share (%), by Country 2024 & 2032
- Figure 26: Asia Pacific Non Contact Laser Displacement Sensors Revenue (million), by Application 2024 & 2032
- Figure 27: Asia Pacific Non Contact Laser Displacement Sensors Revenue Share (%), by Application 2024 & 2032
- Figure 28: Asia Pacific Non Contact Laser Displacement Sensors Revenue (million), by Type 2024 & 2032
- Figure 29: Asia Pacific Non Contact Laser Displacement Sensors Revenue Share (%), by Type 2024 & 2032
- Figure 30: Asia Pacific Non Contact Laser Displacement Sensors Revenue (million), by Country 2024 & 2032
- Figure 31: Asia Pacific Non Contact Laser Displacement Sensors Revenue Share (%), by Country 2024 & 2032
List of Tables
- Table 1: Global Non Contact Laser Displacement Sensors Revenue million Forecast, by Region 2019 & 2032
- Table 2: Global Non Contact Laser Displacement Sensors Revenue million Forecast, by Application 2019 & 2032
- Table 3: Global Non Contact Laser Displacement Sensors Revenue million Forecast, by Type 2019 & 2032
- Table 4: Global Non Contact Laser Displacement Sensors Revenue million Forecast, by Region 2019 & 2032
- Table 5: Global Non Contact Laser Displacement Sensors Revenue million Forecast, by Application 2019 & 2032
- Table 6: Global Non Contact Laser Displacement Sensors Revenue million Forecast, by Type 2019 & 2032
- Table 7: Global Non Contact Laser Displacement Sensors Revenue million Forecast, by Country 2019 & 2032
- Table 8: United States Non Contact Laser Displacement Sensors Revenue (million) Forecast, by Application 2019 & 2032
- Table 9: Canada Non Contact Laser Displacement Sensors Revenue (million) Forecast, by Application 2019 & 2032
- Table 10: Mexico Non Contact Laser Displacement Sensors Revenue (million) Forecast, by Application 2019 & 2032
- Table 11: Global Non Contact Laser Displacement Sensors Revenue million Forecast, by Application 2019 & 2032
- Table 12: Global Non Contact Laser Displacement Sensors Revenue million Forecast, by Type 2019 & 2032
- Table 13: Global Non Contact Laser Displacement Sensors Revenue million Forecast, by Country 2019 & 2032
- Table 14: Brazil Non Contact Laser Displacement Sensors Revenue (million) Forecast, by Application 2019 & 2032
- Table 15: Argentina Non Contact Laser Displacement Sensors Revenue (million) Forecast, by Application 2019 & 2032
- Table 16: Rest of South America Non Contact Laser Displacement Sensors Revenue (million) Forecast, by Application 2019 & 2032
- Table 17: Global Non Contact Laser Displacement Sensors Revenue million Forecast, by Application 2019 & 2032
- Table 18: Global Non Contact Laser Displacement Sensors Revenue million Forecast, by Type 2019 & 2032
- Table 19: Global Non Contact Laser Displacement Sensors Revenue million Forecast, by Country 2019 & 2032
- Table 20: United Kingdom Non Contact Laser Displacement Sensors Revenue (million) Forecast, by Application 2019 & 2032
- Table 21: Germany Non Contact Laser Displacement Sensors Revenue (million) Forecast, by Application 2019 & 2032
- Table 22: France Non Contact Laser Displacement Sensors Revenue (million) Forecast, by Application 2019 & 2032
- Table 23: Italy Non Contact Laser Displacement Sensors Revenue (million) Forecast, by Application 2019 & 2032
- Table 24: Spain Non Contact Laser Displacement Sensors Revenue (million) Forecast, by Application 2019 & 2032
- Table 25: Russia Non Contact Laser Displacement Sensors Revenue (million) Forecast, by Application 2019 & 2032
- Table 26: Benelux Non Contact Laser Displacement Sensors Revenue (million) Forecast, by Application 2019 & 2032
- Table 27: Nordics Non Contact Laser Displacement Sensors Revenue (million) Forecast, by Application 2019 & 2032
- Table 28: Rest of Europe Non Contact Laser Displacement Sensors Revenue (million) Forecast, by Application 2019 & 2032
- Table 29: Global Non Contact Laser Displacement Sensors Revenue million Forecast, by Application 2019 & 2032
- Table 30: Global Non Contact Laser Displacement Sensors Revenue million Forecast, by Type 2019 & 2032
- Table 31: Global Non Contact Laser Displacement Sensors Revenue million Forecast, by Country 2019 & 2032
- Table 32: Turkey Non Contact Laser Displacement Sensors Revenue (million) Forecast, by Application 2019 & 2032
- Table 33: Israel Non Contact Laser Displacement Sensors Revenue (million) Forecast, by Application 2019 & 2032
- Table 34: GCC Non Contact Laser Displacement Sensors Revenue (million) Forecast, by Application 2019 & 2032
- Table 35: North Africa Non Contact Laser Displacement Sensors Revenue (million) Forecast, by Application 2019 & 2032
- Table 36: South Africa Non Contact Laser Displacement Sensors Revenue (million) Forecast, by Application 2019 & 2032
- Table 37: Rest of Middle East & Africa Non Contact Laser Displacement Sensors Revenue (million) Forecast, by Application 2019 & 2032
- Table 38: Global Non Contact Laser Displacement Sensors Revenue million Forecast, by Application 2019 & 2032
- Table 39: Global Non Contact Laser Displacement Sensors Revenue million Forecast, by Type 2019 & 2032
- Table 40: Global Non Contact Laser Displacement Sensors Revenue million Forecast, by Country 2019 & 2032
- Table 41: China Non Contact Laser Displacement Sensors Revenue (million) Forecast, by Application 2019 & 2032
- Table 42: India Non Contact Laser Displacement Sensors Revenue (million) Forecast, by Application 2019 & 2032
- Table 43: Japan Non Contact Laser Displacement Sensors Revenue (million) Forecast, by Application 2019 & 2032
- Table 44: South Korea Non Contact Laser Displacement Sensors Revenue (million) Forecast, by Application 2019 & 2032
- Table 45: ASEAN Non Contact Laser Displacement Sensors Revenue (million) Forecast, by Application 2019 & 2032
- Table 46: Oceania Non Contact Laser Displacement Sensors Revenue (million) Forecast, by Application 2019 & 2032
- Table 47: Rest of Asia Pacific Non Contact Laser Displacement Sensors Revenue (million) Forecast, by Application 2019 & 2032
Frequently Asked Questions
1. What is the projected Compound Annual Growth Rate (CAGR) of the Non Contact Laser Displacement Sensors?
The projected CAGR is approximately XXX%.
2. Which companies are prominent players in the Non Contact Laser Displacement Sensors?
Key companies in the market include KEYENCE, Panasonic, COGNEX, OMRON, Banner Engineering, Micro-Epsilon, Baumer, SENSOPART, ELAG Elektronik, Balluff, Acuity, MTI Instruments (VITREK).
3. What are the main segments of the Non Contact Laser Displacement Sensors?
The market segments include Application, Type.
4. Can you provide details about the market size?
The market size is estimated to be USD XXX million as of 2022.
5. What are some drivers contributing to market growth?
N/A
6. What are the notable trends driving market growth?
N/A
7. Are there any restraints impacting market growth?
N/A
8. Can you provide examples of recent developments in the market?
N/A
9. What pricing options are available for accessing the report?
Pricing options include single-user, multi-user, and enterprise licenses priced at USD 4250.00, USD 6375.00, and USD 8500.00 respectively.
10. Is the market size provided in terms of value or volume?
The market size is provided in terms of value, measured in million.
11. Are there any specific market keywords associated with the report?
Yes, the market keyword associated with the report is "Non Contact Laser Displacement Sensors," which aids in identifying and referencing the specific market segment covered.
12. How do I determine which pricing option suits my needs best?
The pricing options vary based on user requirements and access needs. Individual users may opt for single-user licenses, while businesses requiring broader access may choose multi-user or enterprise licenses for cost-effective access to the report.
13. Are there any additional resources or data provided in the Non Contact Laser Displacement Sensors report?
While the report offers comprehensive insights, it's advisable to review the specific contents or supplementary materials provided to ascertain if additional resources or data are available.
14. How can I stay updated on further developments or reports in the Non Contact Laser Displacement Sensors?
To stay informed about further developments, trends, and reports in the Non Contact Laser Displacement Sensors, consider subscribing to industry newsletters, following relevant companies and organizations, or regularly checking reputable industry news sources and publications.
Methodology
Step 1 - Identification of Relevant Samples Size from Population Database


Step 2 - Approaches for Defining Global Market Size (Value, Volume* & Price*)

Note*: In applicable scenarios
Step 3 - Data Sources
Primary Research
- Web Analytics
- Survey Reports
- Research Institute
- Latest Research Reports
- Opinion Leaders
Secondary Research
- Annual Reports
- White Paper
- Latest Press Release
- Industry Association
- Paid Database
- Investor Presentations

Step 4 - Data Triangulation
Involves using different sources of information in order to increase the validity of a study
These sources are likely to be stakeholders in a program - participants, other researchers, program staff, other community members, and so on.
Then we put all data in single framework & apply various statistical tools to find out the dynamic on the market.
During the analysis stage, feedback from the stakeholder groups would be compared to determine areas of agreement as well as areas of divergence
