

Key Insights
The North American Completion Equipment and Services market is projected to reach $2.46 billion by 2025, with an anticipated Compound Annual Growth Rate (CAGR) of 2.4% through 2033. This expansion is fueled by ongoing upstream oil and gas investments and the increasing adoption of advanced completion technologies. The onshore segment leads market share due to established infrastructure, while offshore activities, though smaller, are expected to grow significantly with deepwater exploration and subsea advancements. Key equipment demands include casing, tubing, and artificial lift systems for production enhancement. Drilling, well completion, stimulation, and workover services drive the services segment. Intense competition among major players like Halliburton, Schlumberger, and Baker Hughes fosters innovation. However, fluctuating oil and gas prices remain a primary market restraint.
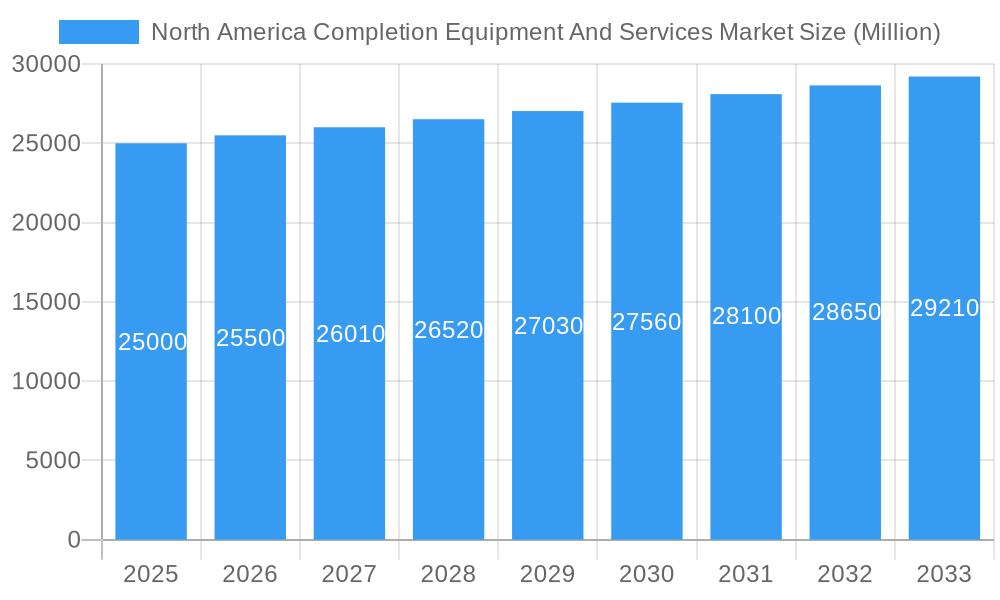
North America Completion Equipment And Services Market Market Size (In Billion)
Despite price volatility, the North American market shows resilience, driven by enhanced oil and gas recovery rates via advanced completion techniques. Technological advancements in hydraulic fracturing and horizontal drilling boost efficiency and productivity. Regulatory shifts towards environmental sustainability are also indirectly promoting demand for eco-friendly completion solutions. The United States holds the largest market share, followed by Canada and Mexico. The forecast period (2025-2033) indicates sustained growth, supported by consistent energy demand and strategic investments, especially in shale gas and tight oil formations.
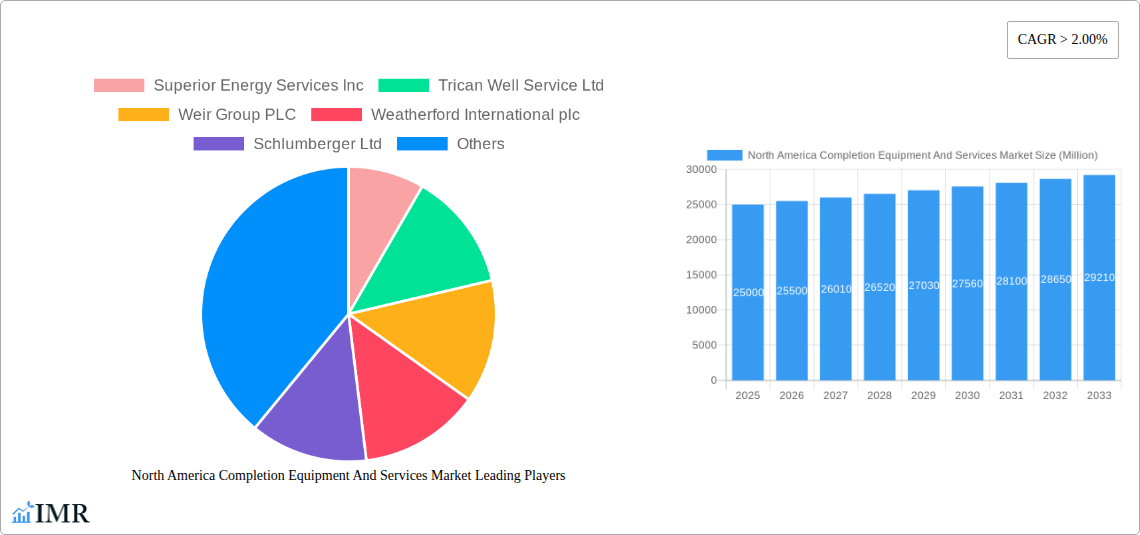
North America Completion Equipment And Services Market Company Market Share
North America Completion Equipment and Services Market: A Comprehensive Report (2019-2033)
This comprehensive report provides an in-depth analysis of the North America Completion Equipment and Services market, encompassing market dynamics, growth trends, regional dominance, product landscape, key players, and future outlook. The report covers the historical period (2019-2024), the base year (2025), and forecasts the market from 2025 to 2033. The market is segmented by Location of Deployment (Onshore, Offshore), Equipment Type (Casing and Tubing, Cementing, Artificial Lift Systems), and Services (Drilling, Well Completion, Stimulation, Workover & Maintenance). The total market value is projected to reach XX Million by 2033.
North America Completion Equipment and Services Market Dynamics & Structure
The North American completion equipment and services market is characterized by a moderately concentrated structure with a few major players holding significant market share. Technological innovation, particularly in areas like automation and digitalization, is a key driver. Stringent regulatory frameworks regarding environmental protection and safety standards significantly impact operations. The market also faces competition from substitute technologies and services. The end-user demographics predominantly comprise exploration and production companies of varying sizes. M&A activity remains relatively frequent, with larger players consolidating their market positions.
- Market Concentration: The top 5 players hold approximately xx% of the market share in 2025.
- Technological Innovation: Focus on automation, data analytics, and enhanced efficiency drives innovation but faces challenges in high upfront capital costs.
- Regulatory Framework: Environmental regulations and safety standards influence operational costs and technology adoption.
- Competitive Substitutes: Alternative completion techniques and service providers exert competitive pressure.
- M&A Trends: The number of M&A deals in the sector averaged xx per year between 2019-2024.
North America Completion Equipment and Services Market Growth Trends & Insights
The North American completion equipment and services market experienced a CAGR of xx% during the historical period (2019-2024), driven by factors including increased oil and gas exploration and production activities. The market size is estimated at XX Million in 2025 and is projected to reach XX Million by 2033, exhibiting a CAGR of xx% during the forecast period (2025-2033). Technological advancements, such as the adoption of advanced drilling techniques and improved completion technologies, significantly influence market growth. Consumer behavior shifts towards sustainable and environmentally friendly practices are also creating new market opportunities. Market penetration of advanced technologies is steadily increasing, with xx% adoption rate expected by 2033.
Dominant Regions, Countries, or Segments in North America Completion Equipment and Services Market
The onshore segment dominates the North American completion equipment and services market, accounting for approximately xx% of the total market value in 2025. This is largely attributed to the significant number of onshore oil and gas fields in the region. The United States constitutes the largest national market, followed by Canada and Mexico. Within the services segment, well completion and stimulation services exhibit the highest growth potential, driven by the demand for efficient and cost-effective well completion techniques.
- Onshore Dominance: Large reserves and established infrastructure support onshore segment growth.
- US Market Leadership: High oil and gas production and strong economic activity contribute to US market dominance.
- Well Completion and Stimulation: Growing demand for sophisticated completion techniques fuels segment growth.
- Casing and Tubing: This subsegment remains a stable and significant contributor to the overall market, showing a consistent demand despite fluctuations in overall market activity.
North America Completion Equipment and Services Market Product Landscape
The market showcases ongoing innovation in completion equipment and services, with a focus on enhanced efficiency, reduced environmental impact, and improved safety. Products like automated systems, advanced cementing technologies, and intelligent artificial lift systems are gaining popularity. These innovations offer better performance metrics, including increased well productivity, reduced downtime, and lower operational costs. Key selling propositions often revolve around improved reliability, reduced risk, and increased efficiency. The development and implementation of data-driven analytics tools are also impacting the performance of the products and services.
Key Drivers, Barriers & Challenges in North America Completion Equipment and Services Market
Key Drivers:
- Increasing oil and gas exploration and production activities.
- Technological advancements leading to improved completion techniques.
- Growing demand for efficient and cost-effective well completion solutions.
Key Challenges and Restraints:
- Fluctuations in oil and gas prices create uncertainty and impact investment decisions.
- Stringent environmental regulations increase operational costs.
- Intense competition among service providers leads to price pressure. A conservative estimate suggests that price pressure has negatively impacted profit margins by approximately xx% in the last 5 years.
Emerging Opportunities in North America Completion Equipment and Services Market
- Growth in unconventional oil and gas resources presents new opportunities for specialized equipment and services.
- Adoption of digital technologies offers opportunities for data-driven optimization and improved efficiency.
- Demand for sustainable completion solutions aligns with environmental concerns and presents opportunities for innovative technologies.
Growth Accelerators in the North America Completion Equipment and Services Market Industry
Technological breakthroughs, such as advancements in automation and data analytics, are poised to accelerate market growth. Strategic partnerships between equipment manufacturers and service providers facilitate collaborative innovation and market expansion. Government initiatives supporting energy infrastructure development and promoting technological innovation also play a significant role.
Key Players Shaping the North America Completion Equipment and Services Market Market
- Superior Energy Services Inc
- Trican Well Service Ltd
- Weir Group PLC
- Weatherford International plc
- Schlumberger Ltd
- Packers Plus Energy Services Inc
- Baker Hughes Company
- Halliburton Company
- National-Oilwell Varco Inc
- Schoeller-Bleckmann Oilfield Equipment AG
- Welltec A/S
Notable Milestones in North America Completion Equipment and Services Market Sector
- January 2023: Talos Energy's discovery of commercial quantities of oil and gas in the U.S. Gulf of Mexico boosted investor confidence and signaled potential for further deepwater exploration activities, positively impacting the demand for specialized equipment and services.
- March 2023: The approval of the Willow oil drilling project in Alaska, while controversial, signifies significant investment in oil and gas exploration and production, creating considerable demand for completion equipment and services.
In-Depth North America Completion Equipment and Services Market Market Outlook
The future of the North American completion equipment and services market is promising, driven by ongoing exploration and production activities, particularly in unconventional resources. Technological advancements and the adoption of data-driven solutions will continue to drive efficiency gains and market growth. Strategic partnerships and investments in research and development will further shape the market landscape, creating numerous opportunities for both established and emerging players. The market's long-term potential rests on the sustained demand for energy, technological progress, and favorable regulatory environments.
North America Completion Equipment And Services Market Segmentation
-
1. Location of Deployment
- 1.1. Onshore
- 1.2. Offshore
-
2. Geography
- 2.1. United States
- 2.2. Canada
- 2.3. Rest of North America
North America Completion Equipment And Services Market Segmentation By Geography
- 1. United States
- 2. Canada
- 3. Rest of North America
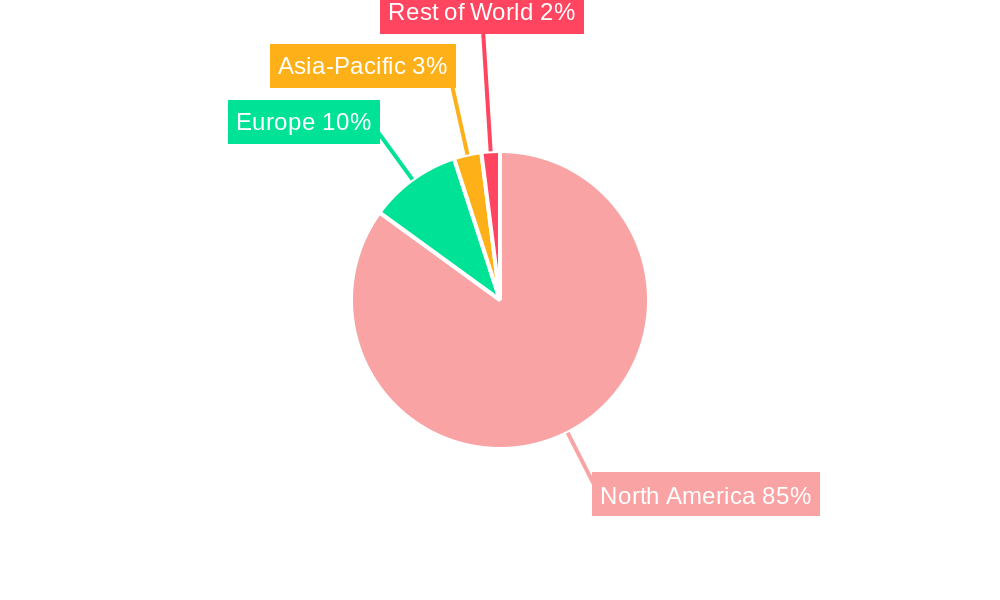
North America Completion Equipment And Services Market Regional Market Share
Geographic Coverage of North America Completion Equipment And Services Market
North America Completion Equipment And Services Market REPORT HIGHLIGHTS
| Aspects | Details |
|---|---|
| Study Period | 2020-2034 |
| Base Year | 2025 |
| Estimated Year | 2026 |
| Forecast Period | 2026-2034 |
| Historical Period | 2020-2025 |
| Growth Rate | CAGR of 2.4% from 2020-2034 |
| Segmentation |
|
Table of Contents
- 1. Introduction
- 1.1. Research Scope
- 1.2. Market Segmentation
- 1.3. Research Objective
- 1.4. Definitions and Assumptions
- 2. Executive Summary
- 2.1. Market Snapshot
- 3. Market Dynamics
- 3.1. Market Drivers
- 3.2. Market Restrains
- 3.3. Market Trends
- 3.4. Market Opportunities
- 4. Market Factor Analysis
- 4.1. Porters Five Forces
- 4.1.1. Bargaining Power of Suppliers
- 4.1.2. Bargaining Power of Buyers
- 4.1.3. Threat of New Entrants
- 4.1.4. Threat of Substitutes
- 4.1.5. Competitive Rivalry
- 4.2. PESTEL analysis
- 4.3. BCG Analysis
- 4.3.1. Stars (High Growth, High Market Share)
- 4.3.2. Cash Cows (Low Growth, High Market Share)
- 4.3.3. Question Mark (High Growth, Low Market Share)
- 4.3.4. Dogs (Low Growth, Low Market Share)
- 4.4. Ansoff Matrix Analysis
- 4.5. Supply Chain Analysis
- 4.6. Regulatory Landscape
- 4.7. Current Market Potential and Opportunity Assessment (TAM–SAM–SOM Framework)
- 4.8. IMR Analyst Note
- 4.1. Porters Five Forces
- 5. Market Analysis, Insights and Forecast 2021-2033
- 5.1. Market Analysis, Insights and Forecast - by Location of Deployment
- 5.1.1. Onshore
- 5.1.2. Offshore
- 5.2. Market Analysis, Insights and Forecast - by Geography
- 5.2.1. United States
- 5.2.2. Canada
- 5.2.3. Rest of North America
- 5.3. Market Analysis, Insights and Forecast - by Region
- 5.3.1. United States
- 5.3.2. Canada
- 5.3.3. Rest of North America
- 5.1. Market Analysis, Insights and Forecast - by Location of Deployment
- 6. North America Completion Equipment And Services Market Analysis, Insights and Forecast, 2021-2033
- 6.1. Market Analysis, Insights and Forecast - by Location of Deployment
- 6.1.1. Onshore
- 6.1.2. Offshore
- 6.2. Market Analysis, Insights and Forecast - by Geography
- 6.2.1. United States
- 6.2.2. Canada
- 6.2.3. Rest of North America
- 6.1. Market Analysis, Insights and Forecast - by Location of Deployment
- 7. United States North America Completion Equipment And Services Market Analysis, Insights and Forecast, 2020-2032
- 7.1. Market Analysis, Insights and Forecast - by Location of Deployment
- 7.1.1. Onshore
- 7.1.2. Offshore
- 7.2. Market Analysis, Insights and Forecast - by Geography
- 7.2.1. United States
- 7.2.2. Canada
- 7.2.3. Rest of North America
- 7.1. Market Analysis, Insights and Forecast - by Location of Deployment
- 8. Canada North America Completion Equipment And Services Market Analysis, Insights and Forecast, 2020-2032
- 8.1. Market Analysis, Insights and Forecast - by Location of Deployment
- 8.1.1. Onshore
- 8.1.2. Offshore
- 8.2. Market Analysis, Insights and Forecast - by Geography
- 8.2.1. United States
- 8.2.2. Canada
- 8.2.3. Rest of North America
- 8.1. Market Analysis, Insights and Forecast - by Location of Deployment
- 9. Rest of North America North America Completion Equipment And Services Market Analysis, Insights and Forecast, 2020-2032
- 9.1. Market Analysis, Insights and Forecast - by Location of Deployment
- 9.1.1. Onshore
- 9.1.2. Offshore
- 9.2. Market Analysis, Insights and Forecast - by Geography
- 9.2.1. United States
- 9.2.2. Canada
- 9.2.3. Rest of North America
- 9.1. Market Analysis, Insights and Forecast - by Location of Deployment
- 10. Competitive Analysis
- 10.1. Company Profiles
- 10.1.1 Superior Energy Services Inc
- 10.1.1.1. Company Overview
- 10.1.1.2. Products
- 10.1.1.3. Company Financials
- 10.1.1.4. SWOT Analysis
- 10.1.2 Trican Well Service Ltd
- 10.1.2.1. Company Overview
- 10.1.2.2. Products
- 10.1.2.3. Company Financials
- 10.1.2.4. SWOT Analysis
- 10.1.3 Weir Group PLC
- 10.1.3.1. Company Overview
- 10.1.3.2. Products
- 10.1.3.3. Company Financials
- 10.1.3.4. SWOT Analysis
- 10.1.4 Weatherford International plc
- 10.1.4.1. Company Overview
- 10.1.4.2. Products
- 10.1.4.3. Company Financials
- 10.1.4.4. SWOT Analysis
- 10.1.5 Schlumberger Ltd
- 10.1.5.1. Company Overview
- 10.1.5.2. Products
- 10.1.5.3. Company Financials
- 10.1.5.4. SWOT Analysis
- 10.1.6 Packers Plus Energy Services Inc
- 10.1.6.1. Company Overview
- 10.1.6.2. Products
- 10.1.6.3. Company Financials
- 10.1.6.4. SWOT Analysis
- 10.1.7 Baker Hughes Company
- 10.1.7.1. Company Overview
- 10.1.7.2. Products
- 10.1.7.3. Company Financials
- 10.1.7.4. SWOT Analysis
- 10.1.8 Halliburton Company
- 10.1.8.1. Company Overview
- 10.1.8.2. Products
- 10.1.8.3. Company Financials
- 10.1.8.4. SWOT Analysis
- 10.1.9 National-Oilwell Varco Inc
- 10.1.9.1. Company Overview
- 10.1.9.2. Products
- 10.1.9.3. Company Financials
- 10.1.9.4. SWOT Analysis
- 10.1.10 Schoeller-Bleckmann Oilfield Equipment AG
- 10.1.10.1. Company Overview
- 10.1.10.2. Products
- 10.1.10.3. Company Financials
- 10.1.10.4. SWOT Analysis
- 10.1.11 Welltec A/S
- 10.1.11.1. Company Overview
- 10.1.11.2. Products
- 10.1.11.3. Company Financials
- 10.1.11.4. SWOT Analysis
- 10.1.1 Superior Energy Services Inc
- 10.2. Market Entropy
- 10.2.1 Company's Key Areas Served
- 10.2.2 Recent Developments
- 10.3. Company Market Share Analysis 2025
- 10.3.1 Top 5 Companies Market Share Analysis
- 10.3.2 Top 3 Companies Market Share Analysis
- 10.4. List of Potential Customers
- 11. Research Methodology
List of Figures
- Figure 1: North America Completion Equipment And Services Market Revenue Breakdown (billion, %) by Product 2025 & 2033
- Figure 2: North America Completion Equipment And Services Market Share (%) by Company 2025
List of Tables
- Table 1: North America Completion Equipment And Services Market Revenue billion Forecast, by Location of Deployment 2020 & 2033
- Table 2: North America Completion Equipment And Services Market Revenue billion Forecast, by Geography 2020 & 2033
- Table 3: North America Completion Equipment And Services Market Revenue billion Forecast, by Region 2020 & 2033
- Table 4: North America Completion Equipment And Services Market Revenue billion Forecast, by Location of Deployment 2020 & 2033
- Table 5: North America Completion Equipment And Services Market Revenue billion Forecast, by Geography 2020 & 2033
- Table 6: North America Completion Equipment And Services Market Revenue billion Forecast, by Country 2020 & 2033
- Table 7: North America Completion Equipment And Services Market Revenue billion Forecast, by Location of Deployment 2020 & 2033
- Table 8: North America Completion Equipment And Services Market Revenue billion Forecast, by Geography 2020 & 2033
- Table 9: North America Completion Equipment And Services Market Revenue billion Forecast, by Country 2020 & 2033
- Table 10: North America Completion Equipment And Services Market Revenue billion Forecast, by Location of Deployment 2020 & 2033
- Table 11: North America Completion Equipment And Services Market Revenue billion Forecast, by Geography 2020 & 2033
- Table 12: North America Completion Equipment And Services Market Revenue billion Forecast, by Country 2020 & 2033
Frequently Asked Questions
1. What is the projected Compound Annual Growth Rate (CAGR) of the North America Completion Equipment And Services Market?
The projected CAGR is approximately 2.4%.
2. Which companies are prominent players in the North America Completion Equipment And Services Market?
Key companies in the market include Superior Energy Services Inc, Trican Well Service Ltd, Weir Group PLC, Weatherford International plc, Schlumberger Ltd, Packers Plus Energy Services Inc, Baker Hughes Company, Halliburton Company, National-Oilwell Varco Inc, Schoeller-Bleckmann Oilfield Equipment AG, Welltec A/S.
3. What are the main segments of the North America Completion Equipment And Services Market?
The market segments include Location of Deployment, Geography.
4. Can you provide details about the market size?
The market size is estimated to be USD 2.46 billion as of 2022.
5. What are some drivers contributing to market growth?
4.; Global Inclination toward Renewable-based Power Generation4.; Increased Power Demand in Line with the Increasing Population.
6. What are the notable trends driving market growth?
Onshore to Dominate the Market.
7. Are there any restraints impacting market growth?
4.; High Initial Cost.
8. Can you provide examples of recent developments in the market?
January 2023: Talos Energy announced that the company found commercial quantities of oil and natural gas at two deepwater discoveries in the U.S. Gulf of Mexico. The company carried out a drilling campaign at the Lime Rock and Venice prospects in the fourth quarter of 2022.
9. What pricing options are available for accessing the report?
Pricing options include single-user, multi-user, and enterprise licenses priced at USD 4750, USD 5250, and USD 8750 respectively.
10. Is the market size provided in terms of value or volume?
The market size is provided in terms of value, measured in billion.
11. Are there any specific market keywords associated with the report?
Yes, the market keyword associated with the report is "North America Completion Equipment And Services Market," which aids in identifying and referencing the specific market segment covered.
12. How do I determine which pricing option suits my needs best?
The pricing options vary based on user requirements and access needs. Individual users may opt for single-user licenses, while businesses requiring broader access may choose multi-user or enterprise licenses for cost-effective access to the report.
13. Are there any additional resources or data provided in the North America Completion Equipment And Services Market report?
While the report offers comprehensive insights, it's advisable to review the specific contents or supplementary materials provided to ascertain if additional resources or data are available.
14. How can I stay updated on further developments or reports in the North America Completion Equipment And Services Market?
To stay informed about further developments, trends, and reports in the North America Completion Equipment And Services Market, consider subscribing to industry newsletters, following relevant companies and organizations, or regularly checking reputable industry news sources and publications.
Methodology
Step 1 - Identification of Relevant Samples Size from Population Database


Step 2 - Approaches for Defining Global Market Size (Value, Volume* & Price*)

Note*: In applicable scenarios
Step 3 - Data Sources
Primary Research
- Web Analytics
- Survey Reports
- Research Institute
- Latest Research Reports
- Opinion Leaders
Secondary Research
- Annual Reports
- White Paper
- Latest Press Release
- Industry Association
- Paid Database
- Investor Presentations

Step 4 - Data Triangulation
Involves using different sources of information in order to increase the validity of a study
These sources are likely to be stakeholders in a program - participants, other researchers, program staff, other community members, and so on.
Then we put all data in single framework & apply various statistical tools to find out the dynamic on the market.
During the analysis stage, feedback from the stakeholder groups would be compared to determine areas of agreement as well as areas of divergence