

Key Insights
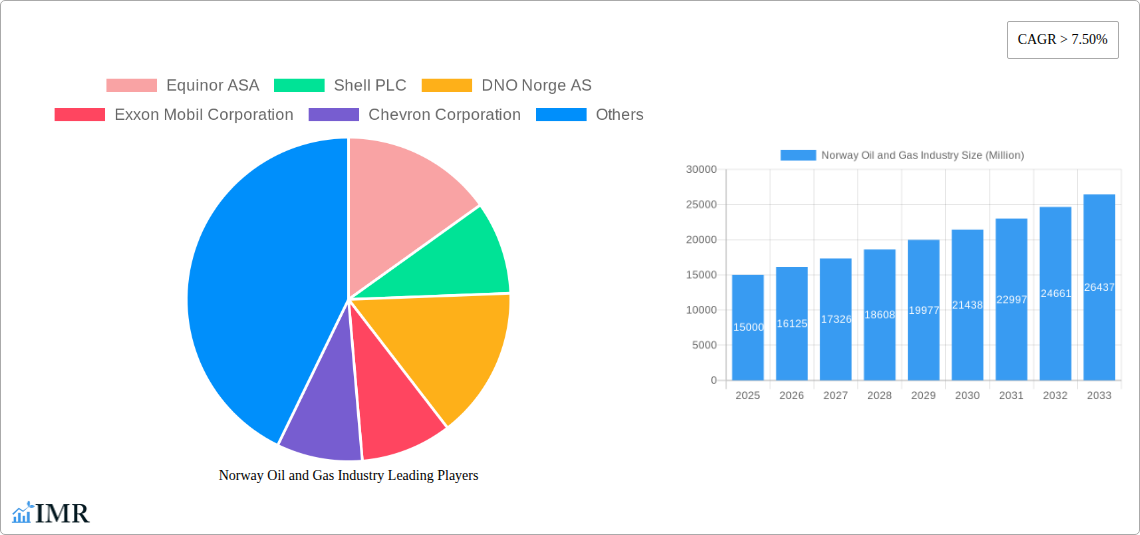
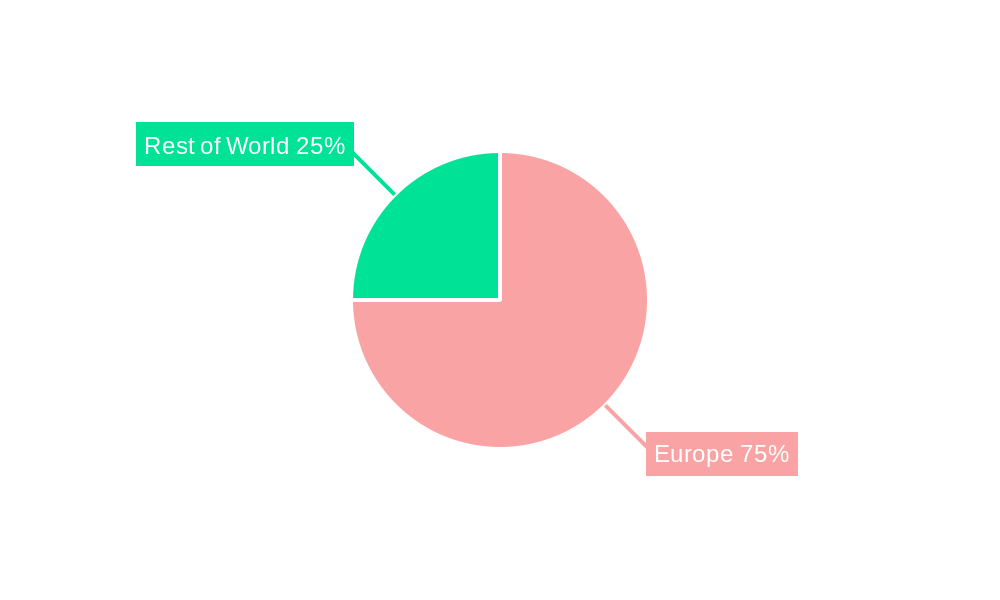
The Norway oil and gas industry, currently exhibiting a robust market size and a Compound Annual Growth Rate (CAGR) exceeding 7.50%, is poised for continued expansion through 2033. Driven by persistent global energy demand and Norway's significant reserves, the sector shows strong potential. Key growth drivers include increasing investments in offshore exploration and production, technological advancements in enhanced oil recovery techniques, and a focus on carbon capture and storage (CCS) to mitigate environmental impact. However, the industry faces challenges including fluctuating oil prices, stringent environmental regulations, and the global transition towards renewable energy sources. Segmentation reveals a mature upstream sector (exploration and production) alongside a dynamic midstream (transportation and storage) and downstream (refining and marketing) segment, with companies like Equinor ASA, Shell PLC, and ExxonMobil Corporation holding significant market share. The European market, particularly within Germany, the UK, and the Netherlands, presents a considerable demand for Norwegian oil and gas products.
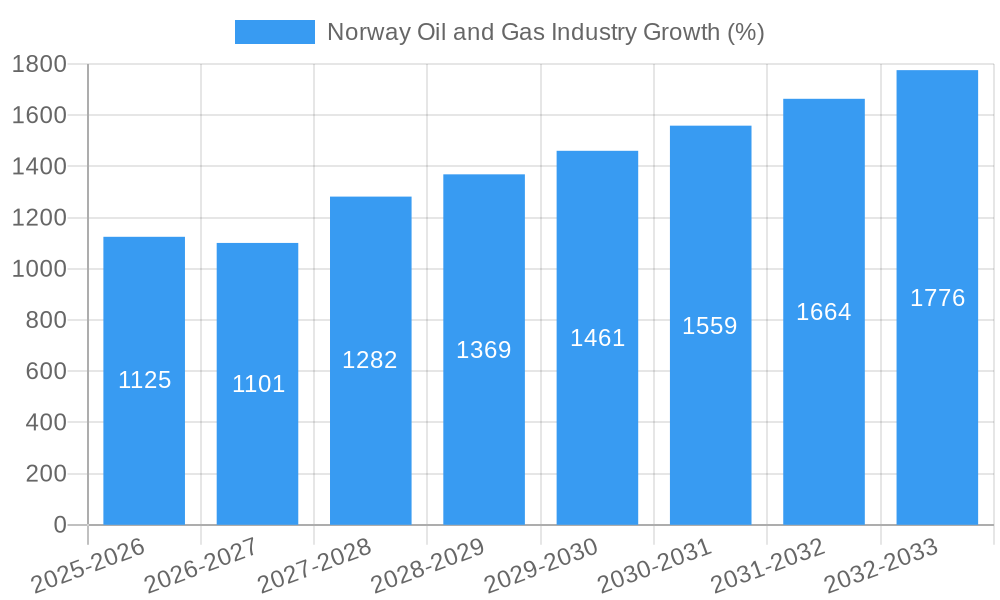
The forecast period (2025-2033) anticipates consistent growth, though the rate may moderate slightly in later years as the energy transition gains momentum. While the exact market size for 2025 is unavailable, a conservative estimate, factoring in the CAGR and existing market dynamics, points towards a substantial market value. The industry's resilience lies in its adaptability; a focus on efficiency improvements, diversification into lower-carbon energy solutions, and strategic partnerships will be crucial for maintaining profitability and sustainability in the coming decade. Continuous innovation, including advancements in subsea technologies and the exploration of new reserves, will play a pivotal role in shaping the future of the Norwegian oil and gas industry.
Norway Oil and Gas Industry Market Report: 2019-2033
This comprehensive report provides an in-depth analysis of the Norwegian oil and gas industry, encompassing market dynamics, growth trends, key players, and future outlook. Focusing on the upstream, midstream, and downstream segments, this report covers the period from 2019 to 2033, with a base year of 2025 and a forecast period of 2025-2033. It's an essential resource for industry professionals, investors, and policymakers seeking to understand this vital sector.
Norway Oil and Gas Industry Market Dynamics & Structure
This section analyzes the market concentration, technological innovation, regulatory landscape, competitive dynamics, and M&A activity within the Norwegian oil and gas industry. The Norwegian market exhibits a high degree of concentration, with major players like Equinor ASA, Shell PLC, and TotalEnergies SE holding significant market share. However, smaller companies like DNO Norge AS and Aker BP ASA also play important roles.
Market Structure & Concentration:
- Equinor ASA dominates the upstream sector, holding a xx% market share in 2025.
- Shell PLC and TotalEnergies SE hold significant shares in both upstream and downstream operations.
- The midstream segment is characterized by a mix of large integrated companies and specialized pipeline operators.
- Consolidation through mergers and acquisitions (M&A) has been a notable trend, with xx M&A deals recorded between 2019 and 2024, totaling xx million USD.
Technological Innovation & Regulatory Framework:
- The industry is undergoing a significant shift toward carbon reduction and the integration of renewable energy sources.
- Stringent environmental regulations from the Norwegian government incentivize investment in low-carbon technologies.
- Innovation barriers include high capital expenditure requirements for new technologies and the complexities of offshore operations.
Competitive Landscape:
- Competition is intense, particularly in the upstream sector, driven by exploration and production activities.
- The emergence of renewable energy sources poses a competitive threat, requiring companies to diversify their portfolios.
End-User Demographics:
- The primary end-users are domestic and international energy consumers. Growth in global energy demand fuels production.
- Industrial users contribute significantly to the downstream market.
Norway Oil and Gas Industry Growth Trends & Insights
This section examines the evolution of the Norwegian oil and gas market, incorporating quantitative data and qualitative insights. The market experienced a period of fluctuation from 2019 to 2024, influenced by global oil price volatility and the COVID-19 pandemic. However, the long-term outlook remains positive, driven by sustained global energy demand, new discoveries, and investments in gas infrastructure. We project a Compound Annual Growth Rate (CAGR) of xx% for the period 2025-2033, with market penetration reaching xx% by 2033. Technological advancements, including digitalization and automation, are improving efficiency and driving down production costs. Shifting consumer preferences towards cleaner energy sources are also impacting sector growth, fostering innovation in low-carbon technologies.
Dominant Regions, Countries, or Segments in Norway Oil and Gas Industry
The Norwegian Continental Shelf (NCS) is the dominant region for oil and gas production. The upstream sector represents the largest segment, followed by the midstream and downstream sectors. The dominance of the NCS is driven by several factors:
- Abundant reserves of oil and gas.
- Well-established infrastructure, including pipelines and processing facilities.
- Supportive government policies and regulations.
- Highly skilled workforce and advanced technological capabilities.
The upstream sector's growth is fueled by ongoing exploration activities and development of new fields. This sector is expected to account for xx% of the market's total value in 2033. The midstream segment, with its focus on transportation and storage, experiences steady growth, driven by increasing production and export volumes. The downstream segment's performance aligns with domestic energy consumption, which reflects overall economic growth and energy demand.
Norway Oil and Gas Industry Product Landscape
The Norwegian oil and gas industry is characterized by the production of a range of products, including crude oil, natural gas, and natural gas liquids (NGLs). Recent innovations focus on improving efficiency, reducing environmental impact, and maximizing recovery rates. Advancements in drilling technology, enhanced oil recovery (EOR) techniques, and subsea production systems are driving productivity gains. The emphasis is on high-quality products that meet international standards and cater to diverse consumer needs. Marketing strategies emphasize product reliability and environmental sustainability.
Key Drivers, Barriers & Challenges in Norway Oil and Gas Industry
Key Drivers:
- High global demand for energy, particularly natural gas.
- Significant remaining oil and gas reserves on the NCS.
- Government support for exploration and production activities.
- Technological advancements in exploration and production techniques.
Key Challenges and Restraints:
- Fluctuations in global oil and gas prices.
- Increasing environmental regulations and pressure to reduce carbon emissions.
- High capital expenditure requirements for new projects.
- Competition from renewable energy sources. The renewable sector is capturing an estimated xx% of the overall energy market.
Emerging Opportunities in Norway Oil and Gas Industry
- Increased investment in carbon capture, utilization, and storage (CCUS) technologies.
- Growing demand for natural gas as a transition fuel.
- Opportunities in offshore wind power development, leveraging existing infrastructure.
- Expansion into new markets and diversification of energy portfolios.
Growth Accelerators in the Norway Oil and Gas Industry
Long-term growth in the Norwegian oil and gas sector will be driven by sustained global energy demand, technological advancements, and strategic partnerships. Investments in CCUS technologies will become increasingly crucial for mitigating environmental impact. Exploration and production of new fields, leveraging advanced technologies like artificial intelligence (AI) and machine learning (ML), will continue to play a significant role. Furthermore, collaborations with international companies to share knowledge and expertise will strengthen Norway's position as a major energy player.
Key Players Shaping the Norway Oil and Gas Industry Market
- Equinor ASA
- Shell PLC
- DNO Norge AS
- Exxon Mobil Corporation
- Chevron Corporation
- Vr Energi AS
- Aker BP ASA
- Baker Hughes Company
- TotalEnergies SE
- Petoro AS
- Schlumberger Limited
Notable Milestones in Norway Oil and Gas Industry Sector
- March 2021: Equinor, Shell, TotalEnergies, and ConocoPhillips announced a USD 1 billion investment plan to electrify the Troll field.
- November 2021: Equinor announced plans to transition the Oseberg field from oil to primarily gas production.
- July 2021: Equinor announced a gas and condensate discovery on the NCS.
In-Depth Norway Oil and Gas Industry Market Outlook
The Norwegian oil and gas industry is poised for continued growth in the coming years, driven by strong global demand for energy and significant remaining reserves. The transition toward a lower-carbon future necessitates strategic investments in CCUS and renewable energy integration, creating new opportunities for innovation and collaboration. Companies that successfully adapt to these changes and invest in sustainable practices will be best positioned for long-term success. The market outlook reflects a positive trajectory, with opportunities for both established players and emerging companies to contribute to the evolving energy landscape.
Norway Oil and Gas Industry Segmentation
- 1. Upstream
- 2. Midstream
- 3. Downstream
Norway Oil and Gas Industry Segmentation By Geography
- 1. Norway
Norway Oil and Gas Industry REPORT HIGHLIGHTS
| Aspects | Details |
|---|---|
| Study Period | 2019-2033 |
| Base Year | 2024 |
| Estimated Year | 2025 |
| Forecast Period | 2025-2033 |
| Historical Period | 2019-2024 |
| Growth Rate | CAGR of > 7.50% from 2019-2033 |
| Segmentation |
|
Table of Contents
- 1. Introduction
- 1.1. Research Scope
- 1.2. Market Segmentation
- 1.3. Research Methodology
- 1.4. Definitions and Assumptions
- 2. Executive Summary
- 2.1. Introduction
- 3. Market Dynamics
- 3.1. Introduction
- 3.2. Market Drivers
- 3.2.1. 4.; Increasing Demand for Wood Pellets in Clean Energy Generation4.; Growing Wood Pellet Manufacturing Infrastructure
- 3.3. Market Restrains
- 3.3.1. 4.; The Adoption and Increasing Deployment of Alternative Renewable Energy
- 3.4. Market Trends
- 3.4.1. The Upstream Sector to Dominate the Market
- 4. Market Factor Analysis
- 4.1. Porters Five Forces
- 4.2. Supply/Value Chain
- 4.3. PESTEL analysis
- 4.4. Market Entropy
- 4.5. Patent/Trademark Analysis
- 5. Norway Oil and Gas Industry Analysis, Insights and Forecast, 2019-2031
- 5.1. Market Analysis, Insights and Forecast - by Upstream
- 5.2. Market Analysis, Insights and Forecast - by Midstream
- 5.3. Market Analysis, Insights and Forecast - by Downstream
- 5.4. Market Analysis, Insights and Forecast - by Region
- 5.4.1. Norway
- 5.1. Market Analysis, Insights and Forecast - by Upstream
- 6. Germany Norway Oil and Gas Industry Analysis, Insights and Forecast, 2019-2031
- 7. France Norway Oil and Gas Industry Analysis, Insights and Forecast, 2019-2031
- 8. Italy Norway Oil and Gas Industry Analysis, Insights and Forecast, 2019-2031
- 9. United Kingdom Norway Oil and Gas Industry Analysis, Insights and Forecast, 2019-2031
- 10. Netherlands Norway Oil and Gas Industry Analysis, Insights and Forecast, 2019-2031
- 11. Rest of Europe Norway Oil and Gas Industry Analysis, Insights and Forecast, 2019-2031
- 12. Competitive Analysis
- 12.1. Market Share Analysis 2024
- 12.2. Company Profiles
- 12.2.1 Equinor ASA
- 12.2.1.1. Overview
- 12.2.1.2. Products
- 12.2.1.3. SWOT Analysis
- 12.2.1.4. Recent Developments
- 12.2.1.5. Financials (Based on Availability)
- 12.2.2 Shell PLC
- 12.2.2.1. Overview
- 12.2.2.2. Products
- 12.2.2.3. SWOT Analysis
- 12.2.2.4. Recent Developments
- 12.2.2.5. Financials (Based on Availability)
- 12.2.3 DNO Norge AS
- 12.2.3.1. Overview
- 12.2.3.2. Products
- 12.2.3.3. SWOT Analysis
- 12.2.3.4. Recent Developments
- 12.2.3.5. Financials (Based on Availability)
- 12.2.4 Exxon Mobil Corporation
- 12.2.4.1. Overview
- 12.2.4.2. Products
- 12.2.4.3. SWOT Analysis
- 12.2.4.4. Recent Developments
- 12.2.4.5. Financials (Based on Availability)
- 12.2.5 Chevron Corporation
- 12.2.5.1. Overview
- 12.2.5.2. Products
- 12.2.5.3. SWOT Analysis
- 12.2.5.4. Recent Developments
- 12.2.5.5. Financials (Based on Availability)
- 12.2.6 Vr Energi AS*List Not Exhaustive
- 12.2.6.1. Overview
- 12.2.6.2. Products
- 12.2.6.3. SWOT Analysis
- 12.2.6.4. Recent Developments
- 12.2.6.5. Financials (Based on Availability)
- 12.2.7 Aker BP ASA
- 12.2.7.1. Overview
- 12.2.7.2. Products
- 12.2.7.3. SWOT Analysis
- 12.2.7.4. Recent Developments
- 12.2.7.5. Financials (Based on Availability)
- 12.2.8 Baker Hughes Company
- 12.2.8.1. Overview
- 12.2.8.2. Products
- 12.2.8.3. SWOT Analysis
- 12.2.8.4. Recent Developments
- 12.2.8.5. Financials (Based on Availability)
- 12.2.9 TotalEnergies SE
- 12.2.9.1. Overview
- 12.2.9.2. Products
- 12.2.9.3. SWOT Analysis
- 12.2.9.4. Recent Developments
- 12.2.9.5. Financials (Based on Availability)
- 12.2.10 Petoro AS
- 12.2.10.1. Overview
- 12.2.10.2. Products
- 12.2.10.3. SWOT Analysis
- 12.2.10.4. Recent Developments
- 12.2.10.5. Financials (Based on Availability)
- 12.2.11 Schlumberger Limited
- 12.2.11.1. Overview
- 12.2.11.2. Products
- 12.2.11.3. SWOT Analysis
- 12.2.11.4. Recent Developments
- 12.2.11.5. Financials (Based on Availability)
- 12.2.1 Equinor ASA
List of Figures
- Figure 1: Norway Oil and Gas Industry Revenue Breakdown (Million, %) by Product 2024 & 2032
- Figure 2: Norway Oil and Gas Industry Share (%) by Company 2024
List of Tables
- Table 1: Norway Oil and Gas Industry Revenue Million Forecast, by Region 2019 & 2032
- Table 2: Norway Oil and Gas Industry Volume Tonnes Forecast, by Region 2019 & 2032
- Table 3: Norway Oil and Gas Industry Revenue Million Forecast, by Upstream 2019 & 2032
- Table 4: Norway Oil and Gas Industry Volume Tonnes Forecast, by Upstream 2019 & 2032
- Table 5: Norway Oil and Gas Industry Revenue Million Forecast, by Midstream 2019 & 2032
- Table 6: Norway Oil and Gas Industry Volume Tonnes Forecast, by Midstream 2019 & 2032
- Table 7: Norway Oil and Gas Industry Revenue Million Forecast, by Downstream 2019 & 2032
- Table 8: Norway Oil and Gas Industry Volume Tonnes Forecast, by Downstream 2019 & 2032
- Table 9: Norway Oil and Gas Industry Revenue Million Forecast, by Region 2019 & 2032
- Table 10: Norway Oil and Gas Industry Volume Tonnes Forecast, by Region 2019 & 2032
- Table 11: Norway Oil and Gas Industry Revenue Million Forecast, by Country 2019 & 2032
- Table 12: Norway Oil and Gas Industry Volume Tonnes Forecast, by Country 2019 & 2032
- Table 13: Germany Norway Oil and Gas Industry Revenue (Million) Forecast, by Application 2019 & 2032
- Table 14: Germany Norway Oil and Gas Industry Volume (Tonnes) Forecast, by Application 2019 & 2032
- Table 15: France Norway Oil and Gas Industry Revenue (Million) Forecast, by Application 2019 & 2032
- Table 16: France Norway Oil and Gas Industry Volume (Tonnes) Forecast, by Application 2019 & 2032
- Table 17: Italy Norway Oil and Gas Industry Revenue (Million) Forecast, by Application 2019 & 2032
- Table 18: Italy Norway Oil and Gas Industry Volume (Tonnes) Forecast, by Application 2019 & 2032
- Table 19: United Kingdom Norway Oil and Gas Industry Revenue (Million) Forecast, by Application 2019 & 2032
- Table 20: United Kingdom Norway Oil and Gas Industry Volume (Tonnes) Forecast, by Application 2019 & 2032
- Table 21: Netherlands Norway Oil and Gas Industry Revenue (Million) Forecast, by Application 2019 & 2032
- Table 22: Netherlands Norway Oil and Gas Industry Volume (Tonnes) Forecast, by Application 2019 & 2032
- Table 23: Rest of Europe Norway Oil and Gas Industry Revenue (Million) Forecast, by Application 2019 & 2032
- Table 24: Rest of Europe Norway Oil and Gas Industry Volume (Tonnes) Forecast, by Application 2019 & 2032
- Table 25: Norway Oil and Gas Industry Revenue Million Forecast, by Upstream 2019 & 2032
- Table 26: Norway Oil and Gas Industry Volume Tonnes Forecast, by Upstream 2019 & 2032
- Table 27: Norway Oil and Gas Industry Revenue Million Forecast, by Midstream 2019 & 2032
- Table 28: Norway Oil and Gas Industry Volume Tonnes Forecast, by Midstream 2019 & 2032
- Table 29: Norway Oil and Gas Industry Revenue Million Forecast, by Downstream 2019 & 2032
- Table 30: Norway Oil and Gas Industry Volume Tonnes Forecast, by Downstream 2019 & 2032
- Table 31: Norway Oil and Gas Industry Revenue Million Forecast, by Country 2019 & 2032
- Table 32: Norway Oil and Gas Industry Volume Tonnes Forecast, by Country 2019 & 2032
Frequently Asked Questions
1. What is the projected Compound Annual Growth Rate (CAGR) of the Norway Oil and Gas Industry?
The projected CAGR is approximately > 7.50%.
2. Which companies are prominent players in the Norway Oil and Gas Industry?
Key companies in the market include Equinor ASA, Shell PLC, DNO Norge AS, Exxon Mobil Corporation, Chevron Corporation, Vr Energi AS*List Not Exhaustive, Aker BP ASA, Baker Hughes Company, TotalEnergies SE, Petoro AS, Schlumberger Limited.
3. What are the main segments of the Norway Oil and Gas Industry?
The market segments include Upstream, Midstream, Downstream.
4. Can you provide details about the market size?
The market size is estimated to be USD XX Million as of 2022.
5. What are some drivers contributing to market growth?
4.; Increasing Demand for Wood Pellets in Clean Energy Generation4.; Growing Wood Pellet Manufacturing Infrastructure.
6. What are the notable trends driving market growth?
The Upstream Sector to Dominate the Market.
7. Are there any restraints impacting market growth?
4.; The Adoption and Increasing Deployment of Alternative Renewable Energy.
8. Can you provide examples of recent developments in the market?
In March 2021, Equinor announced that it would be spending about USD 1 billion together with Shell, Total, and ConocoPhillips for a plan to provide low-carbon electricity to the giant Troll field in the North Sea.
9. What pricing options are available for accessing the report?
Pricing options include single-user, multi-user, and enterprise licenses priced at USD 3800, USD 4500, and USD 5800 respectively.
10. Is the market size provided in terms of value or volume?
The market size is provided in terms of value, measured in Million and volume, measured in Tonnes.
11. Are there any specific market keywords associated with the report?
Yes, the market keyword associated with the report is "Norway Oil and Gas Industry," which aids in identifying and referencing the specific market segment covered.
12. How do I determine which pricing option suits my needs best?
The pricing options vary based on user requirements and access needs. Individual users may opt for single-user licenses, while businesses requiring broader access may choose multi-user or enterprise licenses for cost-effective access to the report.
13. Are there any additional resources or data provided in the Norway Oil and Gas Industry report?
While the report offers comprehensive insights, it's advisable to review the specific contents or supplementary materials provided to ascertain if additional resources or data are available.
14. How can I stay updated on further developments or reports in the Norway Oil and Gas Industry?
To stay informed about further developments, trends, and reports in the Norway Oil and Gas Industry, consider subscribing to industry newsletters, following relevant companies and organizations, or regularly checking reputable industry news sources and publications.
Methodology
Step 1 - Identification of Relevant Samples Size from Population Database


Step 2 - Approaches for Defining Global Market Size (Value, Volume* & Price*)

Note*: In applicable scenarios
Step 3 - Data Sources
Primary Research
- Web Analytics
- Survey Reports
- Research Institute
- Latest Research Reports
- Opinion Leaders
Secondary Research
- Annual Reports
- White Paper
- Latest Press Release
- Industry Association
- Paid Database
- Investor Presentations

Step 4 - Data Triangulation
Involves using different sources of information in order to increase the validity of a study
These sources are likely to be stakeholders in a program - participants, other researchers, program staff, other community members, and so on.
Then we put all data in single framework & apply various statistical tools to find out the dynamic on the market.
During the analysis stage, feedback from the stakeholder groups would be compared to determine areas of agreement as well as areas of divergence
