

Key Insights
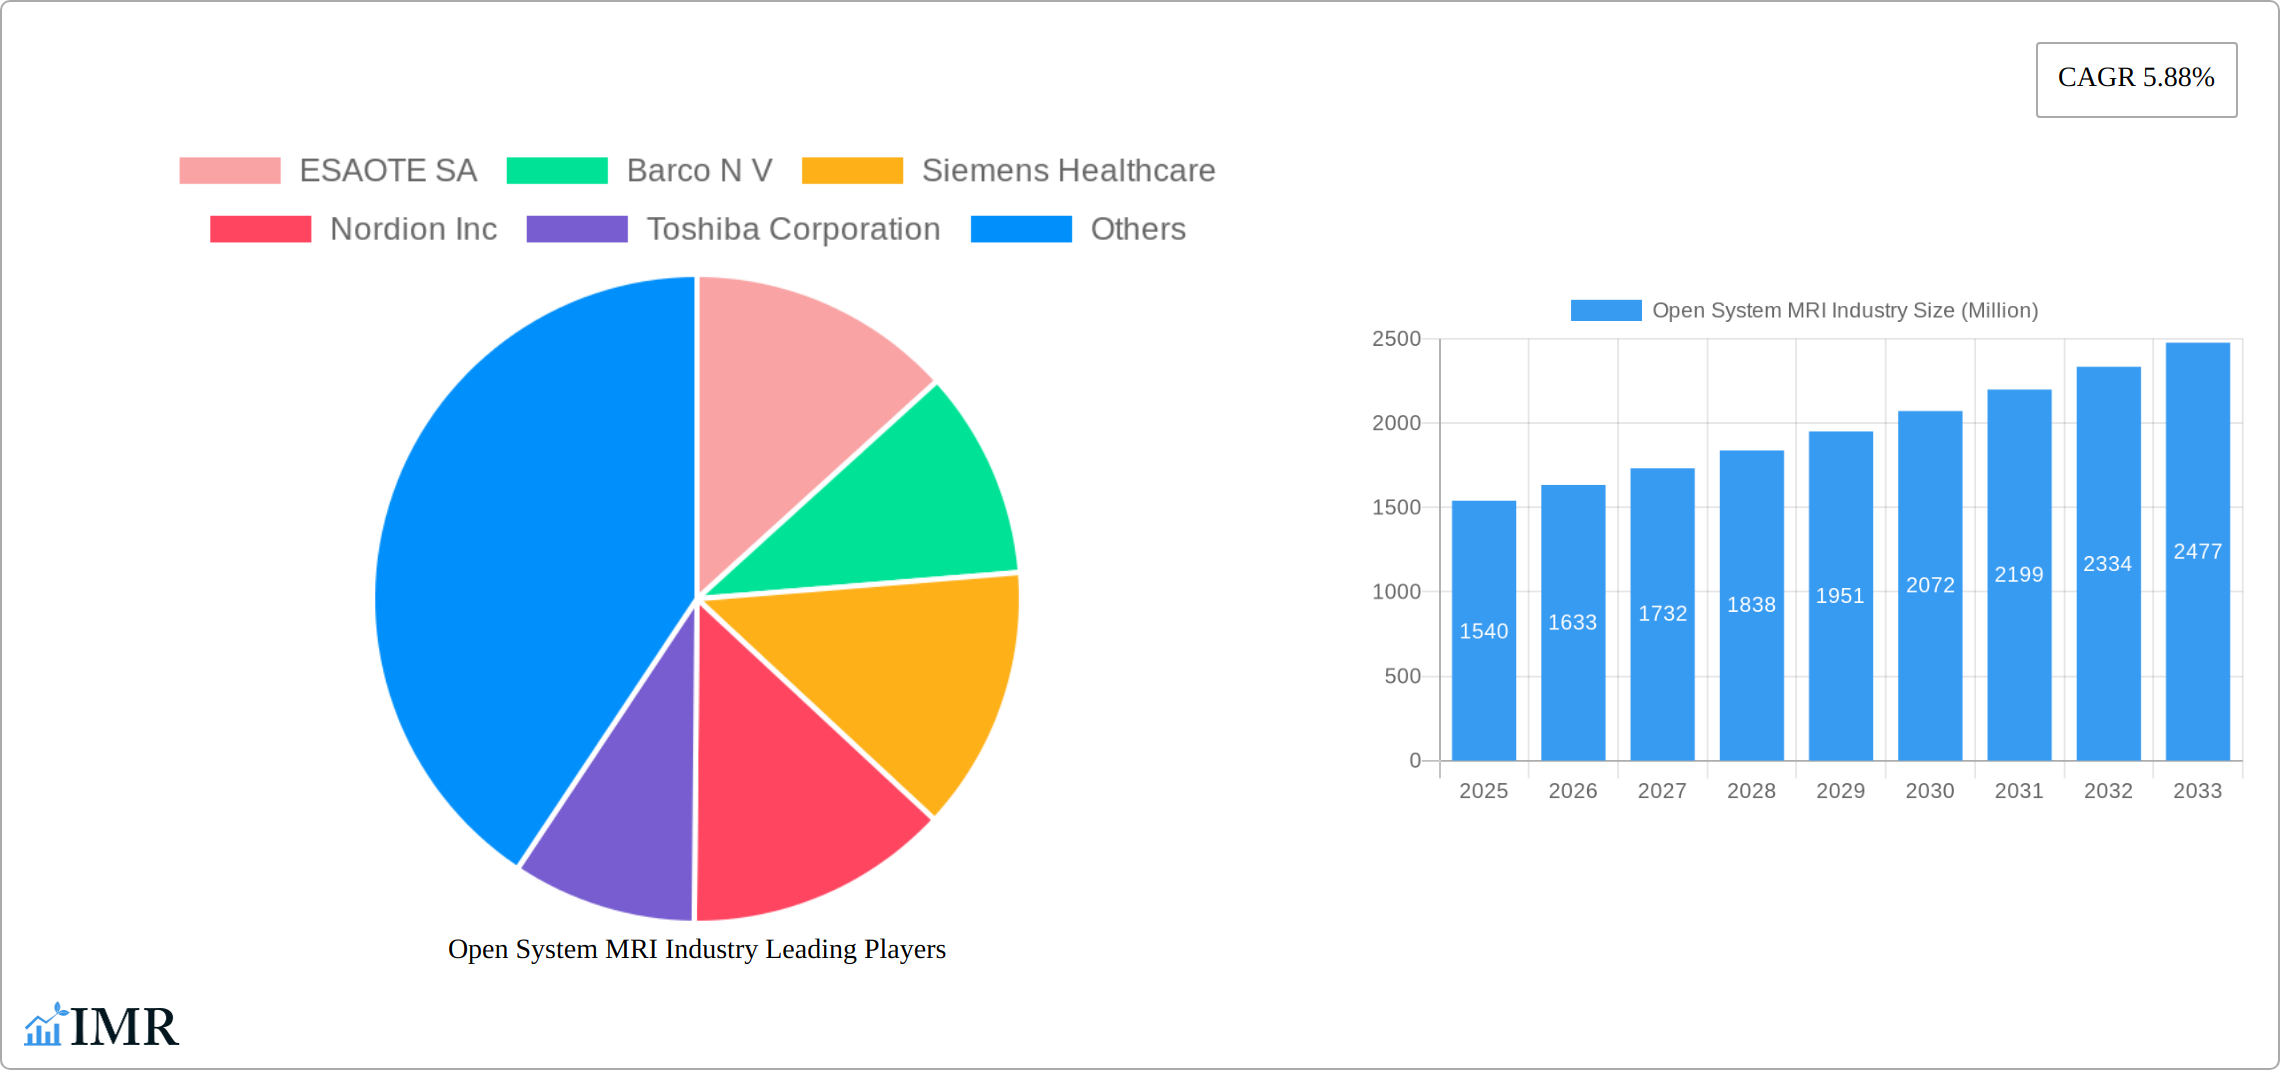
The Open System MRI market, valued at $1.54 billion in 2025, is projected to experience robust growth, driven by a Compound Annual Growth Rate (CAGR) of 5.88% from 2025 to 2033. This expansion is fueled by several key factors. Technological advancements leading to improved image quality, faster scan times, and enhanced patient comfort are significantly increasing the adoption of open MRI systems. The growing prevalence of neurological, cardiovascular, and oncological diseases necessitates advanced diagnostic imaging solutions, thereby driving market demand. Furthermore, the increasing preference for less claustrophobic imaging environments, particularly among patients with anxiety or claustrophobia, is significantly bolstering the market for open MRI systems. The rising geriatric population also contributes, as older adults often require more accessible and comfortable imaging procedures. Competition among key players like Siemens Healthcare, GE Healthcare, and Philips Healthcare is fostering innovation and driving down costs, making open MRI more accessible to healthcare providers.
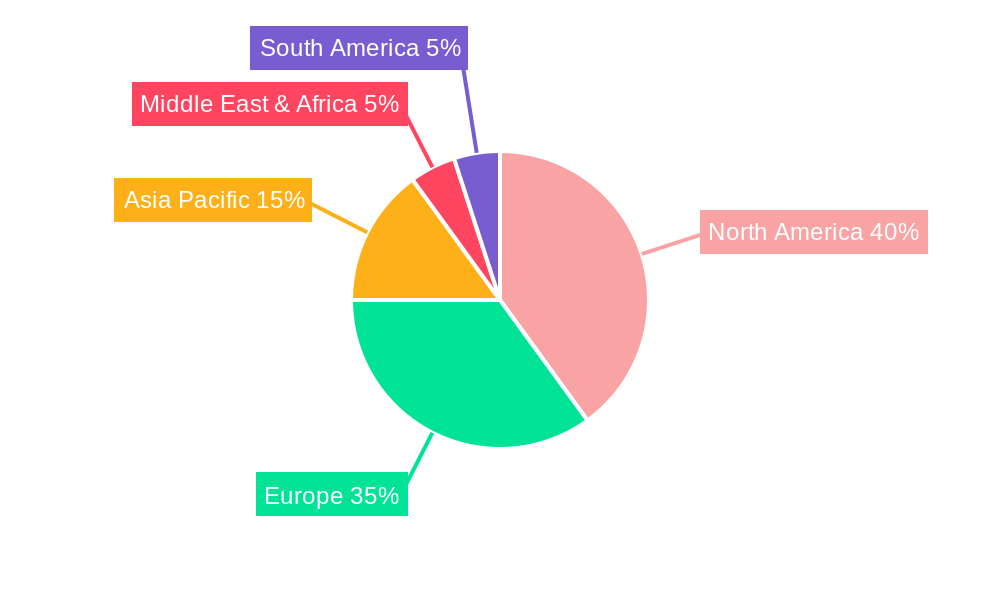
However, the market also faces certain challenges. The high initial investment cost associated with acquiring and maintaining open MRI systems can be a barrier for smaller healthcare facilities, particularly in developing regions. Additionally, the relatively lower spatial resolution compared to closed-system MRI, despite improvements, may limit its application in certain specialized procedures. Nevertheless, the ongoing technological advancements and the growing preference for patient-centric care are expected to outweigh these challenges, ensuring continued growth in the Open System MRI market throughout the forecast period. Regional variations will likely exist, with North America and Europe maintaining a strong market presence, while the Asia-Pacific region shows significant potential for growth, driven by increasing healthcare spending and rising awareness of advanced medical imaging techniques. The market segmentation by resolution (low, mid, high-field) and application (neurology, gastroenterology, cardiology, oncology) reflects the diverse range of applications and technological capabilities within the sector.
Open System MRI Industry Market Report: 2019-2033
This comprehensive report provides an in-depth analysis of the Open System MRI industry, encompassing market dynamics, growth trends, regional dominance, product landscape, and future outlook. The study period covers 2019-2033, with a base year of 2025 and a forecast period of 2025-2033. The report utilizes data from the historical period (2019-2024) and incorporates expert insights to deliver actionable intelligence for industry professionals. The parent market is the broader medical imaging equipment market, while the child market is specifically open system MRI systems.
Open System MRI Industry Market Dynamics & Structure
The open system MRI market is characterized by moderate concentration, with key players like GE Healthcare, Philips Healthcare, and Siemens Healthcare holding significant market share (estimated at xx% combined in 2025). Technological innovation, particularly in magnet technology and image processing, is a major driver, while regulatory frameworks concerning safety and efficacy influence market access. Competitive substitutes include other medical imaging modalities (CT, Ultrasound) limiting market growth to some extent, estimated at xx Million units in 2025. The end-user demographic comprises hospitals, clinics, and veterinary facilities. M&A activity has been relatively low in recent years, with an estimated xx deals in the past five years.
- Market Concentration: Moderately concentrated, with top players holding xx% market share.
- Technological Innovation: Focus on improved image quality, faster scan times, and enhanced patient comfort.
- Regulatory Landscape: Stringent safety and efficacy regulations impacting market entry.
- Competitive Substitutes: CT, Ultrasound, and X-ray imaging pose competitive challenges.
- End-User Demographics: Hospitals, clinics, veterinary hospitals, and research institutions.
- M&A Activity: Relatively low, with xx deals in the past five years.
Open System MRI Industry Growth Trends & Insights
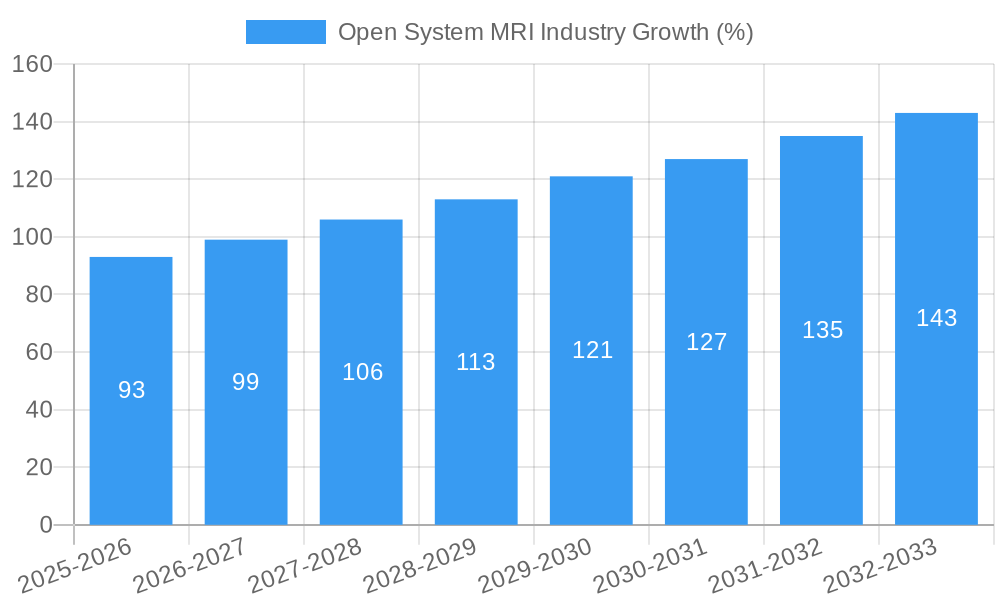
The global open system MRI market experienced significant growth from 2019 to 2024, reaching an estimated value of xx Million units in 2024. This growth is primarily attributed to increasing demand for non-invasive diagnostic imaging techniques, advancements in open MRI technology leading to improved image quality and patient comfort, and rising prevalence of chronic diseases requiring regular MRI scans. The market is expected to maintain a healthy Compound Annual Growth Rate (CAGR) of xx% during the forecast period (2025-2033), reaching an estimated xx Million units by 2033. Technological disruptions, such as the introduction of more powerful and versatile magnets, are expected to significantly impact market penetration. Shifts in consumer behavior, including increasing patient preference for less claustrophobic imaging environments, are further fueling market expansion.
Dominant Regions, Countries, or Segments in Open System MRI Industry
North America currently dominates the open system MRI market, holding the largest market share (estimated xx% in 2025) due to high healthcare expenditure, technological advancements, and robust regulatory frameworks. Europe and Asia Pacific are also experiencing substantial growth, driven by expanding healthcare infrastructure and increasing adoption rates in emerging economies. Within the segment breakdown:
By Resolution: High-field scanners dominate, accounting for xx% of the market in 2025, owing to their superior image quality. However, mid-field scanners are expected to show higher growth due to increasing affordability and ease of use.
By Application: Neurology and Oncology drive the largest share of applications, each representing approximately xx% of the market in 2025. This is largely attributed to the growing prevalence of neurological and oncological diseases.
Key Drivers in North America:
- High healthcare expenditure
- Advanced healthcare infrastructure
- Favorable regulatory environment
Key Drivers in Europe & Asia Pacific:
- Increasing healthcare expenditure
- Expanding healthcare infrastructure
- Rising prevalence of chronic diseases
Open System MRI Industry Product Landscape
The open system MRI market features a diverse range of products catering to various clinical needs and patient preferences. Recent innovations include advanced magnet technologies, improved software for image processing, and systems designed to enhance patient comfort and reduce claustrophobia. Many systems offer unique selling propositions such as reduced scan times, enhanced image resolution, and tailored applications for specific anatomical regions. This ongoing innovation pushes the industry forward, allowing for better diagnostic capabilities.
Key Drivers, Barriers & Challenges in Open System MRI Industry
Key Drivers:
- Technological advancements leading to improved image quality and patient comfort.
- Rising prevalence of chronic diseases necessitating advanced imaging techniques.
- Increasing healthcare expenditure globally.
Challenges and Restraints:
- High initial investment cost associated with open system MRI systems, limiting accessibility in resource-constrained settings.
- Intense competition among major players potentially leading to price wars and decreased profitability.
- Stringent regulatory approvals and compliance requirements. The process often leads to lengthy delays in new product launches, estimated to cause a xx Million units shortfall in the 2025 market.
Emerging Opportunities in Open System MRI Industry
- Expansion into emerging markets with growing healthcare infrastructure and unmet diagnostic needs.
- Development of specialized open MRI systems tailored for specific clinical applications.
- Integration of AI and machine learning for improved image analysis and diagnostic accuracy.
Growth Accelerators in the Open System MRI Industry
Strategic partnerships between technology providers and healthcare institutions will create streamlined workflows and access to advanced technologies, accelerating market growth. Furthermore, the introduction of innovative imaging techniques, such as compressed sensing, holds the potential to significantly reduce scan times and improve image quality, driving market expansion. Investment in research and development related to open MRI systems is vital for continued innovation and improvement.
Key Players Shaping the Open System MRI Industry Market
- ESAOTE SA
- Barco N V
- Siemens Healthcare
- Nordion Inc
- Toshiba Corporation
- Hologic Inc
- GE Healthcare
- Philips Healthcare
- Hitachi Medical Corporation
- Canon Medical Systems Corporation
- Onex Corporation (Carestream Health)
- Shimadzu Corporation
Notable Milestones in Open System MRI Industry Sector
- July 2022: Canon Medical launched a new open-bore 1.5T MRI system at ECR 2022, expanding its product portfolio in the growing 1.5T MR market segment.
- January 2023: Esaote North America, Inc. launched the Magnifico Vet Open MRI system, opening new avenues in veterinary diagnostics.
In-Depth Open System MRI Industry Market Outlook
The open system MRI market is poised for sustained growth, driven by technological advancements, expanding healthcare infrastructure, and the rising prevalence of chronic diseases. Strategic investments in R&D, coupled with strategic partnerships and market expansion initiatives, will further accelerate market growth. The focus on improved patient comfort and reduced scan times will significantly enhance the adoption rate, leading to substantial market expansion in the coming years.
Open System MRI Industry Segmentation
-
1. Resolution
- 1.1. Low- Field Scanner
- 1.2. Mid-field Scanner
- 1.3. High-Field Scanner
-
2. Application
- 2.1. Neurology
- 2.2. Gastroenterology
- 2.3. Cardiology
- 2.4. Oncology
- 2.5. Other Applications
Open System MRI Industry Segmentation By Geography
-
1. North America
- 1.1. United States
- 1.2. Canada
- 1.3. Mexico
-
2. Europe
- 2.1. Germany
- 2.2. United Kingdom
- 2.3. France
- 2.4. Italy
- 2.5. Spain
- 2.6. Rest of Europe
-
3. Asia Pacific
- 3.1. China
- 3.2. Japan
- 3.3. India
- 3.4. Australia
- 3.5. South Korea
- 3.6. Rest of Asia Pacific
-
4. Middle East and Africa
- 4.1. GCC
- 4.2. South Africa
- 4.3. Rest of Middle East and Africa
-
5. South America
- 5.1. Brazil
- 5.2. Argentina
- 5.3. Rest of South America
Open System MRI Industry REPORT HIGHLIGHTS
| Aspects | Details |
|---|---|
| Study Period | 2019-2033 |
| Base Year | 2024 |
| Estimated Year | 2025 |
| Forecast Period | 2025-2033 |
| Historical Period | 2019-2024 |
| Growth Rate | CAGR of 5.88% from 2019-2033 |
| Segmentation |
|
Table of Contents
- 1. Introduction
- 1.1. Research Scope
- 1.2. Market Segmentation
- 1.3. Research Methodology
- 1.4. Definitions and Assumptions
- 2. Executive Summary
- 2.1. Introduction
- 3. Market Dynamics
- 3.1. Introduction
- 3.2. Market Drivers
- 3.2.1. Increasing Number of MRI Procedures; Technological Developments in Open MRI System
- 3.3. Market Restrains
- 3.3.1. High Cost of Open MRI Systems
- 3.4. Market Trends
- 3.4.1. Neurology Segment is Expected to Witness Significant Growth Over the Forecast Period.
- 4. Market Factor Analysis
- 4.1. Porters Five Forces
- 4.2. Supply/Value Chain
- 4.3. PESTEL analysis
- 4.4. Market Entropy
- 4.5. Patent/Trademark Analysis
- 5. Global Open System MRI Industry Analysis, Insights and Forecast, 2019-2031
- 5.1. Market Analysis, Insights and Forecast - by Resolution
- 5.1.1. Low- Field Scanner
- 5.1.2. Mid-field Scanner
- 5.1.3. High-Field Scanner
- 5.2. Market Analysis, Insights and Forecast - by Application
- 5.2.1. Neurology
- 5.2.2. Gastroenterology
- 5.2.3. Cardiology
- 5.2.4. Oncology
- 5.2.5. Other Applications
- 5.3. Market Analysis, Insights and Forecast - by Region
- 5.3.1. North America
- 5.3.2. Europe
- 5.3.3. Asia Pacific
- 5.3.4. Middle East and Africa
- 5.3.5. South America
- 5.1. Market Analysis, Insights and Forecast - by Resolution
- 6. North America Open System MRI Industry Analysis, Insights and Forecast, 2019-2031
- 6.1. Market Analysis, Insights and Forecast - by Resolution
- 6.1.1. Low- Field Scanner
- 6.1.2. Mid-field Scanner
- 6.1.3. High-Field Scanner
- 6.2. Market Analysis, Insights and Forecast - by Application
- 6.2.1. Neurology
- 6.2.2. Gastroenterology
- 6.2.3. Cardiology
- 6.2.4. Oncology
- 6.2.5. Other Applications
- 6.1. Market Analysis, Insights and Forecast - by Resolution
- 7. Europe Open System MRI Industry Analysis, Insights and Forecast, 2019-2031
- 7.1. Market Analysis, Insights and Forecast - by Resolution
- 7.1.1. Low- Field Scanner
- 7.1.2. Mid-field Scanner
- 7.1.3. High-Field Scanner
- 7.2. Market Analysis, Insights and Forecast - by Application
- 7.2.1. Neurology
- 7.2.2. Gastroenterology
- 7.2.3. Cardiology
- 7.2.4. Oncology
- 7.2.5. Other Applications
- 7.1. Market Analysis, Insights and Forecast - by Resolution
- 8. Asia Pacific Open System MRI Industry Analysis, Insights and Forecast, 2019-2031
- 8.1. Market Analysis, Insights and Forecast - by Resolution
- 8.1.1. Low- Field Scanner
- 8.1.2. Mid-field Scanner
- 8.1.3. High-Field Scanner
- 8.2. Market Analysis, Insights and Forecast - by Application
- 8.2.1. Neurology
- 8.2.2. Gastroenterology
- 8.2.3. Cardiology
- 8.2.4. Oncology
- 8.2.5. Other Applications
- 8.1. Market Analysis, Insights and Forecast - by Resolution
- 9. Middle East and Africa Open System MRI Industry Analysis, Insights and Forecast, 2019-2031
- 9.1. Market Analysis, Insights and Forecast - by Resolution
- 9.1.1. Low- Field Scanner
- 9.1.2. Mid-field Scanner
- 9.1.3. High-Field Scanner
- 9.2. Market Analysis, Insights and Forecast - by Application
- 9.2.1. Neurology
- 9.2.2. Gastroenterology
- 9.2.3. Cardiology
- 9.2.4. Oncology
- 9.2.5. Other Applications
- 9.1. Market Analysis, Insights and Forecast - by Resolution
- 10. South America Open System MRI Industry Analysis, Insights and Forecast, 2019-2031
- 10.1. Market Analysis, Insights and Forecast - by Resolution
- 10.1.1. Low- Field Scanner
- 10.1.2. Mid-field Scanner
- 10.1.3. High-Field Scanner
- 10.2. Market Analysis, Insights and Forecast - by Application
- 10.2.1. Neurology
- 10.2.2. Gastroenterology
- 10.2.3. Cardiology
- 10.2.4. Oncology
- 10.2.5. Other Applications
- 10.1. Market Analysis, Insights and Forecast - by Resolution
- 11. North America Open System MRI Industry Analysis, Insights and Forecast, 2019-2031
- 11.1. Market Analysis, Insights and Forecast - By Country/Sub-region
- 11.1.1 United States
- 11.1.2 Canada
- 11.1.3 Mexico
- 12. Europe Open System MRI Industry Analysis, Insights and Forecast, 2019-2031
- 12.1. Market Analysis, Insights and Forecast - By Country/Sub-region
- 12.1.1 Germany
- 12.1.2 United Kingdom
- 12.1.3 France
- 12.1.4 Italy
- 12.1.5 Spain
- 12.1.6 Rest of Europe
- 13. Asia Pacific Open System MRI Industry Analysis, Insights and Forecast, 2019-2031
- 13.1. Market Analysis, Insights and Forecast - By Country/Sub-region
- 13.1.1 China
- 13.1.2 Japan
- 13.1.3 India
- 13.1.4 Australia
- 13.1.5 South Korea
- 13.1.6 Rest of Asia Pacific
- 14. Middle East and Africa Open System MRI Industry Analysis, Insights and Forecast, 2019-2031
- 14.1. Market Analysis, Insights and Forecast - By Country/Sub-region
- 14.1.1 GCC
- 14.1.2 South Africa
- 14.1.3 Rest of Middle East and Africa
- 15. South America Open System MRI Industry Analysis, Insights and Forecast, 2019-2031
- 15.1. Market Analysis, Insights and Forecast - By Country/Sub-region
- 15.1.1 Brazil
- 15.1.2 Argentina
- 15.1.3 Rest of South America
- 16. Competitive Analysis
- 16.1. Global Market Share Analysis 2024
- 16.2. Company Profiles
- 16.2.1 ESAOTE SA
- 16.2.1.1. Overview
- 16.2.1.2. Products
- 16.2.1.3. SWOT Analysis
- 16.2.1.4. Recent Developments
- 16.2.1.5. Financials (Based on Availability)
- 16.2.2 Barco N V
- 16.2.2.1. Overview
- 16.2.2.2. Products
- 16.2.2.3. SWOT Analysis
- 16.2.2.4. Recent Developments
- 16.2.2.5. Financials (Based on Availability)
- 16.2.3 Siemens Healthcare
- 16.2.3.1. Overview
- 16.2.3.2. Products
- 16.2.3.3. SWOT Analysis
- 16.2.3.4. Recent Developments
- 16.2.3.5. Financials (Based on Availability)
- 16.2.4 Nordion Inc
- 16.2.4.1. Overview
- 16.2.4.2. Products
- 16.2.4.3. SWOT Analysis
- 16.2.4.4. Recent Developments
- 16.2.4.5. Financials (Based on Availability)
- 16.2.5 Toshiba Corporation
- 16.2.5.1. Overview
- 16.2.5.2. Products
- 16.2.5.3. SWOT Analysis
- 16.2.5.4. Recent Developments
- 16.2.5.5. Financials (Based on Availability)
- 16.2.6 Hologic Inc
- 16.2.6.1. Overview
- 16.2.6.2. Products
- 16.2.6.3. SWOT Analysis
- 16.2.6.4. Recent Developments
- 16.2.6.5. Financials (Based on Availability)
- 16.2.7 GE Healthcare
- 16.2.7.1. Overview
- 16.2.7.2. Products
- 16.2.7.3. SWOT Analysis
- 16.2.7.4. Recent Developments
- 16.2.7.5. Financials (Based on Availability)
- 16.2.8 Philips Healthcare
- 16.2.8.1. Overview
- 16.2.8.2. Products
- 16.2.8.3. SWOT Analysis
- 16.2.8.4. Recent Developments
- 16.2.8.5. Financials (Based on Availability)
- 16.2.9 Hitachi Medical Corporation
- 16.2.9.1. Overview
- 16.2.9.2. Products
- 16.2.9.3. SWOT Analysis
- 16.2.9.4. Recent Developments
- 16.2.9.5. Financials (Based on Availability)
- 16.2.10 Canon Medical Systems Corporation
- 16.2.10.1. Overview
- 16.2.10.2. Products
- 16.2.10.3. SWOT Analysis
- 16.2.10.4. Recent Developments
- 16.2.10.5. Financials (Based on Availability)
- 16.2.11 Onex Corporation (Carestream Health)
- 16.2.11.1. Overview
- 16.2.11.2. Products
- 16.2.11.3. SWOT Analysis
- 16.2.11.4. Recent Developments
- 16.2.11.5. Financials (Based on Availability)
- 16.2.12 Shimadzu Corporation
- 16.2.12.1. Overview
- 16.2.12.2. Products
- 16.2.12.3. SWOT Analysis
- 16.2.12.4. Recent Developments
- 16.2.12.5. Financials (Based on Availability)
- 16.2.1 ESAOTE SA
List of Figures
- Figure 1: Global Open System MRI Industry Revenue Breakdown (Million, %) by Region 2024 & 2032
- Figure 2: North America Open System MRI Industry Revenue (Million), by Country 2024 & 2032
- Figure 3: North America Open System MRI Industry Revenue Share (%), by Country 2024 & 2032
- Figure 4: Europe Open System MRI Industry Revenue (Million), by Country 2024 & 2032
- Figure 5: Europe Open System MRI Industry Revenue Share (%), by Country 2024 & 2032
- Figure 6: Asia Pacific Open System MRI Industry Revenue (Million), by Country 2024 & 2032
- Figure 7: Asia Pacific Open System MRI Industry Revenue Share (%), by Country 2024 & 2032
- Figure 8: Middle East and Africa Open System MRI Industry Revenue (Million), by Country 2024 & 2032
- Figure 9: Middle East and Africa Open System MRI Industry Revenue Share (%), by Country 2024 & 2032
- Figure 10: South America Open System MRI Industry Revenue (Million), by Country 2024 & 2032
- Figure 11: South America Open System MRI Industry Revenue Share (%), by Country 2024 & 2032
- Figure 12: North America Open System MRI Industry Revenue (Million), by Resolution 2024 & 2032
- Figure 13: North America Open System MRI Industry Revenue Share (%), by Resolution 2024 & 2032
- Figure 14: North America Open System MRI Industry Revenue (Million), by Application 2024 & 2032
- Figure 15: North America Open System MRI Industry Revenue Share (%), by Application 2024 & 2032
- Figure 16: North America Open System MRI Industry Revenue (Million), by Country 2024 & 2032
- Figure 17: North America Open System MRI Industry Revenue Share (%), by Country 2024 & 2032
- Figure 18: Europe Open System MRI Industry Revenue (Million), by Resolution 2024 & 2032
- Figure 19: Europe Open System MRI Industry Revenue Share (%), by Resolution 2024 & 2032
- Figure 20: Europe Open System MRI Industry Revenue (Million), by Application 2024 & 2032
- Figure 21: Europe Open System MRI Industry Revenue Share (%), by Application 2024 & 2032
- Figure 22: Europe Open System MRI Industry Revenue (Million), by Country 2024 & 2032
- Figure 23: Europe Open System MRI Industry Revenue Share (%), by Country 2024 & 2032
- Figure 24: Asia Pacific Open System MRI Industry Revenue (Million), by Resolution 2024 & 2032
- Figure 25: Asia Pacific Open System MRI Industry Revenue Share (%), by Resolution 2024 & 2032
- Figure 26: Asia Pacific Open System MRI Industry Revenue (Million), by Application 2024 & 2032
- Figure 27: Asia Pacific Open System MRI Industry Revenue Share (%), by Application 2024 & 2032
- Figure 28: Asia Pacific Open System MRI Industry Revenue (Million), by Country 2024 & 2032
- Figure 29: Asia Pacific Open System MRI Industry Revenue Share (%), by Country 2024 & 2032
- Figure 30: Middle East and Africa Open System MRI Industry Revenue (Million), by Resolution 2024 & 2032
- Figure 31: Middle East and Africa Open System MRI Industry Revenue Share (%), by Resolution 2024 & 2032
- Figure 32: Middle East and Africa Open System MRI Industry Revenue (Million), by Application 2024 & 2032
- Figure 33: Middle East and Africa Open System MRI Industry Revenue Share (%), by Application 2024 & 2032
- Figure 34: Middle East and Africa Open System MRI Industry Revenue (Million), by Country 2024 & 2032
- Figure 35: Middle East and Africa Open System MRI Industry Revenue Share (%), by Country 2024 & 2032
- Figure 36: South America Open System MRI Industry Revenue (Million), by Resolution 2024 & 2032
- Figure 37: South America Open System MRI Industry Revenue Share (%), by Resolution 2024 & 2032
- Figure 38: South America Open System MRI Industry Revenue (Million), by Application 2024 & 2032
- Figure 39: South America Open System MRI Industry Revenue Share (%), by Application 2024 & 2032
- Figure 40: South America Open System MRI Industry Revenue (Million), by Country 2024 & 2032
- Figure 41: South America Open System MRI Industry Revenue Share (%), by Country 2024 & 2032
List of Tables
- Table 1: Global Open System MRI Industry Revenue Million Forecast, by Region 2019 & 2032
- Table 2: Global Open System MRI Industry Revenue Million Forecast, by Resolution 2019 & 2032
- Table 3: Global Open System MRI Industry Revenue Million Forecast, by Application 2019 & 2032
- Table 4: Global Open System MRI Industry Revenue Million Forecast, by Region 2019 & 2032
- Table 5: Global Open System MRI Industry Revenue Million Forecast, by Country 2019 & 2032
- Table 6: United States Open System MRI Industry Revenue (Million) Forecast, by Application 2019 & 2032
- Table 7: Canada Open System MRI Industry Revenue (Million) Forecast, by Application 2019 & 2032
- Table 8: Mexico Open System MRI Industry Revenue (Million) Forecast, by Application 2019 & 2032
- Table 9: Global Open System MRI Industry Revenue Million Forecast, by Country 2019 & 2032
- Table 10: Germany Open System MRI Industry Revenue (Million) Forecast, by Application 2019 & 2032
- Table 11: United Kingdom Open System MRI Industry Revenue (Million) Forecast, by Application 2019 & 2032
- Table 12: France Open System MRI Industry Revenue (Million) Forecast, by Application 2019 & 2032
- Table 13: Italy Open System MRI Industry Revenue (Million) Forecast, by Application 2019 & 2032
- Table 14: Spain Open System MRI Industry Revenue (Million) Forecast, by Application 2019 & 2032
- Table 15: Rest of Europe Open System MRI Industry Revenue (Million) Forecast, by Application 2019 & 2032
- Table 16: Global Open System MRI Industry Revenue Million Forecast, by Country 2019 & 2032
- Table 17: China Open System MRI Industry Revenue (Million) Forecast, by Application 2019 & 2032
- Table 18: Japan Open System MRI Industry Revenue (Million) Forecast, by Application 2019 & 2032
- Table 19: India Open System MRI Industry Revenue (Million) Forecast, by Application 2019 & 2032
- Table 20: Australia Open System MRI Industry Revenue (Million) Forecast, by Application 2019 & 2032
- Table 21: South Korea Open System MRI Industry Revenue (Million) Forecast, by Application 2019 & 2032
- Table 22: Rest of Asia Pacific Open System MRI Industry Revenue (Million) Forecast, by Application 2019 & 2032
- Table 23: Global Open System MRI Industry Revenue Million Forecast, by Country 2019 & 2032
- Table 24: GCC Open System MRI Industry Revenue (Million) Forecast, by Application 2019 & 2032
- Table 25: South Africa Open System MRI Industry Revenue (Million) Forecast, by Application 2019 & 2032
- Table 26: Rest of Middle East and Africa Open System MRI Industry Revenue (Million) Forecast, by Application 2019 & 2032
- Table 27: Global Open System MRI Industry Revenue Million Forecast, by Country 2019 & 2032
- Table 28: Brazil Open System MRI Industry Revenue (Million) Forecast, by Application 2019 & 2032
- Table 29: Argentina Open System MRI Industry Revenue (Million) Forecast, by Application 2019 & 2032
- Table 30: Rest of South America Open System MRI Industry Revenue (Million) Forecast, by Application 2019 & 2032
- Table 31: Global Open System MRI Industry Revenue Million Forecast, by Resolution 2019 & 2032
- Table 32: Global Open System MRI Industry Revenue Million Forecast, by Application 2019 & 2032
- Table 33: Global Open System MRI Industry Revenue Million Forecast, by Country 2019 & 2032
- Table 34: United States Open System MRI Industry Revenue (Million) Forecast, by Application 2019 & 2032
- Table 35: Canada Open System MRI Industry Revenue (Million) Forecast, by Application 2019 & 2032
- Table 36: Mexico Open System MRI Industry Revenue (Million) Forecast, by Application 2019 & 2032
- Table 37: Global Open System MRI Industry Revenue Million Forecast, by Resolution 2019 & 2032
- Table 38: Global Open System MRI Industry Revenue Million Forecast, by Application 2019 & 2032
- Table 39: Global Open System MRI Industry Revenue Million Forecast, by Country 2019 & 2032
- Table 40: Germany Open System MRI Industry Revenue (Million) Forecast, by Application 2019 & 2032
- Table 41: United Kingdom Open System MRI Industry Revenue (Million) Forecast, by Application 2019 & 2032
- Table 42: France Open System MRI Industry Revenue (Million) Forecast, by Application 2019 & 2032
- Table 43: Italy Open System MRI Industry Revenue (Million) Forecast, by Application 2019 & 2032
- Table 44: Spain Open System MRI Industry Revenue (Million) Forecast, by Application 2019 & 2032
- Table 45: Rest of Europe Open System MRI Industry Revenue (Million) Forecast, by Application 2019 & 2032
- Table 46: Global Open System MRI Industry Revenue Million Forecast, by Resolution 2019 & 2032
- Table 47: Global Open System MRI Industry Revenue Million Forecast, by Application 2019 & 2032
- Table 48: Global Open System MRI Industry Revenue Million Forecast, by Country 2019 & 2032
- Table 49: China Open System MRI Industry Revenue (Million) Forecast, by Application 2019 & 2032
- Table 50: Japan Open System MRI Industry Revenue (Million) Forecast, by Application 2019 & 2032
- Table 51: India Open System MRI Industry Revenue (Million) Forecast, by Application 2019 & 2032
- Table 52: Australia Open System MRI Industry Revenue (Million) Forecast, by Application 2019 & 2032
- Table 53: South Korea Open System MRI Industry Revenue (Million) Forecast, by Application 2019 & 2032
- Table 54: Rest of Asia Pacific Open System MRI Industry Revenue (Million) Forecast, by Application 2019 & 2032
- Table 55: Global Open System MRI Industry Revenue Million Forecast, by Resolution 2019 & 2032
- Table 56: Global Open System MRI Industry Revenue Million Forecast, by Application 2019 & 2032
- Table 57: Global Open System MRI Industry Revenue Million Forecast, by Country 2019 & 2032
- Table 58: GCC Open System MRI Industry Revenue (Million) Forecast, by Application 2019 & 2032
- Table 59: South Africa Open System MRI Industry Revenue (Million) Forecast, by Application 2019 & 2032
- Table 60: Rest of Middle East and Africa Open System MRI Industry Revenue (Million) Forecast, by Application 2019 & 2032
- Table 61: Global Open System MRI Industry Revenue Million Forecast, by Resolution 2019 & 2032
- Table 62: Global Open System MRI Industry Revenue Million Forecast, by Application 2019 & 2032
- Table 63: Global Open System MRI Industry Revenue Million Forecast, by Country 2019 & 2032
- Table 64: Brazil Open System MRI Industry Revenue (Million) Forecast, by Application 2019 & 2032
- Table 65: Argentina Open System MRI Industry Revenue (Million) Forecast, by Application 2019 & 2032
- Table 66: Rest of South America Open System MRI Industry Revenue (Million) Forecast, by Application 2019 & 2032
Frequently Asked Questions
1. What is the projected Compound Annual Growth Rate (CAGR) of the Open System MRI Industry?
The projected CAGR is approximately 5.88%.
2. Which companies are prominent players in the Open System MRI Industry?
Key companies in the market include ESAOTE SA, Barco N V, Siemens Healthcare, Nordion Inc, Toshiba Corporation, Hologic Inc, GE Healthcare, Philips Healthcare, Hitachi Medical Corporation, Canon Medical Systems Corporation, Onex Corporation (Carestream Health), Shimadzu Corporation.
3. What are the main segments of the Open System MRI Industry?
The market segments include Resolution, Application.
4. Can you provide details about the market size?
The market size is estimated to be USD 1.54 Million as of 2022.
5. What are some drivers contributing to market growth?
Increasing Number of MRI Procedures; Technological Developments in Open MRI System.
6. What are the notable trends driving market growth?
Neurology Segment is Expected to Witness Significant Growth Over the Forecast Period..
7. Are there any restraints impacting market growth?
High Cost of Open MRI Systems.
8. Can you provide examples of recent developments in the market?
January 2023: Esaote North America, Inc. launched the Magnifico Vet Open MRI system, a new imaging solution uniquely suited to provide diagnostic efficacy in a variety of veterinary hospitals.
9. What pricing options are available for accessing the report?
Pricing options include single-user, multi-user, and enterprise licenses priced at USD 4750, USD 5250, and USD 8750 respectively.
10. Is the market size provided in terms of value or volume?
The market size is provided in terms of value, measured in Million.
11. Are there any specific market keywords associated with the report?
Yes, the market keyword associated with the report is "Open System MRI Industry," which aids in identifying and referencing the specific market segment covered.
12. How do I determine which pricing option suits my needs best?
The pricing options vary based on user requirements and access needs. Individual users may opt for single-user licenses, while businesses requiring broader access may choose multi-user or enterprise licenses for cost-effective access to the report.
13. Are there any additional resources or data provided in the Open System MRI Industry report?
While the report offers comprehensive insights, it's advisable to review the specific contents or supplementary materials provided to ascertain if additional resources or data are available.
14. How can I stay updated on further developments or reports in the Open System MRI Industry?
To stay informed about further developments, trends, and reports in the Open System MRI Industry, consider subscribing to industry newsletters, following relevant companies and organizations, or regularly checking reputable industry news sources and publications.
Methodology
Step 1 - Identification of Relevant Samples Size from Population Database


Step 2 - Approaches for Defining Global Market Size (Value, Volume* & Price*)

Note*: In applicable scenarios
Step 3 - Data Sources
Primary Research
- Web Analytics
- Survey Reports
- Research Institute
- Latest Research Reports
- Opinion Leaders
Secondary Research
- Annual Reports
- White Paper
- Latest Press Release
- Industry Association
- Paid Database
- Investor Presentations

Step 4 - Data Triangulation
Involves using different sources of information in order to increase the validity of a study
These sources are likely to be stakeholders in a program - participants, other researchers, program staff, other community members, and so on.
Then we put all data in single framework & apply various statistical tools to find out the dynamic on the market.
During the analysis stage, feedback from the stakeholder groups would be compared to determine areas of agreement as well as areas of divergence
