

Key Insights
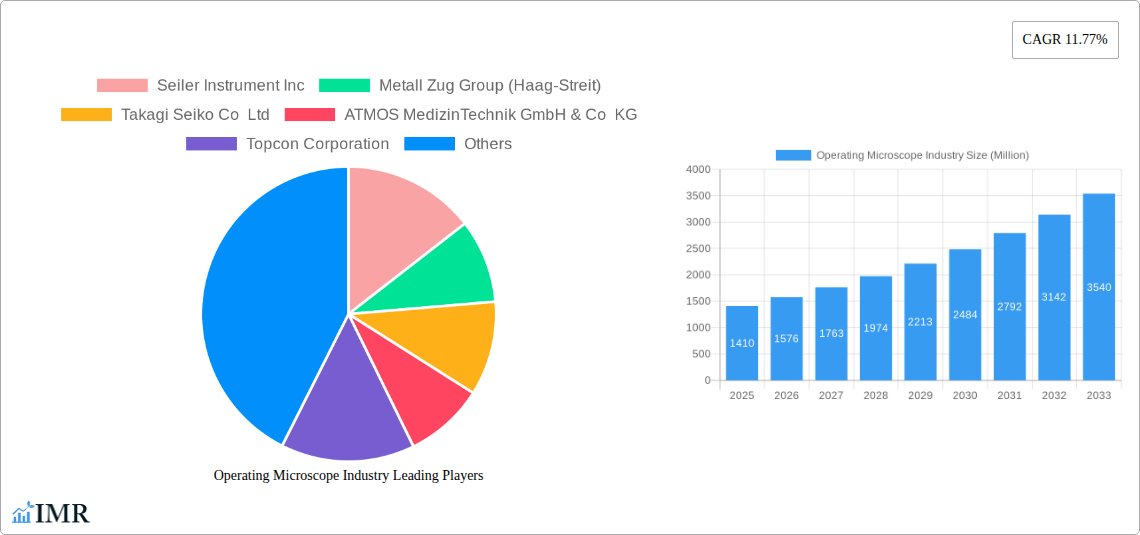
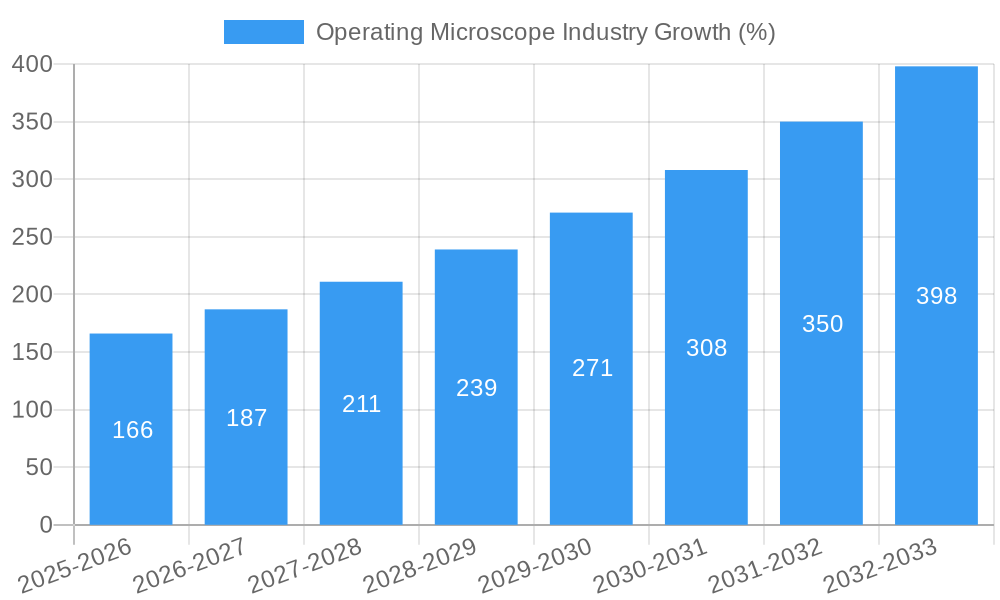
The global operating microscope market, valued at $1.41 billion in 2025, is projected to experience robust growth, exhibiting a compound annual growth rate (CAGR) of 11.77% from 2025 to 2033. This expansion is driven by several key factors. Firstly, the increasing prevalence of minimally invasive surgeries across various specialties like neurosurgery, ophthalmology, and plastic surgery fuels demand for advanced imaging and precision instruments. Technological advancements, such as integration of digital imaging, 3D visualization, and robotic assistance, are enhancing surgical precision and outcomes, further boosting market growth. The growing geriatric population, susceptible to age-related conditions requiring microsurgery, also contributes significantly. Furthermore, expanding healthcare infrastructure in developing economies, particularly in Asia-Pacific, presents lucrative growth opportunities for operating microscope manufacturers. However, the high initial investment cost associated with purchasing and maintaining these advanced devices and the availability of alternative surgical techniques might pose some challenges to market growth. The market is segmented by end-user (hospitals, ambulatory surgical centers, others) and application (dentistry, gynecology & urology, ENT, neurosurgery & spine surgery, ophthalmology, plastic & reconstructive surgery, others), with hospitals and neurosurgery/spine surgery currently dominating each respective segment. Major players like Leica Microsystems (Danaher Corporation), Zeiss, Olympus, and Haag-Streit are driving innovation and competition within the market.
The projected growth trajectory indicates a significant market expansion over the forecast period. Considering the CAGR of 11.77%, a reasonable estimation suggests market values exceeding $3 billion by 2033. This strong growth is anticipated to be fueled by continued technological advancements leading to improved surgical outcomes and increased adoption in emerging markets. The competitive landscape is characterized by established players and emerging companies, leading to innovations and increased accessibility of advanced operating microscopes. Strategic collaborations and mergers & acquisitions are expected to shape the competitive dynamics in the coming years. Focus on developing user-friendly, cost-effective, and compact operating microscopes tailored to the needs of smaller clinics and hospitals will also play a crucial role in expanding the market reach.
Operating Microscope Industry Market Report: 2019-2033
This comprehensive report provides a detailed analysis of the Operating Microscope market, encompassing market dynamics, growth trends, regional insights, product landscapes, key players, and future outlook. The report covers the period from 2019 to 2033, with a focus on the forecast period 2025-2033 and a base year of 2025. The study meticulously examines the parent market (Medical Devices) and its child market (Surgical Microscopes), delivering actionable insights for industry professionals, investors, and strategic decision-makers. The market size is valued in Million units throughout the report.
Operating Microscope Industry Market Dynamics & Structure
The operating microscope market is characterized by a moderately consolidated structure, with several key players holding significant market share. Technological innovation, particularly in areas like 3D imaging, fluorescence, and digital integration, is a primary growth driver. Stringent regulatory frameworks, particularly concerning medical device approvals (e.g., FDA, CE Mark), shape market entry and product development. While competing technologies exist (e.g., endoscopes for minimally invasive procedures), operating microscopes maintain their dominance in many surgical specializations due to their superior visualization capabilities. The end-user demographic is largely driven by the growth of hospitals and ambulatory surgical centers, with a diverse range of surgical applications driving market demand. M&A activity has been moderate, with xx deals recorded between 2019 and 2024, largely focused on expanding distribution networks and enhancing technological capabilities.
- Market Concentration: Moderately consolidated, with top 5 players holding xx% market share in 2024.
- Technological Innovation: 3D imaging, fluorescence microscopy, and digital integration are key drivers.
- Regulatory Landscape: Stringent approvals (FDA, CE Mark) influence market access and product development.
- Competitive Substitutes: Endoscopes present some competition, but operating microscopes remain dominant in many applications.
- M&A Activity: xx deals recorded between 2019 and 2024, focusing on expansion and technology acquisition.
- Innovation Barriers: High R&D costs, stringent regulatory pathways, and intense competition.
Operating Microscope Industry Growth Trends & Insights
The global operating microscope market experienced a CAGR of xx% during the historical period (2019-2024), reaching a market size of xx Million units in 2024. This growth is attributed to factors including the increasing prevalence of complex surgical procedures, technological advancements leading to improved surgical precision and outcomes, and rising healthcare expenditure globally. Adoption rates have increased steadily across various end-user segments, particularly in developed economies. Technological disruptions, such as the integration of AI and augmented reality into surgical microscopes, are expected to further propel market growth in the forecast period (2025-2033). Consumer behavior shifts, including increased demand for minimally invasive procedures, are also influencing the market. We project a CAGR of xx% from 2025 to 2033, with the market size reaching xx Million units by 2033. Market penetration is expected to increase to xx% by 2033.
Dominant Regions, Countries, or Segments in Operating Microscope Industry
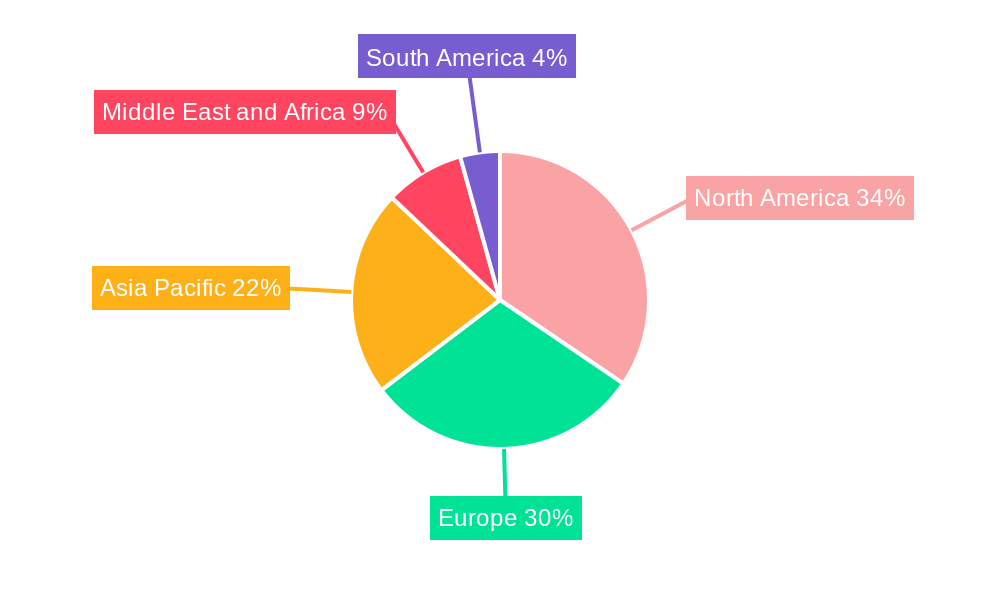
North America currently holds the largest market share in the operating microscope industry, driven by advanced healthcare infrastructure, high adoption rates of advanced surgical technologies, and substantial healthcare expenditure. Within North America, the United States dominates due to its large number of hospitals and ambulatory surgical centers, along with robust research and development activities. Europe follows as the second largest market, with a significant presence in Germany, France, and the UK. The Asia-Pacific region is experiencing the fastest growth, driven by rising healthcare spending, increasing awareness of advanced surgical techniques, and a growing number of specialized hospitals. In terms of application segments, neurosurgery and spine surgery, ophthalmology, and ENT consistently exhibit high demand, reflecting the complex nature of these procedures and the need for precise surgical visualization. Hospitals constitute the largest end-user segment due to their scale and comprehensive surgical capabilities.
- Key Drivers (North America): Advanced healthcare infrastructure, high healthcare expenditure, high adoption rates.
- Key Drivers (Europe): Established healthcare systems, presence of leading medical device manufacturers.
- Key Drivers (Asia-Pacific): Rising healthcare expenditure, increasing awareness of advanced surgical techniques.
- Dominant Application Segments: Neurosurgery and spine surgery, ophthalmology, and ENT.
- Dominant End-User Segment: Hospitals.
Operating Microscope Industry Product Landscape
Operating microscopes are increasingly incorporating advanced features such as 3D visualization, integrated imaging systems, and ergonomic designs to improve surgical precision and surgeon comfort. Unique selling propositions often focus on image quality, ease of use, and integration with other surgical equipment. Recent technological advancements have led to smaller, more portable designs, enhanced illumination capabilities, and improved depth perception for surgeons. These advancements are designed to facilitate minimally invasive procedures and improve overall surgical outcomes.
Key Drivers, Barriers & Challenges in Operating Microscope Industry
Key Drivers:
Technological advancements, increasing demand for minimally invasive procedures, rising healthcare expenditure, and growing prevalence of chronic diseases requiring surgical intervention are driving market growth.
Key Challenges:
High costs associated with purchasing and maintaining operating microscopes, stringent regulatory approvals for new products, and intense competition among established players pose significant challenges to market expansion. Supply chain disruptions and potential price fluctuations for raw materials also pose a risk. Furthermore, the increasing prevalence of alternative surgical techniques, such as robotic surgery, could pose a long-term competitive threat. These factors collectively influence market growth and profitability.
Emerging Opportunities in Operating Microscope Industry
Untapped markets in developing economies present significant growth potential. The integration of AI and machine learning for image analysis and surgical guidance represents a key opportunity. Personalized medicine and the development of specialized microscopes for specific surgical procedures are also emerging trends. Additionally, exploring innovative business models like microscopes-as-a-service could drive broader adoption.
Growth Accelerators in the Operating Microscope Industry
Technological breakthroughs, such as the incorporation of augmented reality and improved 3D imaging, will significantly accelerate market growth. Strategic partnerships between medical device manufacturers and hospitals or surgical centers will enable greater market penetration and access to new technologies. Expanding into emerging markets and focusing on developing customized solutions for specialized surgical procedures will also contribute to long-term growth.
Key Players Shaping the Operating Microscope Industry Market
- Seiler Instrument Inc
- Metall Zug Group (Haag-Streit)
- Takagi Seiko Co Ltd
- ATMOS MedizinTechnik GmbH & Co KG
- Topcon Corporation
- Avante Health Solutions
- ARI Medical Technology Co Ltd
- Danaher Corporation (Leica Microsystems)
- Synaptive Medical
- Carl Zeiss AG
- Labomed Inc
- Alltion (Wuzhou) Co Ltd
- Alcon Inc
- Olympus Corporation
- Optofine Instruments Pvt Ltd
Notable Milestones in Operating Microscope Industry Sector
- March 2023: The Joseph N France General Hospital acquired a Leica M690 Surgical Operating Microscope System, showcasing the demand for advanced technology.
- January 2023: Leica Microsystems expanded its distribution network through a partnership with DB Surgical, Inc., indicating efforts to enhance market reach.
In-Depth Operating Microscope Industry Market Outlook
The future of the operating microscope market is bright, driven by continuous technological innovation, growing demand for minimally invasive procedures, and expanding healthcare infrastructure globally. Strategic partnerships, expansion into emerging markets, and the development of innovative products with enhanced functionalities will further propel market growth. The market is poised for substantial expansion over the forecast period, presenting significant opportunities for both established and emerging players.
Operating Microscope Industry Segmentation
-
1. Application
- 1.1. Dentistry
- 1.2. Gynecology and Urology
- 1.3. Ear, Nose, and Throat (ENT)
- 1.4. Neurosurgery and Spine Surgery
- 1.5. Ophthalmology
- 1.6. Plastic and Reconstructive Surgery
- 1.7. Other Applications
-
2. End User
- 2.1. Hospitals
- 2.2. Ambulatory Surgical Centers
- 2.3. Other End Users
Operating Microscope Industry Segmentation By Geography
-
1. North America
- 1.1. United States
- 1.2. Canada
- 1.3. Mexico
-
2. Europe
- 2.1. Germany
- 2.2. United Kingdom
- 2.3. France
- 2.4. Italy
- 2.5. Spain
- 2.6. Rest of Europe
-
3. Asia Pacific
- 3.1. China
- 3.2. Japan
- 3.3. India
- 3.4. Australia
- 3.5. South Korea
- 3.6. Rest of Asia Pacific
-
4. Middle East and Africa
- 4.1. GCC
- 4.2. South Africa
- 4.3. Rest of Middle East and Africa
-
5. South America
- 5.1. Brazil
- 5.2. Argentina
- 5.3. Rest of South America
Operating Microscope Industry REPORT HIGHLIGHTS
| Aspects | Details |
|---|---|
| Study Period | 2019-2033 |
| Base Year | 2024 |
| Estimated Year | 2025 |
| Forecast Period | 2025-2033 |
| Historical Period | 2019-2024 |
| Growth Rate | CAGR of 11.77% from 2019-2033 |
| Segmentation |
|
Table of Contents
- 1. Introduction
- 1.1. Research Scope
- 1.2. Market Segmentation
- 1.3. Research Methodology
- 1.4. Definitions and Assumptions
- 2. Executive Summary
- 2.1. Introduction
- 3. Market Dynamics
- 3.1. Introduction
- 3.2. Market Drivers
- 3.2.1. Increasing Adoption of Minimally Invasive Surgeries; Rising Geriatric Population and Burden of Chronic Diseases; Technological Advancements in Surgical Microscopes
- 3.3. Market Restrains
- 3.3.1. Lack of Skilled Professionals; Low Acceptance Owing to High Costs
- 3.4. Market Trends
- 3.4.1. Ophthalmology Segment is Expected to Hold a Largest Share in the Market Over the Forecast Period
- 4. Market Factor Analysis
- 4.1. Porters Five Forces
- 4.2. Supply/Value Chain
- 4.3. PESTEL analysis
- 4.4. Market Entropy
- 4.5. Patent/Trademark Analysis
- 5. Global Operating Microscope Industry Analysis, Insights and Forecast, 2019-2031
- 5.1. Market Analysis, Insights and Forecast - by Application
- 5.1.1. Dentistry
- 5.1.2. Gynecology and Urology
- 5.1.3. Ear, Nose, and Throat (ENT)
- 5.1.4. Neurosurgery and Spine Surgery
- 5.1.5. Ophthalmology
- 5.1.6. Plastic and Reconstructive Surgery
- 5.1.7. Other Applications
- 5.2. Market Analysis, Insights and Forecast - by End User
- 5.2.1. Hospitals
- 5.2.2. Ambulatory Surgical Centers
- 5.2.3. Other End Users
- 5.3. Market Analysis, Insights and Forecast - by Region
- 5.3.1. North America
- 5.3.2. Europe
- 5.3.3. Asia Pacific
- 5.3.4. Middle East and Africa
- 5.3.5. South America
- 5.1. Market Analysis, Insights and Forecast - by Application
- 6. North America Operating Microscope Industry Analysis, Insights and Forecast, 2019-2031
- 6.1. Market Analysis, Insights and Forecast - by Application
- 6.1.1. Dentistry
- 6.1.2. Gynecology and Urology
- 6.1.3. Ear, Nose, and Throat (ENT)
- 6.1.4. Neurosurgery and Spine Surgery
- 6.1.5. Ophthalmology
- 6.1.6. Plastic and Reconstructive Surgery
- 6.1.7. Other Applications
- 6.2. Market Analysis, Insights and Forecast - by End User
- 6.2.1. Hospitals
- 6.2.2. Ambulatory Surgical Centers
- 6.2.3. Other End Users
- 6.1. Market Analysis, Insights and Forecast - by Application
- 7. Europe Operating Microscope Industry Analysis, Insights and Forecast, 2019-2031
- 7.1. Market Analysis, Insights and Forecast - by Application
- 7.1.1. Dentistry
- 7.1.2. Gynecology and Urology
- 7.1.3. Ear, Nose, and Throat (ENT)
- 7.1.4. Neurosurgery and Spine Surgery
- 7.1.5. Ophthalmology
- 7.1.6. Plastic and Reconstructive Surgery
- 7.1.7. Other Applications
- 7.2. Market Analysis, Insights and Forecast - by End User
- 7.2.1. Hospitals
- 7.2.2. Ambulatory Surgical Centers
- 7.2.3. Other End Users
- 7.1. Market Analysis, Insights and Forecast - by Application
- 8. Asia Pacific Operating Microscope Industry Analysis, Insights and Forecast, 2019-2031
- 8.1. Market Analysis, Insights and Forecast - by Application
- 8.1.1. Dentistry
- 8.1.2. Gynecology and Urology
- 8.1.3. Ear, Nose, and Throat (ENT)
- 8.1.4. Neurosurgery and Spine Surgery
- 8.1.5. Ophthalmology
- 8.1.6. Plastic and Reconstructive Surgery
- 8.1.7. Other Applications
- 8.2. Market Analysis, Insights and Forecast - by End User
- 8.2.1. Hospitals
- 8.2.2. Ambulatory Surgical Centers
- 8.2.3. Other End Users
- 8.1. Market Analysis, Insights and Forecast - by Application
- 9. Middle East and Africa Operating Microscope Industry Analysis, Insights and Forecast, 2019-2031
- 9.1. Market Analysis, Insights and Forecast - by Application
- 9.1.1. Dentistry
- 9.1.2. Gynecology and Urology
- 9.1.3. Ear, Nose, and Throat (ENT)
- 9.1.4. Neurosurgery and Spine Surgery
- 9.1.5. Ophthalmology
- 9.1.6. Plastic and Reconstructive Surgery
- 9.1.7. Other Applications
- 9.2. Market Analysis, Insights and Forecast - by End User
- 9.2.1. Hospitals
- 9.2.2. Ambulatory Surgical Centers
- 9.2.3. Other End Users
- 9.1. Market Analysis, Insights and Forecast - by Application
- 10. South America Operating Microscope Industry Analysis, Insights and Forecast, 2019-2031
- 10.1. Market Analysis, Insights and Forecast - by Application
- 10.1.1. Dentistry
- 10.1.2. Gynecology and Urology
- 10.1.3. Ear, Nose, and Throat (ENT)
- 10.1.4. Neurosurgery and Spine Surgery
- 10.1.5. Ophthalmology
- 10.1.6. Plastic and Reconstructive Surgery
- 10.1.7. Other Applications
- 10.2. Market Analysis, Insights and Forecast - by End User
- 10.2.1. Hospitals
- 10.2.2. Ambulatory Surgical Centers
- 10.2.3. Other End Users
- 10.1. Market Analysis, Insights and Forecast - by Application
- 11. North America Operating Microscope Industry Analysis, Insights and Forecast, 2019-2031
- 11.1. Market Analysis, Insights and Forecast - By Country/Sub-region
- 11.1.1. undefined
- 12. Europe Operating Microscope Industry Analysis, Insights and Forecast, 2019-2031
- 12.1. Market Analysis, Insights and Forecast - By Country/Sub-region
- 12.1.1. undefined
- 13. Asia Pacific Operating Microscope Industry Analysis, Insights and Forecast, 2019-2031
- 13.1. Market Analysis, Insights and Forecast - By Country/Sub-region
- 13.1.1. undefined
- 14. Middle East and Africa Operating Microscope Industry Analysis, Insights and Forecast, 2019-2031
- 14.1. Market Analysis, Insights and Forecast - By Country/Sub-region
- 14.1.1. undefined
- 15. South America Operating Microscope Industry Analysis, Insights and Forecast, 2019-2031
- 15.1. Market Analysis, Insights and Forecast - By Country/Sub-region
- 15.1.1. undefined
- 16. Competitive Analysis
- 16.1. Global Market Share Analysis 2024
- 16.2. Company Profiles
- 16.2.1 Seiler Instrument Inc
- 16.2.1.1. Overview
- 16.2.1.2. Products
- 16.2.1.3. SWOT Analysis
- 16.2.1.4. Recent Developments
- 16.2.1.5. Financials (Based on Availability)
- 16.2.2 Metall Zug Group (Haag-Streit)
- 16.2.2.1. Overview
- 16.2.2.2. Products
- 16.2.2.3. SWOT Analysis
- 16.2.2.4. Recent Developments
- 16.2.2.5. Financials (Based on Availability)
- 16.2.3 Takagi Seiko Co Ltd
- 16.2.3.1. Overview
- 16.2.3.2. Products
- 16.2.3.3. SWOT Analysis
- 16.2.3.4. Recent Developments
- 16.2.3.5. Financials (Based on Availability)
- 16.2.4 ATMOS MedizinTechnik GmbH & Co KG
- 16.2.4.1. Overview
- 16.2.4.2. Products
- 16.2.4.3. SWOT Analysis
- 16.2.4.4. Recent Developments
- 16.2.4.5. Financials (Based on Availability)
- 16.2.5 Topcon Corporation
- 16.2.5.1. Overview
- 16.2.5.2. Products
- 16.2.5.3. SWOT Analysis
- 16.2.5.4. Recent Developments
- 16.2.5.5. Financials (Based on Availability)
- 16.2.6 Avante Health Solutions
- 16.2.6.1. Overview
- 16.2.6.2. Products
- 16.2.6.3. SWOT Analysis
- 16.2.6.4. Recent Developments
- 16.2.6.5. Financials (Based on Availability)
- 16.2.7 ARI Medical Technology Co Ltd
- 16.2.7.1. Overview
- 16.2.7.2. Products
- 16.2.7.3. SWOT Analysis
- 16.2.7.4. Recent Developments
- 16.2.7.5. Financials (Based on Availability)
- 16.2.8 Danaher Corporation (Leica Microsystems)
- 16.2.8.1. Overview
- 16.2.8.2. Products
- 16.2.8.3. SWOT Analysis
- 16.2.8.4. Recent Developments
- 16.2.8.5. Financials (Based on Availability)
- 16.2.9 Synaptive Medical
- 16.2.9.1. Overview
- 16.2.9.2. Products
- 16.2.9.3. SWOT Analysis
- 16.2.9.4. Recent Developments
- 16.2.9.5. Financials (Based on Availability)
- 16.2.10 Carl Zeiss AG
- 16.2.10.1. Overview
- 16.2.10.2. Products
- 16.2.10.3. SWOT Analysis
- 16.2.10.4. Recent Developments
- 16.2.10.5. Financials (Based on Availability)
- 16.2.11 Labomed Inc
- 16.2.11.1. Overview
- 16.2.11.2. Products
- 16.2.11.3. SWOT Analysis
- 16.2.11.4. Recent Developments
- 16.2.11.5. Financials (Based on Availability)
- 16.2.12 Alltion (Wuzhou) Co Ltd
- 16.2.12.1. Overview
- 16.2.12.2. Products
- 16.2.12.3. SWOT Analysis
- 16.2.12.4. Recent Developments
- 16.2.12.5. Financials (Based on Availability)
- 16.2.13 Alcon Inc
- 16.2.13.1. Overview
- 16.2.13.2. Products
- 16.2.13.3. SWOT Analysis
- 16.2.13.4. Recent Developments
- 16.2.13.5. Financials (Based on Availability)
- 16.2.14 Olympus Corporation
- 16.2.14.1. Overview
- 16.2.14.2. Products
- 16.2.14.3. SWOT Analysis
- 16.2.14.4. Recent Developments
- 16.2.14.5. Financials (Based on Availability)
- 16.2.15 Optofine Instruments Pvt Ltd
- 16.2.15.1. Overview
- 16.2.15.2. Products
- 16.2.15.3. SWOT Analysis
- 16.2.15.4. Recent Developments
- 16.2.15.5. Financials (Based on Availability)
- 16.2.1 Seiler Instrument Inc
List of Figures
- Figure 1: Global Operating Microscope Industry Revenue Breakdown (Million, %) by Region 2024 & 2032
- Figure 2: Global Operating Microscope Industry Volume Breakdown (K Unit, %) by Region 2024 & 2032
- Figure 3: North America Operating Microscope Industry Revenue (Million), by Country 2024 & 2032
- Figure 4: North America Operating Microscope Industry Volume (K Unit), by Country 2024 & 2032
- Figure 5: North America Operating Microscope Industry Revenue Share (%), by Country 2024 & 2032
- Figure 6: North America Operating Microscope Industry Volume Share (%), by Country 2024 & 2032
- Figure 7: Europe Operating Microscope Industry Revenue (Million), by Country 2024 & 2032
- Figure 8: Europe Operating Microscope Industry Volume (K Unit), by Country 2024 & 2032
- Figure 9: Europe Operating Microscope Industry Revenue Share (%), by Country 2024 & 2032
- Figure 10: Europe Operating Microscope Industry Volume Share (%), by Country 2024 & 2032
- Figure 11: Asia Pacific Operating Microscope Industry Revenue (Million), by Country 2024 & 2032
- Figure 12: Asia Pacific Operating Microscope Industry Volume (K Unit), by Country 2024 & 2032
- Figure 13: Asia Pacific Operating Microscope Industry Revenue Share (%), by Country 2024 & 2032
- Figure 14: Asia Pacific Operating Microscope Industry Volume Share (%), by Country 2024 & 2032
- Figure 15: Middle East and Africa Operating Microscope Industry Revenue (Million), by Country 2024 & 2032
- Figure 16: Middle East and Africa Operating Microscope Industry Volume (K Unit), by Country 2024 & 2032
- Figure 17: Middle East and Africa Operating Microscope Industry Revenue Share (%), by Country 2024 & 2032
- Figure 18: Middle East and Africa Operating Microscope Industry Volume Share (%), by Country 2024 & 2032
- Figure 19: South America Operating Microscope Industry Revenue (Million), by Country 2024 & 2032
- Figure 20: South America Operating Microscope Industry Volume (K Unit), by Country 2024 & 2032
- Figure 21: South America Operating Microscope Industry Revenue Share (%), by Country 2024 & 2032
- Figure 22: South America Operating Microscope Industry Volume Share (%), by Country 2024 & 2032
- Figure 23: North America Operating Microscope Industry Revenue (Million), by Application 2024 & 2032
- Figure 24: North America Operating Microscope Industry Volume (K Unit), by Application 2024 & 2032
- Figure 25: North America Operating Microscope Industry Revenue Share (%), by Application 2024 & 2032
- Figure 26: North America Operating Microscope Industry Volume Share (%), by Application 2024 & 2032
- Figure 27: North America Operating Microscope Industry Revenue (Million), by End User 2024 & 2032
- Figure 28: North America Operating Microscope Industry Volume (K Unit), by End User 2024 & 2032
- Figure 29: North America Operating Microscope Industry Revenue Share (%), by End User 2024 & 2032
- Figure 30: North America Operating Microscope Industry Volume Share (%), by End User 2024 & 2032
- Figure 31: North America Operating Microscope Industry Revenue (Million), by Country 2024 & 2032
- Figure 32: North America Operating Microscope Industry Volume (K Unit), by Country 2024 & 2032
- Figure 33: North America Operating Microscope Industry Revenue Share (%), by Country 2024 & 2032
- Figure 34: North America Operating Microscope Industry Volume Share (%), by Country 2024 & 2032
- Figure 35: Europe Operating Microscope Industry Revenue (Million), by Application 2024 & 2032
- Figure 36: Europe Operating Microscope Industry Volume (K Unit), by Application 2024 & 2032
- Figure 37: Europe Operating Microscope Industry Revenue Share (%), by Application 2024 & 2032
- Figure 38: Europe Operating Microscope Industry Volume Share (%), by Application 2024 & 2032
- Figure 39: Europe Operating Microscope Industry Revenue (Million), by End User 2024 & 2032
- Figure 40: Europe Operating Microscope Industry Volume (K Unit), by End User 2024 & 2032
- Figure 41: Europe Operating Microscope Industry Revenue Share (%), by End User 2024 & 2032
- Figure 42: Europe Operating Microscope Industry Volume Share (%), by End User 2024 & 2032
- Figure 43: Europe Operating Microscope Industry Revenue (Million), by Country 2024 & 2032
- Figure 44: Europe Operating Microscope Industry Volume (K Unit), by Country 2024 & 2032
- Figure 45: Europe Operating Microscope Industry Revenue Share (%), by Country 2024 & 2032
- Figure 46: Europe Operating Microscope Industry Volume Share (%), by Country 2024 & 2032
- Figure 47: Asia Pacific Operating Microscope Industry Revenue (Million), by Application 2024 & 2032
- Figure 48: Asia Pacific Operating Microscope Industry Volume (K Unit), by Application 2024 & 2032
- Figure 49: Asia Pacific Operating Microscope Industry Revenue Share (%), by Application 2024 & 2032
- Figure 50: Asia Pacific Operating Microscope Industry Volume Share (%), by Application 2024 & 2032
- Figure 51: Asia Pacific Operating Microscope Industry Revenue (Million), by End User 2024 & 2032
- Figure 52: Asia Pacific Operating Microscope Industry Volume (K Unit), by End User 2024 & 2032
- Figure 53: Asia Pacific Operating Microscope Industry Revenue Share (%), by End User 2024 & 2032
- Figure 54: Asia Pacific Operating Microscope Industry Volume Share (%), by End User 2024 & 2032
- Figure 55: Asia Pacific Operating Microscope Industry Revenue (Million), by Country 2024 & 2032
- Figure 56: Asia Pacific Operating Microscope Industry Volume (K Unit), by Country 2024 & 2032
- Figure 57: Asia Pacific Operating Microscope Industry Revenue Share (%), by Country 2024 & 2032
- Figure 58: Asia Pacific Operating Microscope Industry Volume Share (%), by Country 2024 & 2032
- Figure 59: Middle East and Africa Operating Microscope Industry Revenue (Million), by Application 2024 & 2032
- Figure 60: Middle East and Africa Operating Microscope Industry Volume (K Unit), by Application 2024 & 2032
- Figure 61: Middle East and Africa Operating Microscope Industry Revenue Share (%), by Application 2024 & 2032
- Figure 62: Middle East and Africa Operating Microscope Industry Volume Share (%), by Application 2024 & 2032
- Figure 63: Middle East and Africa Operating Microscope Industry Revenue (Million), by End User 2024 & 2032
- Figure 64: Middle East and Africa Operating Microscope Industry Volume (K Unit), by End User 2024 & 2032
- Figure 65: Middle East and Africa Operating Microscope Industry Revenue Share (%), by End User 2024 & 2032
- Figure 66: Middle East and Africa Operating Microscope Industry Volume Share (%), by End User 2024 & 2032
- Figure 67: Middle East and Africa Operating Microscope Industry Revenue (Million), by Country 2024 & 2032
- Figure 68: Middle East and Africa Operating Microscope Industry Volume (K Unit), by Country 2024 & 2032
- Figure 69: Middle East and Africa Operating Microscope Industry Revenue Share (%), by Country 2024 & 2032
- Figure 70: Middle East and Africa Operating Microscope Industry Volume Share (%), by Country 2024 & 2032
- Figure 71: South America Operating Microscope Industry Revenue (Million), by Application 2024 & 2032
- Figure 72: South America Operating Microscope Industry Volume (K Unit), by Application 2024 & 2032
- Figure 73: South America Operating Microscope Industry Revenue Share (%), by Application 2024 & 2032
- Figure 74: South America Operating Microscope Industry Volume Share (%), by Application 2024 & 2032
- Figure 75: South America Operating Microscope Industry Revenue (Million), by End User 2024 & 2032
- Figure 76: South America Operating Microscope Industry Volume (K Unit), by End User 2024 & 2032
- Figure 77: South America Operating Microscope Industry Revenue Share (%), by End User 2024 & 2032
- Figure 78: South America Operating Microscope Industry Volume Share (%), by End User 2024 & 2032
- Figure 79: South America Operating Microscope Industry Revenue (Million), by Country 2024 & 2032
- Figure 80: South America Operating Microscope Industry Volume (K Unit), by Country 2024 & 2032
- Figure 81: South America Operating Microscope Industry Revenue Share (%), by Country 2024 & 2032
- Figure 82: South America Operating Microscope Industry Volume Share (%), by Country 2024 & 2032
List of Tables
- Table 1: Global Operating Microscope Industry Revenue Million Forecast, by Region 2019 & 2032
- Table 2: Global Operating Microscope Industry Volume K Unit Forecast, by Region 2019 & 2032
- Table 3: Global Operating Microscope Industry Revenue Million Forecast, by Application 2019 & 2032
- Table 4: Global Operating Microscope Industry Volume K Unit Forecast, by Application 2019 & 2032
- Table 5: Global Operating Microscope Industry Revenue Million Forecast, by End User 2019 & 2032
- Table 6: Global Operating Microscope Industry Volume K Unit Forecast, by End User 2019 & 2032
- Table 7: Global Operating Microscope Industry Revenue Million Forecast, by Region 2019 & 2032
- Table 8: Global Operating Microscope Industry Volume K Unit Forecast, by Region 2019 & 2032
- Table 9: Global Operating Microscope Industry Revenue Million Forecast, by Country 2019 & 2032
- Table 10: Global Operating Microscope Industry Volume K Unit Forecast, by Country 2019 & 2032
- Table 11: Global Operating Microscope Industry Revenue Million Forecast, by Country 2019 & 2032
- Table 12: Global Operating Microscope Industry Volume K Unit Forecast, by Country 2019 & 2032
- Table 13: Global Operating Microscope Industry Revenue Million Forecast, by Country 2019 & 2032
- Table 14: Global Operating Microscope Industry Volume K Unit Forecast, by Country 2019 & 2032
- Table 15: Global Operating Microscope Industry Revenue Million Forecast, by Country 2019 & 2032
- Table 16: Global Operating Microscope Industry Volume K Unit Forecast, by Country 2019 & 2032
- Table 17: Global Operating Microscope Industry Revenue Million Forecast, by Country 2019 & 2032
- Table 18: Global Operating Microscope Industry Volume K Unit Forecast, by Country 2019 & 2032
- Table 19: Global Operating Microscope Industry Revenue Million Forecast, by Application 2019 & 2032
- Table 20: Global Operating Microscope Industry Volume K Unit Forecast, by Application 2019 & 2032
- Table 21: Global Operating Microscope Industry Revenue Million Forecast, by End User 2019 & 2032
- Table 22: Global Operating Microscope Industry Volume K Unit Forecast, by End User 2019 & 2032
- Table 23: Global Operating Microscope Industry Revenue Million Forecast, by Country 2019 & 2032
- Table 24: Global Operating Microscope Industry Volume K Unit Forecast, by Country 2019 & 2032
- Table 25: United States Operating Microscope Industry Revenue (Million) Forecast, by Application 2019 & 2032
- Table 26: United States Operating Microscope Industry Volume (K Unit) Forecast, by Application 2019 & 2032
- Table 27: Canada Operating Microscope Industry Revenue (Million) Forecast, by Application 2019 & 2032
- Table 28: Canada Operating Microscope Industry Volume (K Unit) Forecast, by Application 2019 & 2032
- Table 29: Mexico Operating Microscope Industry Revenue (Million) Forecast, by Application 2019 & 2032
- Table 30: Mexico Operating Microscope Industry Volume (K Unit) Forecast, by Application 2019 & 2032
- Table 31: Global Operating Microscope Industry Revenue Million Forecast, by Application 2019 & 2032
- Table 32: Global Operating Microscope Industry Volume K Unit Forecast, by Application 2019 & 2032
- Table 33: Global Operating Microscope Industry Revenue Million Forecast, by End User 2019 & 2032
- Table 34: Global Operating Microscope Industry Volume K Unit Forecast, by End User 2019 & 2032
- Table 35: Global Operating Microscope Industry Revenue Million Forecast, by Country 2019 & 2032
- Table 36: Global Operating Microscope Industry Volume K Unit Forecast, by Country 2019 & 2032
- Table 37: Germany Operating Microscope Industry Revenue (Million) Forecast, by Application 2019 & 2032
- Table 38: Germany Operating Microscope Industry Volume (K Unit) Forecast, by Application 2019 & 2032
- Table 39: United Kingdom Operating Microscope Industry Revenue (Million) Forecast, by Application 2019 & 2032
- Table 40: United Kingdom Operating Microscope Industry Volume (K Unit) Forecast, by Application 2019 & 2032
- Table 41: France Operating Microscope Industry Revenue (Million) Forecast, by Application 2019 & 2032
- Table 42: France Operating Microscope Industry Volume (K Unit) Forecast, by Application 2019 & 2032
- Table 43: Italy Operating Microscope Industry Revenue (Million) Forecast, by Application 2019 & 2032
- Table 44: Italy Operating Microscope Industry Volume (K Unit) Forecast, by Application 2019 & 2032
- Table 45: Spain Operating Microscope Industry Revenue (Million) Forecast, by Application 2019 & 2032
- Table 46: Spain Operating Microscope Industry Volume (K Unit) Forecast, by Application 2019 & 2032
- Table 47: Rest of Europe Operating Microscope Industry Revenue (Million) Forecast, by Application 2019 & 2032
- Table 48: Rest of Europe Operating Microscope Industry Volume (K Unit) Forecast, by Application 2019 & 2032
- Table 49: Global Operating Microscope Industry Revenue Million Forecast, by Application 2019 & 2032
- Table 50: Global Operating Microscope Industry Volume K Unit Forecast, by Application 2019 & 2032
- Table 51: Global Operating Microscope Industry Revenue Million Forecast, by End User 2019 & 2032
- Table 52: Global Operating Microscope Industry Volume K Unit Forecast, by End User 2019 & 2032
- Table 53: Global Operating Microscope Industry Revenue Million Forecast, by Country 2019 & 2032
- Table 54: Global Operating Microscope Industry Volume K Unit Forecast, by Country 2019 & 2032
- Table 55: China Operating Microscope Industry Revenue (Million) Forecast, by Application 2019 & 2032
- Table 56: China Operating Microscope Industry Volume (K Unit) Forecast, by Application 2019 & 2032
- Table 57: Japan Operating Microscope Industry Revenue (Million) Forecast, by Application 2019 & 2032
- Table 58: Japan Operating Microscope Industry Volume (K Unit) Forecast, by Application 2019 & 2032
- Table 59: India Operating Microscope Industry Revenue (Million) Forecast, by Application 2019 & 2032
- Table 60: India Operating Microscope Industry Volume (K Unit) Forecast, by Application 2019 & 2032
- Table 61: Australia Operating Microscope Industry Revenue (Million) Forecast, by Application 2019 & 2032
- Table 62: Australia Operating Microscope Industry Volume (K Unit) Forecast, by Application 2019 & 2032
- Table 63: South Korea Operating Microscope Industry Revenue (Million) Forecast, by Application 2019 & 2032
- Table 64: South Korea Operating Microscope Industry Volume (K Unit) Forecast, by Application 2019 & 2032
- Table 65: Rest of Asia Pacific Operating Microscope Industry Revenue (Million) Forecast, by Application 2019 & 2032
- Table 66: Rest of Asia Pacific Operating Microscope Industry Volume (K Unit) Forecast, by Application 2019 & 2032
- Table 67: Global Operating Microscope Industry Revenue Million Forecast, by Application 2019 & 2032
- Table 68: Global Operating Microscope Industry Volume K Unit Forecast, by Application 2019 & 2032
- Table 69: Global Operating Microscope Industry Revenue Million Forecast, by End User 2019 & 2032
- Table 70: Global Operating Microscope Industry Volume K Unit Forecast, by End User 2019 & 2032
- Table 71: Global Operating Microscope Industry Revenue Million Forecast, by Country 2019 & 2032
- Table 72: Global Operating Microscope Industry Volume K Unit Forecast, by Country 2019 & 2032
- Table 73: GCC Operating Microscope Industry Revenue (Million) Forecast, by Application 2019 & 2032
- Table 74: GCC Operating Microscope Industry Volume (K Unit) Forecast, by Application 2019 & 2032
- Table 75: South Africa Operating Microscope Industry Revenue (Million) Forecast, by Application 2019 & 2032
- Table 76: South Africa Operating Microscope Industry Volume (K Unit) Forecast, by Application 2019 & 2032
- Table 77: Rest of Middle East and Africa Operating Microscope Industry Revenue (Million) Forecast, by Application 2019 & 2032
- Table 78: Rest of Middle East and Africa Operating Microscope Industry Volume (K Unit) Forecast, by Application 2019 & 2032
- Table 79: Global Operating Microscope Industry Revenue Million Forecast, by Application 2019 & 2032
- Table 80: Global Operating Microscope Industry Volume K Unit Forecast, by Application 2019 & 2032
- Table 81: Global Operating Microscope Industry Revenue Million Forecast, by End User 2019 & 2032
- Table 82: Global Operating Microscope Industry Volume K Unit Forecast, by End User 2019 & 2032
- Table 83: Global Operating Microscope Industry Revenue Million Forecast, by Country 2019 & 2032
- Table 84: Global Operating Microscope Industry Volume K Unit Forecast, by Country 2019 & 2032
- Table 85: Brazil Operating Microscope Industry Revenue (Million) Forecast, by Application 2019 & 2032
- Table 86: Brazil Operating Microscope Industry Volume (K Unit) Forecast, by Application 2019 & 2032
- Table 87: Argentina Operating Microscope Industry Revenue (Million) Forecast, by Application 2019 & 2032
- Table 88: Argentina Operating Microscope Industry Volume (K Unit) Forecast, by Application 2019 & 2032
- Table 89: Rest of South America Operating Microscope Industry Revenue (Million) Forecast, by Application 2019 & 2032
- Table 90: Rest of South America Operating Microscope Industry Volume (K Unit) Forecast, by Application 2019 & 2032
Frequently Asked Questions
1. What is the projected Compound Annual Growth Rate (CAGR) of the Operating Microscope Industry?
The projected CAGR is approximately 11.77%.
2. Which companies are prominent players in the Operating Microscope Industry?
Key companies in the market include Seiler Instrument Inc, Metall Zug Group (Haag-Streit), Takagi Seiko Co Ltd, ATMOS MedizinTechnik GmbH & Co KG, Topcon Corporation, Avante Health Solutions, ARI Medical Technology Co Ltd, Danaher Corporation (Leica Microsystems), Synaptive Medical, Carl Zeiss AG, Labomed Inc, Alltion (Wuzhou) Co Ltd, Alcon Inc, Olympus Corporation, Optofine Instruments Pvt Ltd.
3. What are the main segments of the Operating Microscope Industry?
The market segments include Application, End User.
4. Can you provide details about the market size?
The market size is estimated to be USD 1.41 Million as of 2022.
5. What are some drivers contributing to market growth?
Increasing Adoption of Minimally Invasive Surgeries; Rising Geriatric Population and Burden of Chronic Diseases; Technological Advancements in Surgical Microscopes.
6. What are the notable trends driving market growth?
Ophthalmology Segment is Expected to Hold a Largest Share in the Market Over the Forecast Period.
7. Are there any restraints impacting market growth?
Lack of Skilled Professionals; Low Acceptance Owing to High Costs.
8. Can you provide examples of recent developments in the market?
March 2023: The Joseph N France General Hospital acquired a Leica M690 Surgical Operating Microscope System. This cutting-edge technology is set to revolutionize the surgical procedures performed at the hospital, leading to improved patient care and outcomes.
9. What pricing options are available for accessing the report?
Pricing options include single-user, multi-user, and enterprise licenses priced at USD 4750, USD 5250, and USD 8750 respectively.
10. Is the market size provided in terms of value or volume?
The market size is provided in terms of value, measured in Million and volume, measured in K Unit.
11. Are there any specific market keywords associated with the report?
Yes, the market keyword associated with the report is "Operating Microscope Industry," which aids in identifying and referencing the specific market segment covered.
12. How do I determine which pricing option suits my needs best?
The pricing options vary based on user requirements and access needs. Individual users may opt for single-user licenses, while businesses requiring broader access may choose multi-user or enterprise licenses for cost-effective access to the report.
13. Are there any additional resources or data provided in the Operating Microscope Industry report?
While the report offers comprehensive insights, it's advisable to review the specific contents or supplementary materials provided to ascertain if additional resources or data are available.
14. How can I stay updated on further developments or reports in the Operating Microscope Industry?
To stay informed about further developments, trends, and reports in the Operating Microscope Industry, consider subscribing to industry newsletters, following relevant companies and organizations, or regularly checking reputable industry news sources and publications.
Methodology
Step 1 - Identification of Relevant Samples Size from Population Database


Step 2 - Approaches for Defining Global Market Size (Value, Volume* & Price*)

Note*: In applicable scenarios
Step 3 - Data Sources
Primary Research
- Web Analytics
- Survey Reports
- Research Institute
- Latest Research Reports
- Opinion Leaders
Secondary Research
- Annual Reports
- White Paper
- Latest Press Release
- Industry Association
- Paid Database
- Investor Presentations

Step 4 - Data Triangulation
Involves using different sources of information in order to increase the validity of a study
These sources are likely to be stakeholders in a program - participants, other researchers, program staff, other community members, and so on.
Then we put all data in single framework & apply various statistical tools to find out the dynamic on the market.
During the analysis stage, feedback from the stakeholder groups would be compared to determine areas of agreement as well as areas of divergence
