

Key Insights
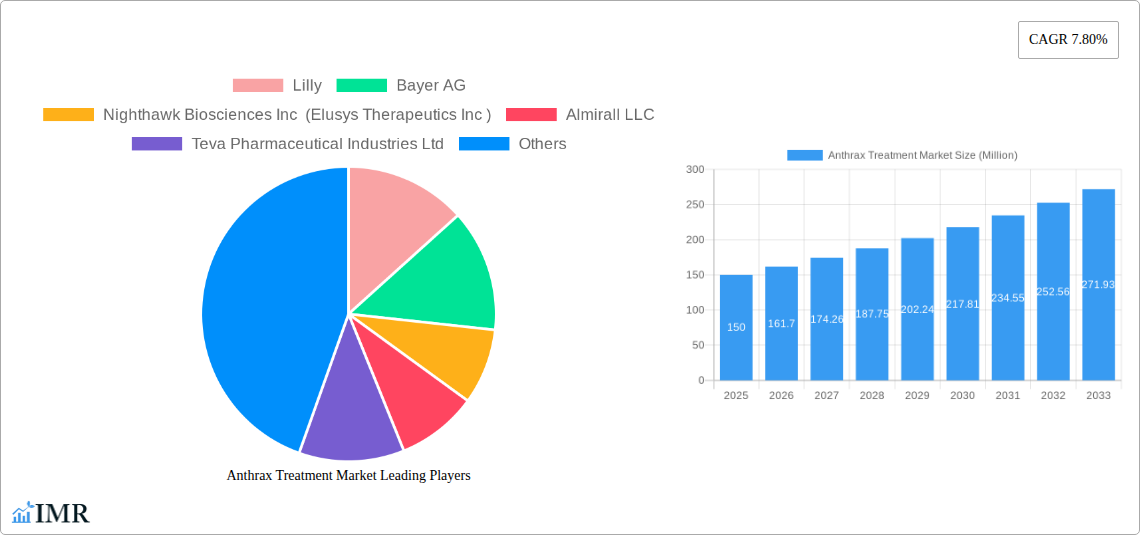
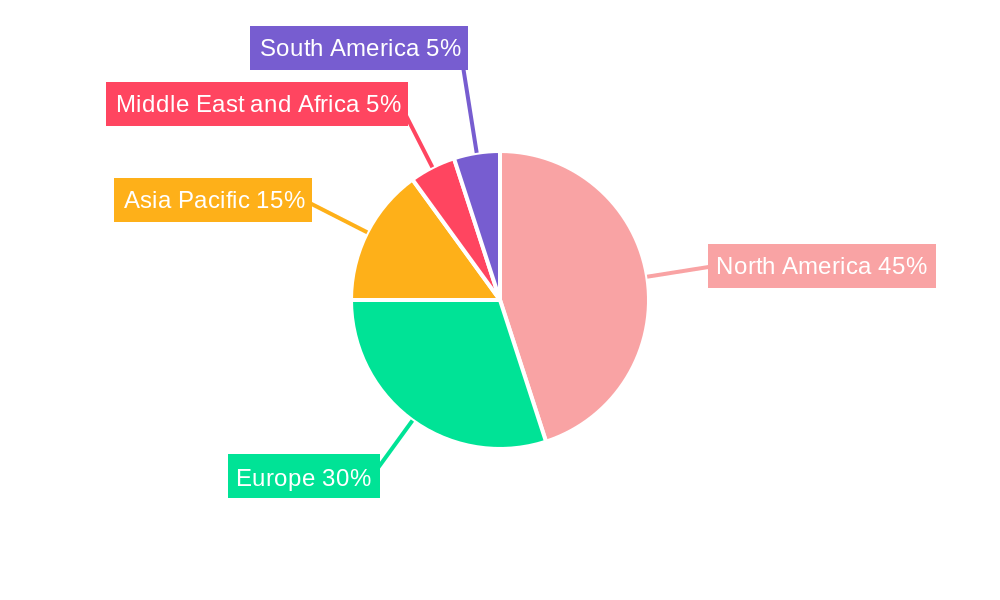
The Anthrax Treatment Market, valued at approximately $XX million in 2025, is projected to experience robust growth, exhibiting a compound annual growth rate (CAGR) of 7.80% from 2025 to 2033. This expansion is primarily driven by increasing incidences of anthrax outbreaks, both naturally occurring and bioterrorism-related, coupled with rising government investments in biodefense initiatives and advancements in treatment modalities. The market is segmented by drug class (antibiotics, immunoglobulins, and others), distribution channel (hospitals, pharmacies, and other channels), and anthrax type (cutaneous, inhalation, gastrointestinal, and injection). Antibiotics currently dominate the drug class segment due to their established efficacy and widespread availability, although immunoglobulins are witnessing increased adoption due to their targeted approach. Hospitals represent the largest distribution channel, reflecting the severity of anthrax and the need for intensive care. Inhalation anthrax, owing to its high mortality rate, commands a significant share of the market, driving demand for effective and rapid treatments. Geographic distribution reveals North America and Europe as currently dominant regions, driven by advanced healthcare infrastructure and higher awareness. However, the Asia Pacific region is poised for substantial growth, fueled by rising populations, increasing healthcare spending, and heightened concerns regarding bioterrorism. Market restraints include the relatively low prevalence of anthrax compared to other infectious diseases, the potential for antibiotic resistance, and the high cost of advanced treatment options, particularly immunoglobulins.
The competitive landscape is characterized by a mix of established pharmaceutical giants like Lilly, Bayer AG, GSK plc, and Pfizer Inc., alongside smaller, specialized companies such as Nighthawk Biosciences Inc. (Elusys Therapeutics Inc.), Almirall LLC, Teva Pharmaceutical Industries Ltd., and Paratek Pharmaceuticals Inc. These companies are actively engaged in research and development, striving to improve existing treatments and develop novel therapies with enhanced efficacy and reduced side effects. Future market growth will likely be influenced by factors such as the emergence of new therapeutic agents, the development of improved diagnostic tools, and the ongoing evolution of bioterrorism preparedness strategies globally. Continued investments in research and development, alongside effective public health initiatives, will play a crucial role in shaping the future trajectory of the Anthrax Treatment Market.
Anthrax Treatment Market: A Comprehensive Report (2019-2033)
This comprehensive report provides a detailed analysis of the Anthrax Treatment Market, encompassing market dynamics, growth trends, regional segmentation, product landscape, key players, and future outlook. The study period covers 2019-2033, with 2025 serving as the base and estimated year. The report segments the market by drug class (Antibiotics, Immunoglobulins, Others), distribution channel (Hospitals, Pharmacies, Other Distribution Channels), and anthrax type (Cutaneous Anthrax, Inhalation Anthrax, Gastrointestinal Anthrax, Injection Anthrax). The report values are presented in million units.
Anthrax Treatment Market Market Dynamics & Structure
The Anthrax Treatment Market is characterized by a moderately concentrated landscape with key players like Lilly, Bayer AG, Nighthawk Biosciences Inc (Elusys Therapeutics Inc), Almirall LLC, Teva Pharmaceutical Industries Ltd, Emergent, GSK plc, Paratek Pharmaceuticals Inc, and Pfizer Inc. Market growth is driven by technological advancements in drug development, stringent regulatory frameworks emphasizing biodefense preparedness, and increasing government funding for bioterrorism countermeasures. However, high R&D costs, stringent regulatory approvals, and the inherent niche nature of the market present significant barriers to entry. The market also witnesses considerable M&A activity, reflecting the strategic importance of securing advanced treatment options and expanding market share.
- Market Concentration: Moderately concentrated, with the top 5 players holding an estimated xx% market share in 2025.
- Technological Innovation: Focus on developing more effective and rapidly deployable treatments, including next-generation antibiotics and immunotherapies.
- Regulatory Framework: Stringent regulatory approvals driven by bioterrorism concerns and public health safety mandates.
- Competitive Substitutes: Limited direct substitutes, making existing treatments crucial.
- End-User Demographics: Primarily governmental agencies, healthcare institutions, and military organizations.
- M&A Trends: Significant M&A activity observed in recent years, with a total of xx deals recorded between 2019 and 2024. The acquisition of Elusys Therapeutics by NightHawk Biosciences in 2022 exemplifies this trend.
Anthrax Treatment Market Growth Trends & Insights
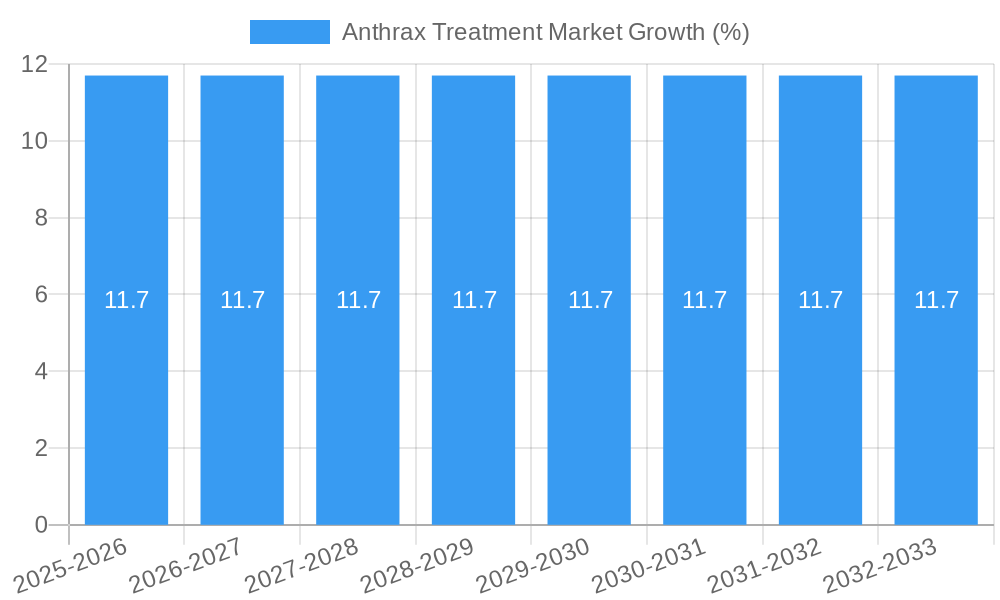
The Anthrax Treatment Market experienced a CAGR of xx% during the historical period (2019-2024), reaching a market size of xx Million units in 2024. This growth is projected to continue during the forecast period (2025-2033), with an anticipated CAGR of xx%, driven by factors such as heightened bioterrorism concerns, increased government investments in biodefense, and the development of more effective treatment options. Market penetration remains relatively low due to the niche nature of the market, yet a significant increase in adoption rates is expected, particularly in regions with high vulnerability to anthrax outbreaks. Technological disruptions, including the development of novel therapeutics and advanced diagnostic tools, are further bolstering market growth. The market is expected to reach xx Million units by 2033.
Dominant Regions, Countries, or Segments in Anthrax Treatment Market
The North American region dominates the Anthrax Treatment Market, holding the largest market share (xx%) in 2025. This dominance is attributed to substantial government funding for biodefense programs, a well-established healthcare infrastructure, and the presence of major pharmaceutical companies actively engaged in anthrax treatment development. Europe follows as a significant market, driven by proactive government initiatives and a robust healthcare system. Within the segments, Inhalation Anthrax treatment holds the largest share due to its high mortality rate and the associated public health concerns. The Hospitals segment also dominates the distribution channel, accounting for xx% of the total market in 2025 due to the complex nature of anthrax treatment requiring specialized medical facilities.
- Key Drivers in North America: High government spending on biodefense, advanced healthcare infrastructure, and the presence of major pharmaceutical companies.
- Growth Potential in Europe: Increasing government investment in biodefense and a developed healthcare infrastructure.
- Dominant Anthrax Type: Inhalation Anthrax, due to its high mortality rate.
- Dominant Distribution Channel: Hospitals, due to the need for specialized care.
Anthrax Treatment Market Product Landscape
The anthrax treatment market features a range of products, including antibiotics like ciprofloxacin and doxycycline, antitoxins like obiltoxaximab (ANTHIM), and immunoglobulins. These products vary in their mechanism of action, efficacy, and administration route. Ongoing research and development focus on improving treatment efficacy, reducing side effects, and developing novel therapeutic approaches, such as targeted therapies and advanced immunotherapies. The unique selling propositions center around efficacy, safety profiles, ease of administration, and broad-spectrum activity.
Key Drivers, Barriers & Challenges in Anthrax Treatment Market
Key Drivers: Increased bioterrorism concerns, government investments in biodefense preparedness, advancements in treatment technologies, and rising awareness of anthrax infections.
Challenges: High R&D costs, lengthy regulatory approval processes, limited market size, and potential supply chain disruptions, particularly in the event of an actual anthrax outbreak resulting in a xx% decrease in supply capacity.
Emerging Opportunities in Anthrax Treatment Market
Emerging opportunities include the development of next-generation antibiotics to combat antibiotic-resistant strains of Bacillus anthracis, the exploration of novel therapeutic approaches such as immunotherapy and gene therapy, and expansion into underserved markets in developing countries with limited access to effective anthrax treatment. Furthermore, strategic partnerships between pharmaceutical companies and government agencies are opening new avenues for research, development, and market access.
Growth Accelerators in the Anthrax Treatment Market Industry
Long-term growth will be accelerated by technological advancements leading to more effective and safer treatments, strategic collaborations between pharmaceutical companies and government agencies to ensure sufficient supply and accessibility, and increased investments in research and development to explore new therapeutic modalities. Expansion into emerging markets and proactive preparedness measures by governments will also contribute to market expansion.
Key Players Shaping the Anthrax Treatment Market Market
- Lilly
- Bayer AG
- Nighthawk Biosciences Inc (Elusys Therapeutics Inc)
- Almirall LLC
- Teva Pharmaceutical Industries Ltd
- Emergent
- GSK plc
- Paratek Pharmaceuticals Inc
- Pfizer Inc
Notable Milestones in Anthrax Treatment Market Sector
- April 2022: NightHawk Biosciences acquires Elusys Therapeutics, enhancing its anthrax treatment portfolio.
- January 2022: Elusys Therapeutics secures a contract with the U.S. Department of Health and Human Services for continued supply of ANTHIM.
In-Depth Anthrax Treatment Market Market Outlook
The Anthrax Treatment Market is poised for significant growth over the forecast period, driven by ongoing technological advancements, strategic partnerships, and increasing government investments in biodefense. The market's future potential hinges on the successful development and adoption of next-generation treatments, proactive preparedness strategies by government and healthcare institutions, and expansion into new markets. Strategic opportunities exist for companies to invest in R&D, establish strategic partnerships, and expand market access to capitalize on this promising sector.
Anthrax Treatment Market Segmentation
-
1. Anthrax Type
- 1.1. Cutaneous Anthrax
- 1.2. Inhalation Anthrax
- 1.3. Gastrointestinal Anthrax
- 1.4. Injection Anthrax
-
2. Drug Class
- 2.1. Antibiotics
- 2.2. Immunoglobulins
- 2.3. Others
-
3. Distribution Channel
- 3.1. Hospitals
- 3.2. Pharmacies
- 3.3. Other Distribution Channels
Anthrax Treatment Market Segmentation By Geography
-
1. North America
- 1.1. United States
- 1.2. Canada
- 1.3. Mexico
-
2. Europe
- 2.1. Germany
- 2.2. United Kingdom
- 2.3. France
- 2.4. Italy
- 2.5. Spain
- 2.6. Rest of Europe
-
3. Asia Pacific
- 3.1. China
- 3.2. Japan
- 3.3. India
- 3.4. Australia
- 3.5. South Korea
- 3.6. Rest of Asia Pacific
-
4. Middle East and Africa
- 4.1. GCC
- 4.2. South Africa
- 4.3. Rest of Middle East and Africa
-
5. South America
- 5.1. Brazil
- 5.2. Argentina
- 5.3. Rest of South America
Anthrax Treatment Market REPORT HIGHLIGHTS
| Aspects | Details |
|---|---|
| Study Period | 2019-2033 |
| Base Year | 2024 |
| Estimated Year | 2025 |
| Forecast Period | 2025-2033 |
| Historical Period | 2019-2024 |
| Growth Rate | CAGR of 7.80% from 2019-2033 |
| Segmentation |
|
Table of Contents
- 1. Introduction
- 1.1. Research Scope
- 1.2. Market Segmentation
- 1.3. Research Methodology
- 1.4. Definitions and Assumptions
- 2. Executive Summary
- 2.1. Introduction
- 3. Market Dynamics
- 3.1. Introduction
- 3.2. Market Drivers
- 3.2.1. Increase in Research Funding; Development of Novel Therapies for Treatment of Anthrax
- 3.3. Market Restrains
- 3.3.1. High Cost Associated with Diagnostic Treatment
- 3.4. Market Trends
- 3.4.1. Inhalation Anthrax Segment is Expected to Dominate During the Forecast Period
- 4. Market Factor Analysis
- 4.1. Porters Five Forces
- 4.2. Supply/Value Chain
- 4.3. PESTEL analysis
- 4.4. Market Entropy
- 4.5. Patent/Trademark Analysis
- 5. Global Anthrax Treatment Market Analysis, Insights and Forecast, 2019-2031
- 5.1. Market Analysis, Insights and Forecast - by Anthrax Type
- 5.1.1. Cutaneous Anthrax
- 5.1.2. Inhalation Anthrax
- 5.1.3. Gastrointestinal Anthrax
- 5.1.4. Injection Anthrax
- 5.2. Market Analysis, Insights and Forecast - by Drug Class
- 5.2.1. Antibiotics
- 5.2.2. Immunoglobulins
- 5.2.3. Others
- 5.3. Market Analysis, Insights and Forecast - by Distribution Channel
- 5.3.1. Hospitals
- 5.3.2. Pharmacies
- 5.3.3. Other Distribution Channels
- 5.4. Market Analysis, Insights and Forecast - by Region
- 5.4.1. North America
- 5.4.2. Europe
- 5.4.3. Asia Pacific
- 5.4.4. Middle East and Africa
- 5.4.5. South America
- 5.1. Market Analysis, Insights and Forecast - by Anthrax Type
- 6. North America Anthrax Treatment Market Analysis, Insights and Forecast, 2019-2031
- 6.1. Market Analysis, Insights and Forecast - by Anthrax Type
- 6.1.1. Cutaneous Anthrax
- 6.1.2. Inhalation Anthrax
- 6.1.3. Gastrointestinal Anthrax
- 6.1.4. Injection Anthrax
- 6.2. Market Analysis, Insights and Forecast - by Drug Class
- 6.2.1. Antibiotics
- 6.2.2. Immunoglobulins
- 6.2.3. Others
- 6.3. Market Analysis, Insights and Forecast - by Distribution Channel
- 6.3.1. Hospitals
- 6.3.2. Pharmacies
- 6.3.3. Other Distribution Channels
- 6.1. Market Analysis, Insights and Forecast - by Anthrax Type
- 7. Europe Anthrax Treatment Market Analysis, Insights and Forecast, 2019-2031
- 7.1. Market Analysis, Insights and Forecast - by Anthrax Type
- 7.1.1. Cutaneous Anthrax
- 7.1.2. Inhalation Anthrax
- 7.1.3. Gastrointestinal Anthrax
- 7.1.4. Injection Anthrax
- 7.2. Market Analysis, Insights and Forecast - by Drug Class
- 7.2.1. Antibiotics
- 7.2.2. Immunoglobulins
- 7.2.3. Others
- 7.3. Market Analysis, Insights and Forecast - by Distribution Channel
- 7.3.1. Hospitals
- 7.3.2. Pharmacies
- 7.3.3. Other Distribution Channels
- 7.1. Market Analysis, Insights and Forecast - by Anthrax Type
- 8. Asia Pacific Anthrax Treatment Market Analysis, Insights and Forecast, 2019-2031
- 8.1. Market Analysis, Insights and Forecast - by Anthrax Type
- 8.1.1. Cutaneous Anthrax
- 8.1.2. Inhalation Anthrax
- 8.1.3. Gastrointestinal Anthrax
- 8.1.4. Injection Anthrax
- 8.2. Market Analysis, Insights and Forecast - by Drug Class
- 8.2.1. Antibiotics
- 8.2.2. Immunoglobulins
- 8.2.3. Others
- 8.3. Market Analysis, Insights and Forecast - by Distribution Channel
- 8.3.1. Hospitals
- 8.3.2. Pharmacies
- 8.3.3. Other Distribution Channels
- 8.1. Market Analysis, Insights and Forecast - by Anthrax Type
- 9. Middle East and Africa Anthrax Treatment Market Analysis, Insights and Forecast, 2019-2031
- 9.1. Market Analysis, Insights and Forecast - by Anthrax Type
- 9.1.1. Cutaneous Anthrax
- 9.1.2. Inhalation Anthrax
- 9.1.3. Gastrointestinal Anthrax
- 9.1.4. Injection Anthrax
- 9.2. Market Analysis, Insights and Forecast - by Drug Class
- 9.2.1. Antibiotics
- 9.2.2. Immunoglobulins
- 9.2.3. Others
- 9.3. Market Analysis, Insights and Forecast - by Distribution Channel
- 9.3.1. Hospitals
- 9.3.2. Pharmacies
- 9.3.3. Other Distribution Channels
- 9.1. Market Analysis, Insights and Forecast - by Anthrax Type
- 10. South America Anthrax Treatment Market Analysis, Insights and Forecast, 2019-2031
- 10.1. Market Analysis, Insights and Forecast - by Anthrax Type
- 10.1.1. Cutaneous Anthrax
- 10.1.2. Inhalation Anthrax
- 10.1.3. Gastrointestinal Anthrax
- 10.1.4. Injection Anthrax
- 10.2. Market Analysis, Insights and Forecast - by Drug Class
- 10.2.1. Antibiotics
- 10.2.2. Immunoglobulins
- 10.2.3. Others
- 10.3. Market Analysis, Insights and Forecast - by Distribution Channel
- 10.3.1. Hospitals
- 10.3.2. Pharmacies
- 10.3.3. Other Distribution Channels
- 10.1. Market Analysis, Insights and Forecast - by Anthrax Type
- 11. North America Anthrax Treatment Market Analysis, Insights and Forecast, 2019-2031
- 11.1. Market Analysis, Insights and Forecast - By Country/Sub-region
- 11.1.1 United States
- 11.1.2 Canada
- 11.1.3 Mexico
- 12. Europe Anthrax Treatment Market Analysis, Insights and Forecast, 2019-2031
- 12.1. Market Analysis, Insights and Forecast - By Country/Sub-region
- 12.1.1 Germany
- 12.1.2 United Kingdom
- 12.1.3 France
- 12.1.4 Italy
- 12.1.5 Spain
- 12.1.6 Rest of Europe
- 13. Asia Pacific Anthrax Treatment Market Analysis, Insights and Forecast, 2019-2031
- 13.1. Market Analysis, Insights and Forecast - By Country/Sub-region
- 13.1.1 China
- 13.1.2 Japan
- 13.1.3 India
- 13.1.4 Australia
- 13.1.5 South Korea
- 13.1.6 Rest of Asia Pacific
- 14. Middle East and Africa Anthrax Treatment Market Analysis, Insights and Forecast, 2019-2031
- 14.1. Market Analysis, Insights and Forecast - By Country/Sub-region
- 14.1.1 GCC
- 14.1.2 South Africa
- 14.1.3 Rest of Middle East and Africa
- 15. South America Anthrax Treatment Market Analysis, Insights and Forecast, 2019-2031
- 15.1. Market Analysis, Insights and Forecast - By Country/Sub-region
- 15.1.1 Brazil
- 15.1.2 Argentina
- 15.1.3 Rest of South America
- 16. Competitive Analysis
- 16.1. Global Market Share Analysis 2024
- 16.2. Company Profiles
- 16.2.1 Lilly
- 16.2.1.1. Overview
- 16.2.1.2. Products
- 16.2.1.3. SWOT Analysis
- 16.2.1.4. Recent Developments
- 16.2.1.5. Financials (Based on Availability)
- 16.2.2 Bayer AG
- 16.2.2.1. Overview
- 16.2.2.2. Products
- 16.2.2.3. SWOT Analysis
- 16.2.2.4. Recent Developments
- 16.2.2.5. Financials (Based on Availability)
- 16.2.3 Nighthawk Biosciences Inc (Elusys Therapeutics Inc )
- 16.2.3.1. Overview
- 16.2.3.2. Products
- 16.2.3.3. SWOT Analysis
- 16.2.3.4. Recent Developments
- 16.2.3.5. Financials (Based on Availability)
- 16.2.4 Almirall LLC
- 16.2.4.1. Overview
- 16.2.4.2. Products
- 16.2.4.3. SWOT Analysis
- 16.2.4.4. Recent Developments
- 16.2.4.5. Financials (Based on Availability)
- 16.2.5 Teva Pharmaceutical Industries Ltd
- 16.2.5.1. Overview
- 16.2.5.2. Products
- 16.2.5.3. SWOT Analysis
- 16.2.5.4. Recent Developments
- 16.2.5.5. Financials (Based on Availability)
- 16.2.6 Emergent
- 16.2.6.1. Overview
- 16.2.6.2. Products
- 16.2.6.3. SWOT Analysis
- 16.2.6.4. Recent Developments
- 16.2.6.5. Financials (Based on Availability)
- 16.2.7 GSK plc
- 16.2.7.1. Overview
- 16.2.7.2. Products
- 16.2.7.3. SWOT Analysis
- 16.2.7.4. Recent Developments
- 16.2.7.5. Financials (Based on Availability)
- 16.2.8 Paratek Pharmaceuticals Inc
- 16.2.8.1. Overview
- 16.2.8.2. Products
- 16.2.8.3. SWOT Analysis
- 16.2.8.4. Recent Developments
- 16.2.8.5. Financials (Based on Availability)
- 16.2.9 Pfizer Inc
- 16.2.9.1. Overview
- 16.2.9.2. Products
- 16.2.9.3. SWOT Analysis
- 16.2.9.4. Recent Developments
- 16.2.9.5. Financials (Based on Availability)
- 16.2.1 Lilly
List of Figures
- Figure 1: Global Anthrax Treatment Market Revenue Breakdown (Million, %) by Region 2024 & 2032
- Figure 2: Global Anthrax Treatment Market Volume Breakdown (K Unit, %) by Region 2024 & 2032
- Figure 3: North America Anthrax Treatment Market Revenue (Million), by Country 2024 & 2032
- Figure 4: North America Anthrax Treatment Market Volume (K Unit), by Country 2024 & 2032
- Figure 5: North America Anthrax Treatment Market Revenue Share (%), by Country 2024 & 2032
- Figure 6: North America Anthrax Treatment Market Volume Share (%), by Country 2024 & 2032
- Figure 7: Europe Anthrax Treatment Market Revenue (Million), by Country 2024 & 2032
- Figure 8: Europe Anthrax Treatment Market Volume (K Unit), by Country 2024 & 2032
- Figure 9: Europe Anthrax Treatment Market Revenue Share (%), by Country 2024 & 2032
- Figure 10: Europe Anthrax Treatment Market Volume Share (%), by Country 2024 & 2032
- Figure 11: Asia Pacific Anthrax Treatment Market Revenue (Million), by Country 2024 & 2032
- Figure 12: Asia Pacific Anthrax Treatment Market Volume (K Unit), by Country 2024 & 2032
- Figure 13: Asia Pacific Anthrax Treatment Market Revenue Share (%), by Country 2024 & 2032
- Figure 14: Asia Pacific Anthrax Treatment Market Volume Share (%), by Country 2024 & 2032
- Figure 15: Middle East and Africa Anthrax Treatment Market Revenue (Million), by Country 2024 & 2032
- Figure 16: Middle East and Africa Anthrax Treatment Market Volume (K Unit), by Country 2024 & 2032
- Figure 17: Middle East and Africa Anthrax Treatment Market Revenue Share (%), by Country 2024 & 2032
- Figure 18: Middle East and Africa Anthrax Treatment Market Volume Share (%), by Country 2024 & 2032
- Figure 19: South America Anthrax Treatment Market Revenue (Million), by Country 2024 & 2032
- Figure 20: South America Anthrax Treatment Market Volume (K Unit), by Country 2024 & 2032
- Figure 21: South America Anthrax Treatment Market Revenue Share (%), by Country 2024 & 2032
- Figure 22: South America Anthrax Treatment Market Volume Share (%), by Country 2024 & 2032
- Figure 23: North America Anthrax Treatment Market Revenue (Million), by Anthrax Type 2024 & 2032
- Figure 24: North America Anthrax Treatment Market Volume (K Unit), by Anthrax Type 2024 & 2032
- Figure 25: North America Anthrax Treatment Market Revenue Share (%), by Anthrax Type 2024 & 2032
- Figure 26: North America Anthrax Treatment Market Volume Share (%), by Anthrax Type 2024 & 2032
- Figure 27: North America Anthrax Treatment Market Revenue (Million), by Drug Class 2024 & 2032
- Figure 28: North America Anthrax Treatment Market Volume (K Unit), by Drug Class 2024 & 2032
- Figure 29: North America Anthrax Treatment Market Revenue Share (%), by Drug Class 2024 & 2032
- Figure 30: North America Anthrax Treatment Market Volume Share (%), by Drug Class 2024 & 2032
- Figure 31: North America Anthrax Treatment Market Revenue (Million), by Distribution Channel 2024 & 2032
- Figure 32: North America Anthrax Treatment Market Volume (K Unit), by Distribution Channel 2024 & 2032
- Figure 33: North America Anthrax Treatment Market Revenue Share (%), by Distribution Channel 2024 & 2032
- Figure 34: North America Anthrax Treatment Market Volume Share (%), by Distribution Channel 2024 & 2032
- Figure 35: North America Anthrax Treatment Market Revenue (Million), by Country 2024 & 2032
- Figure 36: North America Anthrax Treatment Market Volume (K Unit), by Country 2024 & 2032
- Figure 37: North America Anthrax Treatment Market Revenue Share (%), by Country 2024 & 2032
- Figure 38: North America Anthrax Treatment Market Volume Share (%), by Country 2024 & 2032
- Figure 39: Europe Anthrax Treatment Market Revenue (Million), by Anthrax Type 2024 & 2032
- Figure 40: Europe Anthrax Treatment Market Volume (K Unit), by Anthrax Type 2024 & 2032
- Figure 41: Europe Anthrax Treatment Market Revenue Share (%), by Anthrax Type 2024 & 2032
- Figure 42: Europe Anthrax Treatment Market Volume Share (%), by Anthrax Type 2024 & 2032
- Figure 43: Europe Anthrax Treatment Market Revenue (Million), by Drug Class 2024 & 2032
- Figure 44: Europe Anthrax Treatment Market Volume (K Unit), by Drug Class 2024 & 2032
- Figure 45: Europe Anthrax Treatment Market Revenue Share (%), by Drug Class 2024 & 2032
- Figure 46: Europe Anthrax Treatment Market Volume Share (%), by Drug Class 2024 & 2032
- Figure 47: Europe Anthrax Treatment Market Revenue (Million), by Distribution Channel 2024 & 2032
- Figure 48: Europe Anthrax Treatment Market Volume (K Unit), by Distribution Channel 2024 & 2032
- Figure 49: Europe Anthrax Treatment Market Revenue Share (%), by Distribution Channel 2024 & 2032
- Figure 50: Europe Anthrax Treatment Market Volume Share (%), by Distribution Channel 2024 & 2032
- Figure 51: Europe Anthrax Treatment Market Revenue (Million), by Country 2024 & 2032
- Figure 52: Europe Anthrax Treatment Market Volume (K Unit), by Country 2024 & 2032
- Figure 53: Europe Anthrax Treatment Market Revenue Share (%), by Country 2024 & 2032
- Figure 54: Europe Anthrax Treatment Market Volume Share (%), by Country 2024 & 2032
- Figure 55: Asia Pacific Anthrax Treatment Market Revenue (Million), by Anthrax Type 2024 & 2032
- Figure 56: Asia Pacific Anthrax Treatment Market Volume (K Unit), by Anthrax Type 2024 & 2032
- Figure 57: Asia Pacific Anthrax Treatment Market Revenue Share (%), by Anthrax Type 2024 & 2032
- Figure 58: Asia Pacific Anthrax Treatment Market Volume Share (%), by Anthrax Type 2024 & 2032
- Figure 59: Asia Pacific Anthrax Treatment Market Revenue (Million), by Drug Class 2024 & 2032
- Figure 60: Asia Pacific Anthrax Treatment Market Volume (K Unit), by Drug Class 2024 & 2032
- Figure 61: Asia Pacific Anthrax Treatment Market Revenue Share (%), by Drug Class 2024 & 2032
- Figure 62: Asia Pacific Anthrax Treatment Market Volume Share (%), by Drug Class 2024 & 2032
- Figure 63: Asia Pacific Anthrax Treatment Market Revenue (Million), by Distribution Channel 2024 & 2032
- Figure 64: Asia Pacific Anthrax Treatment Market Volume (K Unit), by Distribution Channel 2024 & 2032
- Figure 65: Asia Pacific Anthrax Treatment Market Revenue Share (%), by Distribution Channel 2024 & 2032
- Figure 66: Asia Pacific Anthrax Treatment Market Volume Share (%), by Distribution Channel 2024 & 2032
- Figure 67: Asia Pacific Anthrax Treatment Market Revenue (Million), by Country 2024 & 2032
- Figure 68: Asia Pacific Anthrax Treatment Market Volume (K Unit), by Country 2024 & 2032
- Figure 69: Asia Pacific Anthrax Treatment Market Revenue Share (%), by Country 2024 & 2032
- Figure 70: Asia Pacific Anthrax Treatment Market Volume Share (%), by Country 2024 & 2032
- Figure 71: Middle East and Africa Anthrax Treatment Market Revenue (Million), by Anthrax Type 2024 & 2032
- Figure 72: Middle East and Africa Anthrax Treatment Market Volume (K Unit), by Anthrax Type 2024 & 2032
- Figure 73: Middle East and Africa Anthrax Treatment Market Revenue Share (%), by Anthrax Type 2024 & 2032
- Figure 74: Middle East and Africa Anthrax Treatment Market Volume Share (%), by Anthrax Type 2024 & 2032
- Figure 75: Middle East and Africa Anthrax Treatment Market Revenue (Million), by Drug Class 2024 & 2032
- Figure 76: Middle East and Africa Anthrax Treatment Market Volume (K Unit), by Drug Class 2024 & 2032
- Figure 77: Middle East and Africa Anthrax Treatment Market Revenue Share (%), by Drug Class 2024 & 2032
- Figure 78: Middle East and Africa Anthrax Treatment Market Volume Share (%), by Drug Class 2024 & 2032
- Figure 79: Middle East and Africa Anthrax Treatment Market Revenue (Million), by Distribution Channel 2024 & 2032
- Figure 80: Middle East and Africa Anthrax Treatment Market Volume (K Unit), by Distribution Channel 2024 & 2032
- Figure 81: Middle East and Africa Anthrax Treatment Market Revenue Share (%), by Distribution Channel 2024 & 2032
- Figure 82: Middle East and Africa Anthrax Treatment Market Volume Share (%), by Distribution Channel 2024 & 2032
- Figure 83: Middle East and Africa Anthrax Treatment Market Revenue (Million), by Country 2024 & 2032
- Figure 84: Middle East and Africa Anthrax Treatment Market Volume (K Unit), by Country 2024 & 2032
- Figure 85: Middle East and Africa Anthrax Treatment Market Revenue Share (%), by Country 2024 & 2032
- Figure 86: Middle East and Africa Anthrax Treatment Market Volume Share (%), by Country 2024 & 2032
- Figure 87: South America Anthrax Treatment Market Revenue (Million), by Anthrax Type 2024 & 2032
- Figure 88: South America Anthrax Treatment Market Volume (K Unit), by Anthrax Type 2024 & 2032
- Figure 89: South America Anthrax Treatment Market Revenue Share (%), by Anthrax Type 2024 & 2032
- Figure 90: South America Anthrax Treatment Market Volume Share (%), by Anthrax Type 2024 & 2032
- Figure 91: South America Anthrax Treatment Market Revenue (Million), by Drug Class 2024 & 2032
- Figure 92: South America Anthrax Treatment Market Volume (K Unit), by Drug Class 2024 & 2032
- Figure 93: South America Anthrax Treatment Market Revenue Share (%), by Drug Class 2024 & 2032
- Figure 94: South America Anthrax Treatment Market Volume Share (%), by Drug Class 2024 & 2032
- Figure 95: South America Anthrax Treatment Market Revenue (Million), by Distribution Channel 2024 & 2032
- Figure 96: South America Anthrax Treatment Market Volume (K Unit), by Distribution Channel 2024 & 2032
- Figure 97: South America Anthrax Treatment Market Revenue Share (%), by Distribution Channel 2024 & 2032
- Figure 98: South America Anthrax Treatment Market Volume Share (%), by Distribution Channel 2024 & 2032
- Figure 99: South America Anthrax Treatment Market Revenue (Million), by Country 2024 & 2032
- Figure 100: South America Anthrax Treatment Market Volume (K Unit), by Country 2024 & 2032
- Figure 101: South America Anthrax Treatment Market Revenue Share (%), by Country 2024 & 2032
- Figure 102: South America Anthrax Treatment Market Volume Share (%), by Country 2024 & 2032
List of Tables
- Table 1: Global Anthrax Treatment Market Revenue Million Forecast, by Region 2019 & 2032
- Table 2: Global Anthrax Treatment Market Volume K Unit Forecast, by Region 2019 & 2032
- Table 3: Global Anthrax Treatment Market Revenue Million Forecast, by Anthrax Type 2019 & 2032
- Table 4: Global Anthrax Treatment Market Volume K Unit Forecast, by Anthrax Type 2019 & 2032
- Table 5: Global Anthrax Treatment Market Revenue Million Forecast, by Drug Class 2019 & 2032
- Table 6: Global Anthrax Treatment Market Volume K Unit Forecast, by Drug Class 2019 & 2032
- Table 7: Global Anthrax Treatment Market Revenue Million Forecast, by Distribution Channel 2019 & 2032
- Table 8: Global Anthrax Treatment Market Volume K Unit Forecast, by Distribution Channel 2019 & 2032
- Table 9: Global Anthrax Treatment Market Revenue Million Forecast, by Region 2019 & 2032
- Table 10: Global Anthrax Treatment Market Volume K Unit Forecast, by Region 2019 & 2032
- Table 11: Global Anthrax Treatment Market Revenue Million Forecast, by Country 2019 & 2032
- Table 12: Global Anthrax Treatment Market Volume K Unit Forecast, by Country 2019 & 2032
- Table 13: United States Anthrax Treatment Market Revenue (Million) Forecast, by Application 2019 & 2032
- Table 14: United States Anthrax Treatment Market Volume (K Unit) Forecast, by Application 2019 & 2032
- Table 15: Canada Anthrax Treatment Market Revenue (Million) Forecast, by Application 2019 & 2032
- Table 16: Canada Anthrax Treatment Market Volume (K Unit) Forecast, by Application 2019 & 2032
- Table 17: Mexico Anthrax Treatment Market Revenue (Million) Forecast, by Application 2019 & 2032
- Table 18: Mexico Anthrax Treatment Market Volume (K Unit) Forecast, by Application 2019 & 2032
- Table 19: Global Anthrax Treatment Market Revenue Million Forecast, by Country 2019 & 2032
- Table 20: Global Anthrax Treatment Market Volume K Unit Forecast, by Country 2019 & 2032
- Table 21: Germany Anthrax Treatment Market Revenue (Million) Forecast, by Application 2019 & 2032
- Table 22: Germany Anthrax Treatment Market Volume (K Unit) Forecast, by Application 2019 & 2032
- Table 23: United Kingdom Anthrax Treatment Market Revenue (Million) Forecast, by Application 2019 & 2032
- Table 24: United Kingdom Anthrax Treatment Market Volume (K Unit) Forecast, by Application 2019 & 2032
- Table 25: France Anthrax Treatment Market Revenue (Million) Forecast, by Application 2019 & 2032
- Table 26: France Anthrax Treatment Market Volume (K Unit) Forecast, by Application 2019 & 2032
- Table 27: Italy Anthrax Treatment Market Revenue (Million) Forecast, by Application 2019 & 2032
- Table 28: Italy Anthrax Treatment Market Volume (K Unit) Forecast, by Application 2019 & 2032
- Table 29: Spain Anthrax Treatment Market Revenue (Million) Forecast, by Application 2019 & 2032
- Table 30: Spain Anthrax Treatment Market Volume (K Unit) Forecast, by Application 2019 & 2032
- Table 31: Rest of Europe Anthrax Treatment Market Revenue (Million) Forecast, by Application 2019 & 2032
- Table 32: Rest of Europe Anthrax Treatment Market Volume (K Unit) Forecast, by Application 2019 & 2032
- Table 33: Global Anthrax Treatment Market Revenue Million Forecast, by Country 2019 & 2032
- Table 34: Global Anthrax Treatment Market Volume K Unit Forecast, by Country 2019 & 2032
- Table 35: China Anthrax Treatment Market Revenue (Million) Forecast, by Application 2019 & 2032
- Table 36: China Anthrax Treatment Market Volume (K Unit) Forecast, by Application 2019 & 2032
- Table 37: Japan Anthrax Treatment Market Revenue (Million) Forecast, by Application 2019 & 2032
- Table 38: Japan Anthrax Treatment Market Volume (K Unit) Forecast, by Application 2019 & 2032
- Table 39: India Anthrax Treatment Market Revenue (Million) Forecast, by Application 2019 & 2032
- Table 40: India Anthrax Treatment Market Volume (K Unit) Forecast, by Application 2019 & 2032
- Table 41: Australia Anthrax Treatment Market Revenue (Million) Forecast, by Application 2019 & 2032
- Table 42: Australia Anthrax Treatment Market Volume (K Unit) Forecast, by Application 2019 & 2032
- Table 43: South Korea Anthrax Treatment Market Revenue (Million) Forecast, by Application 2019 & 2032
- Table 44: South Korea Anthrax Treatment Market Volume (K Unit) Forecast, by Application 2019 & 2032
- Table 45: Rest of Asia Pacific Anthrax Treatment Market Revenue (Million) Forecast, by Application 2019 & 2032
- Table 46: Rest of Asia Pacific Anthrax Treatment Market Volume (K Unit) Forecast, by Application 2019 & 2032
- Table 47: Global Anthrax Treatment Market Revenue Million Forecast, by Country 2019 & 2032
- Table 48: Global Anthrax Treatment Market Volume K Unit Forecast, by Country 2019 & 2032
- Table 49: GCC Anthrax Treatment Market Revenue (Million) Forecast, by Application 2019 & 2032
- Table 50: GCC Anthrax Treatment Market Volume (K Unit) Forecast, by Application 2019 & 2032
- Table 51: South Africa Anthrax Treatment Market Revenue (Million) Forecast, by Application 2019 & 2032
- Table 52: South Africa Anthrax Treatment Market Volume (K Unit) Forecast, by Application 2019 & 2032
- Table 53: Rest of Middle East and Africa Anthrax Treatment Market Revenue (Million) Forecast, by Application 2019 & 2032
- Table 54: Rest of Middle East and Africa Anthrax Treatment Market Volume (K Unit) Forecast, by Application 2019 & 2032
- Table 55: Global Anthrax Treatment Market Revenue Million Forecast, by Country 2019 & 2032
- Table 56: Global Anthrax Treatment Market Volume K Unit Forecast, by Country 2019 & 2032
- Table 57: Brazil Anthrax Treatment Market Revenue (Million) Forecast, by Application 2019 & 2032
- Table 58: Brazil Anthrax Treatment Market Volume (K Unit) Forecast, by Application 2019 & 2032
- Table 59: Argentina Anthrax Treatment Market Revenue (Million) Forecast, by Application 2019 & 2032
- Table 60: Argentina Anthrax Treatment Market Volume (K Unit) Forecast, by Application 2019 & 2032
- Table 61: Rest of South America Anthrax Treatment Market Revenue (Million) Forecast, by Application 2019 & 2032
- Table 62: Rest of South America Anthrax Treatment Market Volume (K Unit) Forecast, by Application 2019 & 2032
- Table 63: Global Anthrax Treatment Market Revenue Million Forecast, by Anthrax Type 2019 & 2032
- Table 64: Global Anthrax Treatment Market Volume K Unit Forecast, by Anthrax Type 2019 & 2032
- Table 65: Global Anthrax Treatment Market Revenue Million Forecast, by Drug Class 2019 & 2032
- Table 66: Global Anthrax Treatment Market Volume K Unit Forecast, by Drug Class 2019 & 2032
- Table 67: Global Anthrax Treatment Market Revenue Million Forecast, by Distribution Channel 2019 & 2032
- Table 68: Global Anthrax Treatment Market Volume K Unit Forecast, by Distribution Channel 2019 & 2032
- Table 69: Global Anthrax Treatment Market Revenue Million Forecast, by Country 2019 & 2032
- Table 70: Global Anthrax Treatment Market Volume K Unit Forecast, by Country 2019 & 2032
- Table 71: United States Anthrax Treatment Market Revenue (Million) Forecast, by Application 2019 & 2032
- Table 72: United States Anthrax Treatment Market Volume (K Unit) Forecast, by Application 2019 & 2032
- Table 73: Canada Anthrax Treatment Market Revenue (Million) Forecast, by Application 2019 & 2032
- Table 74: Canada Anthrax Treatment Market Volume (K Unit) Forecast, by Application 2019 & 2032
- Table 75: Mexico Anthrax Treatment Market Revenue (Million) Forecast, by Application 2019 & 2032
- Table 76: Mexico Anthrax Treatment Market Volume (K Unit) Forecast, by Application 2019 & 2032
- Table 77: Global Anthrax Treatment Market Revenue Million Forecast, by Anthrax Type 2019 & 2032
- Table 78: Global Anthrax Treatment Market Volume K Unit Forecast, by Anthrax Type 2019 & 2032
- Table 79: Global Anthrax Treatment Market Revenue Million Forecast, by Drug Class 2019 & 2032
- Table 80: Global Anthrax Treatment Market Volume K Unit Forecast, by Drug Class 2019 & 2032
- Table 81: Global Anthrax Treatment Market Revenue Million Forecast, by Distribution Channel 2019 & 2032
- Table 82: Global Anthrax Treatment Market Volume K Unit Forecast, by Distribution Channel 2019 & 2032
- Table 83: Global Anthrax Treatment Market Revenue Million Forecast, by Country 2019 & 2032
- Table 84: Global Anthrax Treatment Market Volume K Unit Forecast, by Country 2019 & 2032
- Table 85: Germany Anthrax Treatment Market Revenue (Million) Forecast, by Application 2019 & 2032
- Table 86: Germany Anthrax Treatment Market Volume (K Unit) Forecast, by Application 2019 & 2032
- Table 87: United Kingdom Anthrax Treatment Market Revenue (Million) Forecast, by Application 2019 & 2032
- Table 88: United Kingdom Anthrax Treatment Market Volume (K Unit) Forecast, by Application 2019 & 2032
- Table 89: France Anthrax Treatment Market Revenue (Million) Forecast, by Application 2019 & 2032
- Table 90: France Anthrax Treatment Market Volume (K Unit) Forecast, by Application 2019 & 2032
- Table 91: Italy Anthrax Treatment Market Revenue (Million) Forecast, by Application 2019 & 2032
- Table 92: Italy Anthrax Treatment Market Volume (K Unit) Forecast, by Application 2019 & 2032
- Table 93: Spain Anthrax Treatment Market Revenue (Million) Forecast, by Application 2019 & 2032
- Table 94: Spain Anthrax Treatment Market Volume (K Unit) Forecast, by Application 2019 & 2032
- Table 95: Rest of Europe Anthrax Treatment Market Revenue (Million) Forecast, by Application 2019 & 2032
- Table 96: Rest of Europe Anthrax Treatment Market Volume (K Unit) Forecast, by Application 2019 & 2032
- Table 97: Global Anthrax Treatment Market Revenue Million Forecast, by Anthrax Type 2019 & 2032
- Table 98: Global Anthrax Treatment Market Volume K Unit Forecast, by Anthrax Type 2019 & 2032
- Table 99: Global Anthrax Treatment Market Revenue Million Forecast, by Drug Class 2019 & 2032
- Table 100: Global Anthrax Treatment Market Volume K Unit Forecast, by Drug Class 2019 & 2032
- Table 101: Global Anthrax Treatment Market Revenue Million Forecast, by Distribution Channel 2019 & 2032
- Table 102: Global Anthrax Treatment Market Volume K Unit Forecast, by Distribution Channel 2019 & 2032
- Table 103: Global Anthrax Treatment Market Revenue Million Forecast, by Country 2019 & 2032
- Table 104: Global Anthrax Treatment Market Volume K Unit Forecast, by Country 2019 & 2032
- Table 105: China Anthrax Treatment Market Revenue (Million) Forecast, by Application 2019 & 2032
- Table 106: China Anthrax Treatment Market Volume (K Unit) Forecast, by Application 2019 & 2032
- Table 107: Japan Anthrax Treatment Market Revenue (Million) Forecast, by Application 2019 & 2032
- Table 108: Japan Anthrax Treatment Market Volume (K Unit) Forecast, by Application 2019 & 2032
- Table 109: India Anthrax Treatment Market Revenue (Million) Forecast, by Application 2019 & 2032
- Table 110: India Anthrax Treatment Market Volume (K Unit) Forecast, by Application 2019 & 2032
- Table 111: Australia Anthrax Treatment Market Revenue (Million) Forecast, by Application 2019 & 2032
- Table 112: Australia Anthrax Treatment Market Volume (K Unit) Forecast, by Application 2019 & 2032
- Table 113: South Korea Anthrax Treatment Market Revenue (Million) Forecast, by Application 2019 & 2032
- Table 114: South Korea Anthrax Treatment Market Volume (K Unit) Forecast, by Application 2019 & 2032
- Table 115: Rest of Asia Pacific Anthrax Treatment Market Revenue (Million) Forecast, by Application 2019 & 2032
- Table 116: Rest of Asia Pacific Anthrax Treatment Market Volume (K Unit) Forecast, by Application 2019 & 2032
- Table 117: Global Anthrax Treatment Market Revenue Million Forecast, by Anthrax Type 2019 & 2032
- Table 118: Global Anthrax Treatment Market Volume K Unit Forecast, by Anthrax Type 2019 & 2032
- Table 119: Global Anthrax Treatment Market Revenue Million Forecast, by Drug Class 2019 & 2032
- Table 120: Global Anthrax Treatment Market Volume K Unit Forecast, by Drug Class 2019 & 2032
- Table 121: Global Anthrax Treatment Market Revenue Million Forecast, by Distribution Channel 2019 & 2032
- Table 122: Global Anthrax Treatment Market Volume K Unit Forecast, by Distribution Channel 2019 & 2032
- Table 123: Global Anthrax Treatment Market Revenue Million Forecast, by Country 2019 & 2032
- Table 124: Global Anthrax Treatment Market Volume K Unit Forecast, by Country 2019 & 2032
- Table 125: GCC Anthrax Treatment Market Revenue (Million) Forecast, by Application 2019 & 2032
- Table 126: GCC Anthrax Treatment Market Volume (K Unit) Forecast, by Application 2019 & 2032
- Table 127: South Africa Anthrax Treatment Market Revenue (Million) Forecast, by Application 2019 & 2032
- Table 128: South Africa Anthrax Treatment Market Volume (K Unit) Forecast, by Application 2019 & 2032
- Table 129: Rest of Middle East and Africa Anthrax Treatment Market Revenue (Million) Forecast, by Application 2019 & 2032
- Table 130: Rest of Middle East and Africa Anthrax Treatment Market Volume (K Unit) Forecast, by Application 2019 & 2032
- Table 131: Global Anthrax Treatment Market Revenue Million Forecast, by Anthrax Type 2019 & 2032
- Table 132: Global Anthrax Treatment Market Volume K Unit Forecast, by Anthrax Type 2019 & 2032
- Table 133: Global Anthrax Treatment Market Revenue Million Forecast, by Drug Class 2019 & 2032
- Table 134: Global Anthrax Treatment Market Volume K Unit Forecast, by Drug Class 2019 & 2032
- Table 135: Global Anthrax Treatment Market Revenue Million Forecast, by Distribution Channel 2019 & 2032
- Table 136: Global Anthrax Treatment Market Volume K Unit Forecast, by Distribution Channel 2019 & 2032
- Table 137: Global Anthrax Treatment Market Revenue Million Forecast, by Country 2019 & 2032
- Table 138: Global Anthrax Treatment Market Volume K Unit Forecast, by Country 2019 & 2032
- Table 139: Brazil Anthrax Treatment Market Revenue (Million) Forecast, by Application 2019 & 2032
- Table 140: Brazil Anthrax Treatment Market Volume (K Unit) Forecast, by Application 2019 & 2032
- Table 141: Argentina Anthrax Treatment Market Revenue (Million) Forecast, by Application 2019 & 2032
- Table 142: Argentina Anthrax Treatment Market Volume (K Unit) Forecast, by Application 2019 & 2032
- Table 143: Rest of South America Anthrax Treatment Market Revenue (Million) Forecast, by Application 2019 & 2032
- Table 144: Rest of South America Anthrax Treatment Market Volume (K Unit) Forecast, by Application 2019 & 2032
Frequently Asked Questions
1. What is the projected Compound Annual Growth Rate (CAGR) of the Anthrax Treatment Market?
The projected CAGR is approximately 7.80%.
2. Which companies are prominent players in the Anthrax Treatment Market?
Key companies in the market include Lilly, Bayer AG, Nighthawk Biosciences Inc (Elusys Therapeutics Inc ), Almirall LLC, Teva Pharmaceutical Industries Ltd, Emergent, GSK plc, Paratek Pharmaceuticals Inc, Pfizer Inc.
3. What are the main segments of the Anthrax Treatment Market?
The market segments include Anthrax Type, Drug Class, Distribution Channel.
4. Can you provide details about the market size?
The market size is estimated to be USD XX Million as of 2022.
5. What are some drivers contributing to market growth?
Increase in Research Funding; Development of Novel Therapies for Treatment of Anthrax.
6. What are the notable trends driving market growth?
Inhalation Anthrax Segment is Expected to Dominate During the Forecast Period.
7. Are there any restraints impacting market growth?
High Cost Associated with Diagnostic Treatment.
8. Can you provide examples of recent developments in the market?
In April 2022, NightHawk Biosciences completed the acquisition of Elusys Therapeutics, Inc., a commercial-stage biodefense company and developer of ANTHIM (obiltoxaximab), a treatment for inhalation anthrax.
9. What pricing options are available for accessing the report?
Pricing options include single-user, multi-user, and enterprise licenses priced at USD 4750, USD 5250, and USD 8750 respectively.
10. Is the market size provided in terms of value or volume?
The market size is provided in terms of value, measured in Million and volume, measured in K Unit.
11. Are there any specific market keywords associated with the report?
Yes, the market keyword associated with the report is "Anthrax Treatment Market," which aids in identifying and referencing the specific market segment covered.
12. How do I determine which pricing option suits my needs best?
The pricing options vary based on user requirements and access needs. Individual users may opt for single-user licenses, while businesses requiring broader access may choose multi-user or enterprise licenses for cost-effective access to the report.
13. Are there any additional resources or data provided in the Anthrax Treatment Market report?
While the report offers comprehensive insights, it's advisable to review the specific contents or supplementary materials provided to ascertain if additional resources or data are available.
14. How can I stay updated on further developments or reports in the Anthrax Treatment Market?
To stay informed about further developments, trends, and reports in the Anthrax Treatment Market, consider subscribing to industry newsletters, following relevant companies and organizations, or regularly checking reputable industry news sources and publications.
Methodology
Step 1 - Identification of Relevant Samples Size from Population Database


Step 2 - Approaches for Defining Global Market Size (Value, Volume* & Price*)

Note*: In applicable scenarios
Step 3 - Data Sources
Primary Research
- Web Analytics
- Survey Reports
- Research Institute
- Latest Research Reports
- Opinion Leaders
Secondary Research
- Annual Reports
- White Paper
- Latest Press Release
- Industry Association
- Paid Database
- Investor Presentations

Step 4 - Data Triangulation
Involves using different sources of information in order to increase the validity of a study
These sources are likely to be stakeholders in a program - participants, other researchers, program staff, other community members, and so on.
Then we put all data in single framework & apply various statistical tools to find out the dynamic on the market.
During the analysis stage, feedback from the stakeholder groups would be compared to determine areas of agreement as well as areas of divergence
