

Key Insights
The Parks and Recreation Event Management Software market is experiencing robust growth, driven by increasing demand for efficient resource allocation, streamlined registration processes, and enhanced participant engagement within parks and recreation departments. The market's expansion is fueled by the rising adoption of cloud-based solutions offering scalability, accessibility, and cost-effectiveness compared to traditional on-premise systems. Furthermore, the integration of mobile applications and online payment gateways enhances convenience for both administrators and participants. We estimate the market size to be approximately $500 million in 2025, exhibiting a Compound Annual Growth Rate (CAGR) of 12% between 2025 and 2033. This growth is projected to be consistent across various segments, including facility management software, registration and payment systems, and marketing and communication tools. Key restraining factors include the initial investment costs for software implementation and the need for ongoing training and support, particularly for smaller municipalities with limited IT resources. However, the long-term cost savings and efficiency gains associated with these systems are expected to outweigh these initial hurdles.
The competitive landscape is characterized by a mix of established players and emerging technology providers. Established players like CivicPlus, Tyler Technologies, and Yardi offer comprehensive suites of software, while newer companies like RecDesk and Omnify are gaining traction with their user-friendly interfaces and specialized features. The market is witnessing increased mergers and acquisitions as larger companies seek to consolidate their market share and expand their product offerings. The North American market currently holds a dominant position due to higher technology adoption rates and increased government funding for recreation initiatives; however, significant growth potential exists in other regions, particularly in Europe and Asia-Pacific, driven by rising urbanization and increased disposable incomes. Future market developments will likely involve the integration of artificial intelligence (AI) and machine learning (ML) for predictive analytics, automated scheduling, and personalized recommendations, further optimizing resource allocation and enhancing user experience.

Parks and Recreation Event Management Software Market Report: 2019-2033
This comprehensive report provides an in-depth analysis of the Parks and Recreation Event Management Software market, encompassing market dynamics, growth trends, regional analysis, competitive landscape, and future outlook. The study period covers 2019-2033, with 2025 as the base and estimated year. The forecast period spans 2025-2033, and the historical period encompasses 2019-2024. This report is crucial for industry professionals, investors, and stakeholders seeking a clear understanding of this rapidly evolving market.
Parks and Recreation Event Management Software Market Dynamics & Structure
This section analyzes the market's competitive landscape, technological advancements, regulatory influences, and market trends. The global Parks and Recreation Event Management Software market is estimated to be valued at $XX million in 2025 and is projected to reach $XX million by 2033, exhibiting a CAGR of XX%.
Market Concentration & Competition: The market exhibits a moderately fragmented structure, with key players like CivicPlus, CommunityPass, and Xplor Recreation holding significant market share, but numerous smaller players also competing. Market share is expected to shift slightly by 2033 with the emergence of new technology and cloud-based solutions.
- Market Concentration: XX% of the market is controlled by the top 5 players in 2025.
- M&A Activity: An estimated XX M&A deals occurred in the historical period, with a projected XX deals during the forecast period. Consolidation is expected to continue.
- Technological Innovation: Cloud-based solutions, mobile accessibility, and AI-powered features are driving innovation. Barriers to entry include high development costs and the need for robust security measures.
- Regulatory Frameworks: Government regulations concerning data privacy and accessibility significantly impact software development and adoption. Compliance standards vary across regions.
- Competitive Product Substitutes: Spreadsheet software and basic scheduling tools provide limited substitutes but lack the comprehensive features of dedicated software.
- End-User Demographics: Municipalities, parks departments, recreation centers, and private sports organizations constitute the primary end-users. Growth is fueled by increasing urbanization and rising demand for recreational activities.
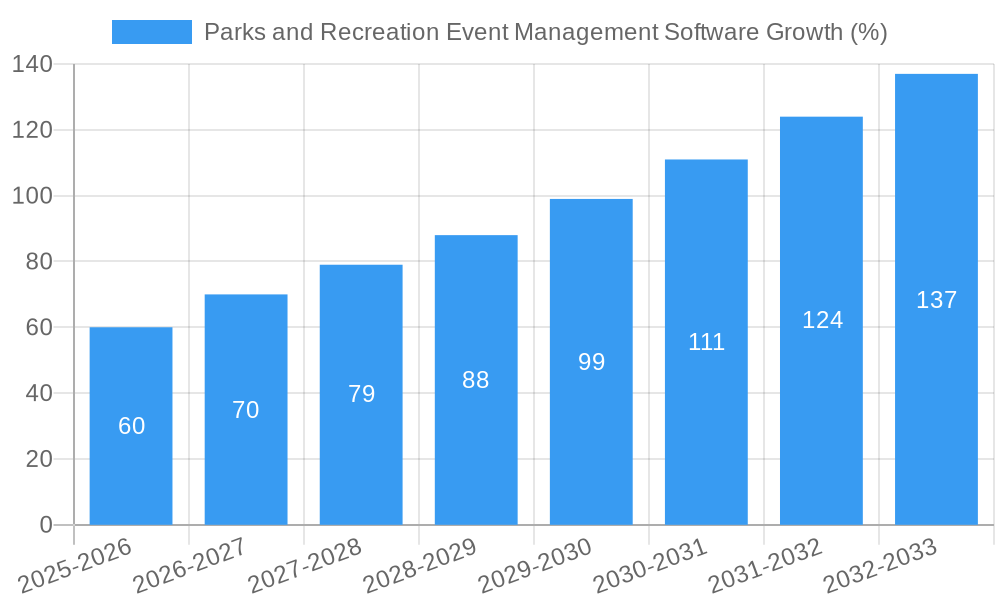
Parks and Recreation Event Management Software Growth Trends & Insights
The Parks and Recreation Event Management Software market has witnessed significant growth driven by the increasing need for efficient resource management, improved customer engagement, and enhanced operational efficiency within parks and recreation departments. Adoption rates are increasing steadily, particularly among larger municipalities and organizations with complex event schedules.
- Market Size Evolution: The market grew from $XX million in 2019 to an estimated $XX million in 2025.
- Adoption Rates: Adoption is higher in developed regions with greater technological infrastructure and budgetary resources. XX% of municipalities in North America are estimated to use dedicated software in 2025.
- Technological Disruptions: The shift towards cloud-based solutions, mobile apps, and AI-powered features are disrupting traditional software models.
- Consumer Behavior Shifts: Increased demand for online registration, self-service portals, and personalized experiences are driving software adoption.
Dominant Regions, Countries, or Segments in Parks and Recreation Event Management Software
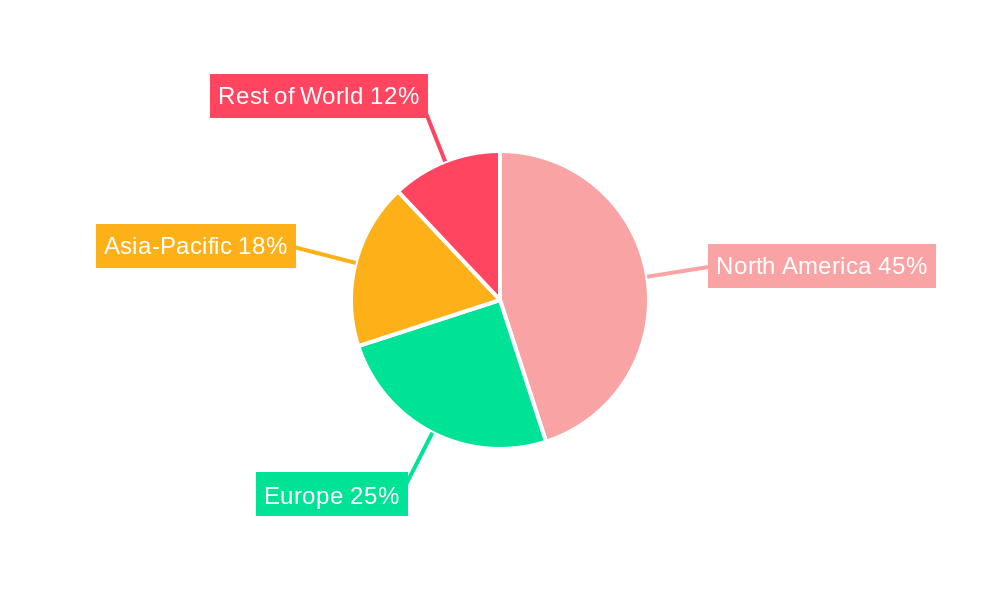
North America currently dominates the market, driven by high technological adoption rates and a well-established infrastructure. However, the Asia-Pacific region is expected to show the highest growth rate during the forecast period.
- North America: High adoption rates, significant government funding, and a mature technology market drive market leadership.
- Europe: Stringent data privacy regulations and fragmented market dynamics slightly slow market growth.
- Asia-Pacific: Rapid urbanization, increasing disposable incomes, and government initiatives focused on infrastructure development create significant growth opportunities.
- Key Drivers: Increased government funding for recreational facilities, growing awareness of the benefits of software solutions, and rising demand for efficient event management are key drivers across all regions.
Parks and Recreation Event Management Software Product Landscape
The market offers a range of software solutions, from basic scheduling tools to comprehensive platforms integrating registration, payment processing, resource management, and communication features. Key innovations include AI-driven features for predictive analytics and automated workflows, enhancing efficiency and reducing operational costs. Cloud-based solutions offer scalability and accessibility, while mobile apps improve user engagement and convenience.
Key Drivers, Barriers & Challenges in Parks and Recreation Event Management Software
Key Drivers:
- Increasing need for efficient resource management and cost optimization.
- Growing demand for enhanced customer engagement and improved user experience.
- Government initiatives promoting digital transformation in public sector organizations.
- Technological advancements like cloud computing and AI-powered features.
Key Challenges:
- High initial investment costs can hinder adoption, particularly for smaller organizations.
- Data security and privacy concerns represent a significant challenge.
- Integration with existing legacy systems can be complex and time-consuming.
- Competition from free or low-cost alternatives may limit market penetration for premium software solutions.
Emerging Opportunities in Parks and Recreation Event Management Software
Emerging opportunities include the integration of wearable technology for fitness tracking and personalized recommendations, the development of gamified features to improve user engagement, and the expansion into untapped markets such as smaller municipalities and community organizations. The integration of smart city initiatives and the Internet of Things (IoT) will also open new avenues for innovative applications.
Growth Accelerators in the Parks and Recreation Event Management Software Industry
Long-term growth will be fueled by technological advancements, strategic partnerships between software vendors and municipalities, and the expansion of software solutions into new markets. Government initiatives promoting digital transformation and investment in recreational infrastructure will further accelerate market growth.
Key Players Shaping the Parks and Recreation Event Management Software Market
- CivicPlus
- CommunityPass
- Vermont Systems (Note: This may need clarification as to the specific software division)
- Xplor Recreation
- EZFacility
- Tyler
- FinnlySport
- RecDesk
- eTrak
- Jarvis
- MyRec
- Timely
- Cityworks
- Omnify
- Aspira
- Yardi
- BlueRec
- Legend Software
- Esri
- Sportsman
- AthleteTrax
Notable Milestones in Parks and Recreation Event Management Software Sector
- 2020: Increased adoption of cloud-based solutions due to the pandemic.
- 2021: Launch of several AI-powered features by leading vendors.
- 2022: Significant investments in mobile app development and user experience improvements.
- 2023: Several mergers and acquisitions consolidating the market landscape.
- 2024: Growing adoption of integrated payment processing features.
In-Depth Parks and Recreation Event Management Software Market Outlook
The Parks and Recreation Event Management Software market is poised for sustained growth driven by ongoing technological advancements, increasing demand for efficient resource management, and expanding market penetration in both developed and developing regions. Strategic partnerships, market consolidation, and innovative applications will further enhance market potential, creating substantial opportunities for industry players.
Parks and Recreation Event Management Software Segmentation
-
1. Application
- 1.1. Government
- 1.2. Non-profit Organization
-
2. Types
- 2.1. Cloud-based
- 2.2. On-premise
Parks and Recreation Event Management Software Segmentation By Geography
-
1. North America
- 1.1. United States
- 1.2. Canada
- 1.3. Mexico
-
2. South America
- 2.1. Brazil
- 2.2. Argentina
- 2.3. Rest of South America
-
3. Europe
- 3.1. United Kingdom
- 3.2. Germany
- 3.3. France
- 3.4. Italy
- 3.5. Spain
- 3.6. Russia
- 3.7. Benelux
- 3.8. Nordics
- 3.9. Rest of Europe
-
4. Middle East & Africa
- 4.1. Turkey
- 4.2. Israel
- 4.3. GCC
- 4.4. North Africa
- 4.5. South Africa
- 4.6. Rest of Middle East & Africa
-
5. Asia Pacific
- 5.1. China
- 5.2. India
- 5.3. Japan
- 5.4. South Korea
- 5.5. ASEAN
- 5.6. Oceania
- 5.7. Rest of Asia Pacific
Parks and Recreation Event Management Software REPORT HIGHLIGHTS
| Aspects | Details |
|---|---|
| Study Period | 2019-2033 |
| Base Year | 2024 |
| Estimated Year | 2025 |
| Forecast Period | 2025-2033 |
| Historical Period | 2019-2024 |
| Growth Rate | CAGR of XX% from 2019-2033 |
| Segmentation |
|
Table of Contents
- 1. Introduction
- 1.1. Research Scope
- 1.2. Market Segmentation
- 1.3. Research Methodology
- 1.4. Definitions and Assumptions
- 2. Executive Summary
- 2.1. Introduction
- 3. Market Dynamics
- 3.1. Introduction
- 3.2. Market Drivers
- 3.3. Market Restrains
- 3.4. Market Trends
- 4. Market Factor Analysis
- 4.1. Porters Five Forces
- 4.2. Supply/Value Chain
- 4.3. PESTEL analysis
- 4.4. Market Entropy
- 4.5. Patent/Trademark Analysis
- 5. Global Parks and Recreation Event Management Software Analysis, Insights and Forecast, 2019-2031
- 5.1. Market Analysis, Insights and Forecast - by Application
- 5.1.1. Government
- 5.1.2. Non-profit Organization
- 5.2. Market Analysis, Insights and Forecast - by Types
- 5.2.1. Cloud-based
- 5.2.2. On-premise
- 5.3. Market Analysis, Insights and Forecast - by Region
- 5.3.1. North America
- 5.3.2. South America
- 5.3.3. Europe
- 5.3.4. Middle East & Africa
- 5.3.5. Asia Pacific
- 5.1. Market Analysis, Insights and Forecast - by Application
- 6. North America Parks and Recreation Event Management Software Analysis, Insights and Forecast, 2019-2031
- 6.1. Market Analysis, Insights and Forecast - by Application
- 6.1.1. Government
- 6.1.2. Non-profit Organization
- 6.2. Market Analysis, Insights and Forecast - by Types
- 6.2.1. Cloud-based
- 6.2.2. On-premise
- 6.1. Market Analysis, Insights and Forecast - by Application
- 7. South America Parks and Recreation Event Management Software Analysis, Insights and Forecast, 2019-2031
- 7.1. Market Analysis, Insights and Forecast - by Application
- 7.1.1. Government
- 7.1.2. Non-profit Organization
- 7.2. Market Analysis, Insights and Forecast - by Types
- 7.2.1. Cloud-based
- 7.2.2. On-premise
- 7.1. Market Analysis, Insights and Forecast - by Application
- 8. Europe Parks and Recreation Event Management Software Analysis, Insights and Forecast, 2019-2031
- 8.1. Market Analysis, Insights and Forecast - by Application
- 8.1.1. Government
- 8.1.2. Non-profit Organization
- 8.2. Market Analysis, Insights and Forecast - by Types
- 8.2.1. Cloud-based
- 8.2.2. On-premise
- 8.1. Market Analysis, Insights and Forecast - by Application
- 9. Middle East & Africa Parks and Recreation Event Management Software Analysis, Insights and Forecast, 2019-2031
- 9.1. Market Analysis, Insights and Forecast - by Application
- 9.1.1. Government
- 9.1.2. Non-profit Organization
- 9.2. Market Analysis, Insights and Forecast - by Types
- 9.2.1. Cloud-based
- 9.2.2. On-premise
- 9.1. Market Analysis, Insights and Forecast - by Application
- 10. Asia Pacific Parks and Recreation Event Management Software Analysis, Insights and Forecast, 2019-2031
- 10.1. Market Analysis, Insights and Forecast - by Application
- 10.1.1. Government
- 10.1.2. Non-profit Organization
- 10.2. Market Analysis, Insights and Forecast - by Types
- 10.2.1. Cloud-based
- 10.2.2. On-premise
- 10.1. Market Analysis, Insights and Forecast - by Application
- 11. Competitive Analysis
- 11.1. Global Market Share Analysis 2024
- 11.2. Company Profiles
- 11.2.1 CivicPlus
- 11.2.1.1. Overview
- 11.2.1.2. Products
- 11.2.1.3. SWOT Analysis
- 11.2.1.4. Recent Developments
- 11.2.1.5. Financials (Based on Availability)
- 11.2.2 CommunityPass
- 11.2.2.1. Overview
- 11.2.2.2. Products
- 11.2.2.3. SWOT Analysis
- 11.2.2.4. Recent Developments
- 11.2.2.5. Financials (Based on Availability)
- 11.2.3 Vermont Systems
- 11.2.3.1. Overview
- 11.2.3.2. Products
- 11.2.3.3. SWOT Analysis
- 11.2.3.4. Recent Developments
- 11.2.3.5. Financials (Based on Availability)
- 11.2.4 Xplor Recreation
- 11.2.4.1. Overview
- 11.2.4.2. Products
- 11.2.4.3. SWOT Analysis
- 11.2.4.4. Recent Developments
- 11.2.4.5. Financials (Based on Availability)
- 11.2.5 EZFacility
- 11.2.5.1. Overview
- 11.2.5.2. Products
- 11.2.5.3. SWOT Analysis
- 11.2.5.4. Recent Developments
- 11.2.5.5. Financials (Based on Availability)
- 11.2.6 Tyler
- 11.2.6.1. Overview
- 11.2.6.2. Products
- 11.2.6.3. SWOT Analysis
- 11.2.6.4. Recent Developments
- 11.2.6.5. Financials (Based on Availability)
- 11.2.7 FinnlySport
- 11.2.7.1. Overview
- 11.2.7.2. Products
- 11.2.7.3. SWOT Analysis
- 11.2.7.4. Recent Developments
- 11.2.7.5. Financials (Based on Availability)
- 11.2.8 RecDesk
- 11.2.8.1. Overview
- 11.2.8.2. Products
- 11.2.8.3. SWOT Analysis
- 11.2.8.4. Recent Developments
- 11.2.8.5. Financials (Based on Availability)
- 11.2.9 eTrak
- 11.2.9.1. Overview
- 11.2.9.2. Products
- 11.2.9.3. SWOT Analysis
- 11.2.9.4. Recent Developments
- 11.2.9.5. Financials (Based on Availability)
- 11.2.10 Jarvis
- 11.2.10.1. Overview
- 11.2.10.2. Products
- 11.2.10.3. SWOT Analysis
- 11.2.10.4. Recent Developments
- 11.2.10.5. Financials (Based on Availability)
- 11.2.11 MyRec
- 11.2.11.1. Overview
- 11.2.11.2. Products
- 11.2.11.3. SWOT Analysis
- 11.2.11.4. Recent Developments
- 11.2.11.5. Financials (Based on Availability)
- 11.2.12 Timely
- 11.2.12.1. Overview
- 11.2.12.2. Products
- 11.2.12.3. SWOT Analysis
- 11.2.12.4. Recent Developments
- 11.2.12.5. Financials (Based on Availability)
- 11.2.13 Cityworks
- 11.2.13.1. Overview
- 11.2.13.2. Products
- 11.2.13.3. SWOT Analysis
- 11.2.13.4. Recent Developments
- 11.2.13.5. Financials (Based on Availability)
- 11.2.14 Omnify
- 11.2.14.1. Overview
- 11.2.14.2. Products
- 11.2.14.3. SWOT Analysis
- 11.2.14.4. Recent Developments
- 11.2.14.5. Financials (Based on Availability)
- 11.2.15 Aspira
- 11.2.15.1. Overview
- 11.2.15.2. Products
- 11.2.15.3. SWOT Analysis
- 11.2.15.4. Recent Developments
- 11.2.15.5. Financials (Based on Availability)
- 11.2.16 Yardi
- 11.2.16.1. Overview
- 11.2.16.2. Products
- 11.2.16.3. SWOT Analysis
- 11.2.16.4. Recent Developments
- 11.2.16.5. Financials (Based on Availability)
- 11.2.17 BlueRec
- 11.2.17.1. Overview
- 11.2.17.2. Products
- 11.2.17.3. SWOT Analysis
- 11.2.17.4. Recent Developments
- 11.2.17.5. Financials (Based on Availability)
- 11.2.18 Legend Software
- 11.2.18.1. Overview
- 11.2.18.2. Products
- 11.2.18.3. SWOT Analysis
- 11.2.18.4. Recent Developments
- 11.2.18.5. Financials (Based on Availability)
- 11.2.19 Esri
- 11.2.19.1. Overview
- 11.2.19.2. Products
- 11.2.19.3. SWOT Analysis
- 11.2.19.4. Recent Developments
- 11.2.19.5. Financials (Based on Availability)
- 11.2.20 Sportsman
- 11.2.20.1. Overview
- 11.2.20.2. Products
- 11.2.20.3. SWOT Analysis
- 11.2.20.4. Recent Developments
- 11.2.20.5. Financials (Based on Availability)
- 11.2.21 AthleteTrax
- 11.2.21.1. Overview
- 11.2.21.2. Products
- 11.2.21.3. SWOT Analysis
- 11.2.21.4. Recent Developments
- 11.2.21.5. Financials (Based on Availability)
- 11.2.1 CivicPlus
List of Figures
- Figure 1: Global Parks and Recreation Event Management Software Revenue Breakdown (million, %) by Region 2024 & 2032
- Figure 2: North America Parks and Recreation Event Management Software Revenue (million), by Application 2024 & 2032
- Figure 3: North America Parks and Recreation Event Management Software Revenue Share (%), by Application 2024 & 2032
- Figure 4: North America Parks and Recreation Event Management Software Revenue (million), by Types 2024 & 2032
- Figure 5: North America Parks and Recreation Event Management Software Revenue Share (%), by Types 2024 & 2032
- Figure 6: North America Parks and Recreation Event Management Software Revenue (million), by Country 2024 & 2032
- Figure 7: North America Parks and Recreation Event Management Software Revenue Share (%), by Country 2024 & 2032
- Figure 8: South America Parks and Recreation Event Management Software Revenue (million), by Application 2024 & 2032
- Figure 9: South America Parks and Recreation Event Management Software Revenue Share (%), by Application 2024 & 2032
- Figure 10: South America Parks and Recreation Event Management Software Revenue (million), by Types 2024 & 2032
- Figure 11: South America Parks and Recreation Event Management Software Revenue Share (%), by Types 2024 & 2032
- Figure 12: South America Parks and Recreation Event Management Software Revenue (million), by Country 2024 & 2032
- Figure 13: South America Parks and Recreation Event Management Software Revenue Share (%), by Country 2024 & 2032
- Figure 14: Europe Parks and Recreation Event Management Software Revenue (million), by Application 2024 & 2032
- Figure 15: Europe Parks and Recreation Event Management Software Revenue Share (%), by Application 2024 & 2032
- Figure 16: Europe Parks and Recreation Event Management Software Revenue (million), by Types 2024 & 2032
- Figure 17: Europe Parks and Recreation Event Management Software Revenue Share (%), by Types 2024 & 2032
- Figure 18: Europe Parks and Recreation Event Management Software Revenue (million), by Country 2024 & 2032
- Figure 19: Europe Parks and Recreation Event Management Software Revenue Share (%), by Country 2024 & 2032
- Figure 20: Middle East & Africa Parks and Recreation Event Management Software Revenue (million), by Application 2024 & 2032
- Figure 21: Middle East & Africa Parks and Recreation Event Management Software Revenue Share (%), by Application 2024 & 2032
- Figure 22: Middle East & Africa Parks and Recreation Event Management Software Revenue (million), by Types 2024 & 2032
- Figure 23: Middle East & Africa Parks and Recreation Event Management Software Revenue Share (%), by Types 2024 & 2032
- Figure 24: Middle East & Africa Parks and Recreation Event Management Software Revenue (million), by Country 2024 & 2032
- Figure 25: Middle East & Africa Parks and Recreation Event Management Software Revenue Share (%), by Country 2024 & 2032
- Figure 26: Asia Pacific Parks and Recreation Event Management Software Revenue (million), by Application 2024 & 2032
- Figure 27: Asia Pacific Parks and Recreation Event Management Software Revenue Share (%), by Application 2024 & 2032
- Figure 28: Asia Pacific Parks and Recreation Event Management Software Revenue (million), by Types 2024 & 2032
- Figure 29: Asia Pacific Parks and Recreation Event Management Software Revenue Share (%), by Types 2024 & 2032
- Figure 30: Asia Pacific Parks and Recreation Event Management Software Revenue (million), by Country 2024 & 2032
- Figure 31: Asia Pacific Parks and Recreation Event Management Software Revenue Share (%), by Country 2024 & 2032
List of Tables
- Table 1: Global Parks and Recreation Event Management Software Revenue million Forecast, by Region 2019 & 2032
- Table 2: Global Parks and Recreation Event Management Software Revenue million Forecast, by Application 2019 & 2032
- Table 3: Global Parks and Recreation Event Management Software Revenue million Forecast, by Types 2019 & 2032
- Table 4: Global Parks and Recreation Event Management Software Revenue million Forecast, by Region 2019 & 2032
- Table 5: Global Parks and Recreation Event Management Software Revenue million Forecast, by Application 2019 & 2032
- Table 6: Global Parks and Recreation Event Management Software Revenue million Forecast, by Types 2019 & 2032
- Table 7: Global Parks and Recreation Event Management Software Revenue million Forecast, by Country 2019 & 2032
- Table 8: United States Parks and Recreation Event Management Software Revenue (million) Forecast, by Application 2019 & 2032
- Table 9: Canada Parks and Recreation Event Management Software Revenue (million) Forecast, by Application 2019 & 2032
- Table 10: Mexico Parks and Recreation Event Management Software Revenue (million) Forecast, by Application 2019 & 2032
- Table 11: Global Parks and Recreation Event Management Software Revenue million Forecast, by Application 2019 & 2032
- Table 12: Global Parks and Recreation Event Management Software Revenue million Forecast, by Types 2019 & 2032
- Table 13: Global Parks and Recreation Event Management Software Revenue million Forecast, by Country 2019 & 2032
- Table 14: Brazil Parks and Recreation Event Management Software Revenue (million) Forecast, by Application 2019 & 2032
- Table 15: Argentina Parks and Recreation Event Management Software Revenue (million) Forecast, by Application 2019 & 2032
- Table 16: Rest of South America Parks and Recreation Event Management Software Revenue (million) Forecast, by Application 2019 & 2032
- Table 17: Global Parks and Recreation Event Management Software Revenue million Forecast, by Application 2019 & 2032
- Table 18: Global Parks and Recreation Event Management Software Revenue million Forecast, by Types 2019 & 2032
- Table 19: Global Parks and Recreation Event Management Software Revenue million Forecast, by Country 2019 & 2032
- Table 20: United Kingdom Parks and Recreation Event Management Software Revenue (million) Forecast, by Application 2019 & 2032
- Table 21: Germany Parks and Recreation Event Management Software Revenue (million) Forecast, by Application 2019 & 2032
- Table 22: France Parks and Recreation Event Management Software Revenue (million) Forecast, by Application 2019 & 2032
- Table 23: Italy Parks and Recreation Event Management Software Revenue (million) Forecast, by Application 2019 & 2032
- Table 24: Spain Parks and Recreation Event Management Software Revenue (million) Forecast, by Application 2019 & 2032
- Table 25: Russia Parks and Recreation Event Management Software Revenue (million) Forecast, by Application 2019 & 2032
- Table 26: Benelux Parks and Recreation Event Management Software Revenue (million) Forecast, by Application 2019 & 2032
- Table 27: Nordics Parks and Recreation Event Management Software Revenue (million) Forecast, by Application 2019 & 2032
- Table 28: Rest of Europe Parks and Recreation Event Management Software Revenue (million) Forecast, by Application 2019 & 2032
- Table 29: Global Parks and Recreation Event Management Software Revenue million Forecast, by Application 2019 & 2032
- Table 30: Global Parks and Recreation Event Management Software Revenue million Forecast, by Types 2019 & 2032
- Table 31: Global Parks and Recreation Event Management Software Revenue million Forecast, by Country 2019 & 2032
- Table 32: Turkey Parks and Recreation Event Management Software Revenue (million) Forecast, by Application 2019 & 2032
- Table 33: Israel Parks and Recreation Event Management Software Revenue (million) Forecast, by Application 2019 & 2032
- Table 34: GCC Parks and Recreation Event Management Software Revenue (million) Forecast, by Application 2019 & 2032
- Table 35: North Africa Parks and Recreation Event Management Software Revenue (million) Forecast, by Application 2019 & 2032
- Table 36: South Africa Parks and Recreation Event Management Software Revenue (million) Forecast, by Application 2019 & 2032
- Table 37: Rest of Middle East & Africa Parks and Recreation Event Management Software Revenue (million) Forecast, by Application 2019 & 2032
- Table 38: Global Parks and Recreation Event Management Software Revenue million Forecast, by Application 2019 & 2032
- Table 39: Global Parks and Recreation Event Management Software Revenue million Forecast, by Types 2019 & 2032
- Table 40: Global Parks and Recreation Event Management Software Revenue million Forecast, by Country 2019 & 2032
- Table 41: China Parks and Recreation Event Management Software Revenue (million) Forecast, by Application 2019 & 2032
- Table 42: India Parks and Recreation Event Management Software Revenue (million) Forecast, by Application 2019 & 2032
- Table 43: Japan Parks and Recreation Event Management Software Revenue (million) Forecast, by Application 2019 & 2032
- Table 44: South Korea Parks and Recreation Event Management Software Revenue (million) Forecast, by Application 2019 & 2032
- Table 45: ASEAN Parks and Recreation Event Management Software Revenue (million) Forecast, by Application 2019 & 2032
- Table 46: Oceania Parks and Recreation Event Management Software Revenue (million) Forecast, by Application 2019 & 2032
- Table 47: Rest of Asia Pacific Parks and Recreation Event Management Software Revenue (million) Forecast, by Application 2019 & 2032
Frequently Asked Questions
1. What is the projected Compound Annual Growth Rate (CAGR) of the Parks and Recreation Event Management Software?
The projected CAGR is approximately XX%.
2. Which companies are prominent players in the Parks and Recreation Event Management Software?
Key companies in the market include CivicPlus, CommunityPass, Vermont Systems, Xplor Recreation, EZFacility, Tyler, FinnlySport, RecDesk, eTrak, Jarvis, MyRec, Timely, Cityworks, Omnify, Aspira, Yardi, BlueRec, Legend Software, Esri, Sportsman, AthleteTrax.
3. What are the main segments of the Parks and Recreation Event Management Software?
The market segments include Application, Types.
4. Can you provide details about the market size?
The market size is estimated to be USD XXX million as of 2022.
5. What are some drivers contributing to market growth?
N/A
6. What are the notable trends driving market growth?
N/A
7. Are there any restraints impacting market growth?
N/A
8. Can you provide examples of recent developments in the market?
N/A
9. What pricing options are available for accessing the report?
Pricing options include single-user, multi-user, and enterprise licenses priced at USD 3350.00, USD 5025.00, and USD 6700.00 respectively.
10. Is the market size provided in terms of value or volume?
The market size is provided in terms of value, measured in million.
11. Are there any specific market keywords associated with the report?
Yes, the market keyword associated with the report is "Parks and Recreation Event Management Software," which aids in identifying and referencing the specific market segment covered.
12. How do I determine which pricing option suits my needs best?
The pricing options vary based on user requirements and access needs. Individual users may opt for single-user licenses, while businesses requiring broader access may choose multi-user or enterprise licenses for cost-effective access to the report.
13. Are there any additional resources or data provided in the Parks and Recreation Event Management Software report?
While the report offers comprehensive insights, it's advisable to review the specific contents or supplementary materials provided to ascertain if additional resources or data are available.
14. How can I stay updated on further developments or reports in the Parks and Recreation Event Management Software?
To stay informed about further developments, trends, and reports in the Parks and Recreation Event Management Software, consider subscribing to industry newsletters, following relevant companies and organizations, or regularly checking reputable industry news sources and publications.
Methodology
Step 1 - Identification of Relevant Samples Size from Population Database


Step 2 - Approaches for Defining Global Market Size (Value, Volume* & Price*)

Note*: In applicable scenarios
Step 3 - Data Sources
Primary Research
- Web Analytics
- Survey Reports
- Research Institute
- Latest Research Reports
- Opinion Leaders
Secondary Research
- Annual Reports
- White Paper
- Latest Press Release
- Industry Association
- Paid Database
- Investor Presentations

Step 4 - Data Triangulation
Involves using different sources of information in order to increase the validity of a study
These sources are likely to be stakeholders in a program - participants, other researchers, program staff, other community members, and so on.
Then we put all data in single framework & apply various statistical tools to find out the dynamic on the market.
During the analysis stage, feedback from the stakeholder groups would be compared to determine areas of agreement as well as areas of divergence
