

Key Insights
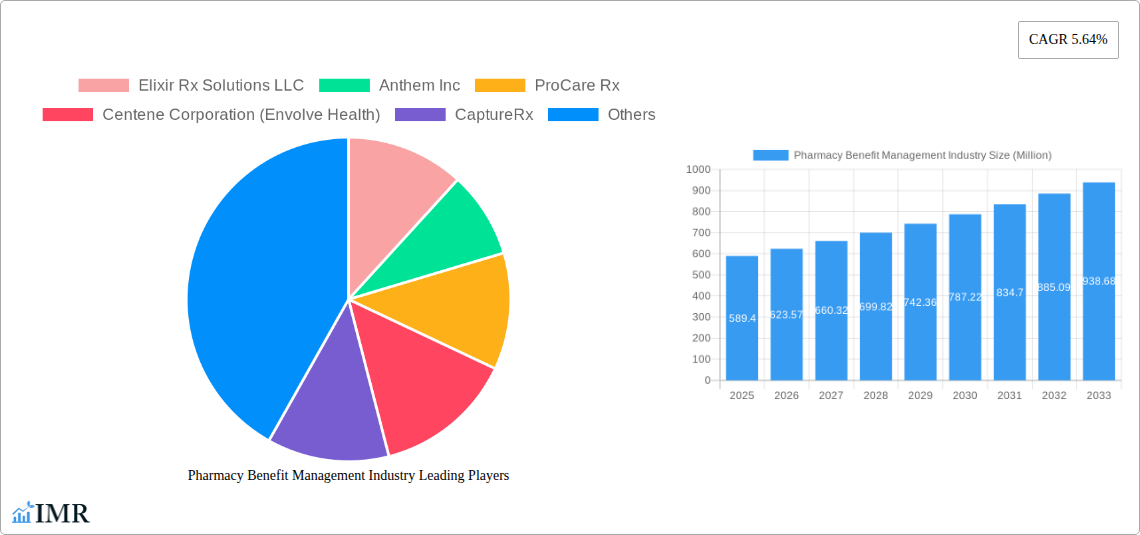
The Pharmacy Benefit Management (PBM) industry, valued at $589.40 million in 2025, is projected to experience robust growth, driven by several key factors. The increasing prevalence of chronic diseases necessitates sophisticated medication management, fueling demand for PBM services. Furthermore, the rising adoption of value-based care models incentivizes cost-effective drug utilization, placing PBMs at the forefront of optimizing healthcare spending. Technological advancements, such as data analytics and AI-powered platforms, enhance efficiency and personalize patient care, further accelerating market expansion. The industry's segmentation, encompassing various service types (specialty pharmacy, drug formulary management, etc.), business models (government, employer-sponsored programs), and end-users (PBMs, mail-order pharmacies), creates diverse avenues for growth. Competition among established players like Express Scripts, CVS Health, and Optum, alongside emerging innovative companies, fosters innovation and enhances service offerings. Geographical expansion, particularly in rapidly developing economies of Asia-Pacific and Latin America, presents lucrative opportunities for market players. However, regulatory scrutiny and pricing pressures remain significant challenges that companies must navigate effectively.
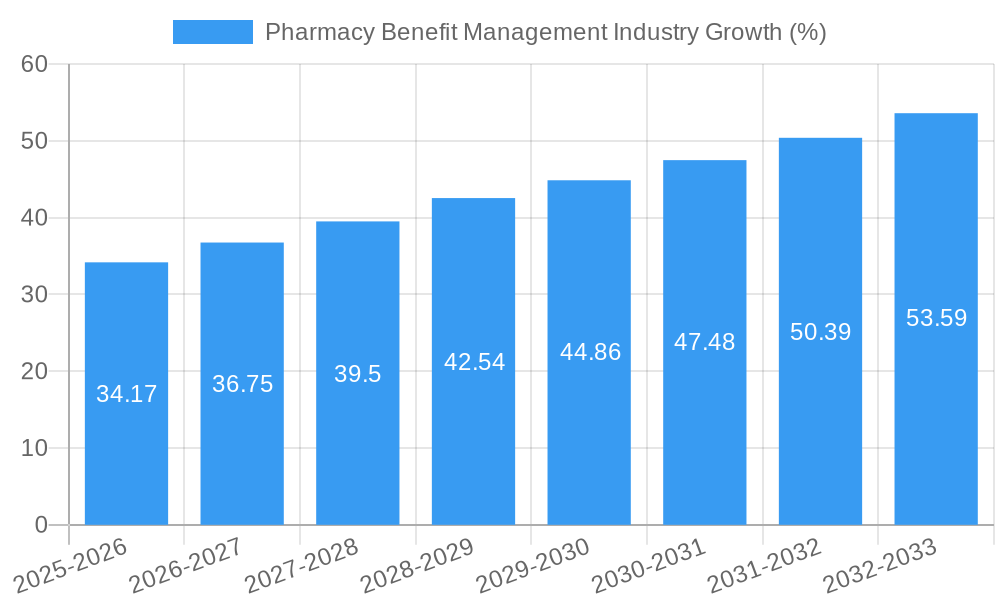
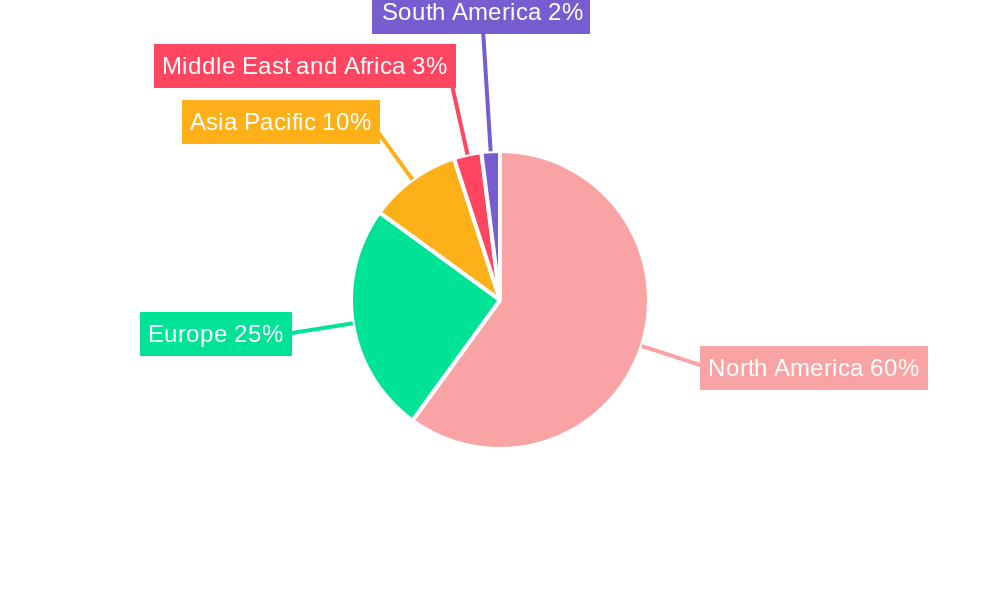
The projected Compound Annual Growth Rate (CAGR) of 5.64% from 2025 to 2033 suggests a steady upward trajectory. This growth is expected to be primarily fueled by increasing healthcare expenditure, technological improvements enhancing efficiency and personalized medicine, and the rising prevalence of chronic conditions necessitating better medication management. The North American market, particularly the United States, is anticipated to maintain its dominance due to high healthcare expenditure and advanced healthcare infrastructure. However, other regions, driven by increasing healthcare awareness and improving healthcare systems, are also expected to witness significant growth. The ongoing consolidation within the industry may lead to a more concentrated market landscape in the coming years. Future growth will hinge on PBM's ability to adapt to evolving regulatory landscapes, demonstrate value to payers and patients, and successfully integrate technological advancements into their service models.
This comprehensive report provides a detailed analysis of the Pharmacy Benefit Management (PBM) industry, encompassing market dynamics, growth trends, key players, and future outlook. We delve into the parent market of healthcare management and the child market of pharmaceutical services to provide a granular understanding of this ever-evolving sector. The report covers the period 2019-2033, with 2025 as the base year and a forecast extending to 2033. This in-depth analysis will equip industry professionals, investors, and strategists with actionable insights to navigate this complex and lucrative landscape. The report's value is estimated at xx Million.
Pharmacy Benefit Management Industry Market Dynamics & Structure
The PBM market is characterized by a moderate level of concentration, with a few large players dominating the landscape. However, the emergence of smaller, specialized PBMs is increasing competition. Technological innovation, particularly in areas like data analytics and artificial intelligence (AI), is a key driver, enabling improved efficiency and personalized medication management. Stringent regulatory frameworks, including those related to drug pricing and patient privacy, significantly influence market operations. While generic drugs act as a substitute, the complexities of specialty pharmaceuticals and adherence programs present unique challenges. The end-user demographics are shifting, with an increasing focus on managing chronic conditions amongst an aging population. M&A activity is relatively frequent, driven by consolidation and expansion strategies.
- Market Concentration: Top 5 players hold approximately xx% market share in 2025.
- Technological Innovation: AI-powered medication adherence programs are gaining traction.
- Regulatory Framework: Compliance with HIPAA and other regulations is crucial.
- Competitive Substitutes: Generic drugs limit growth in certain segments.
- M&A Trends: xx deals were recorded between 2019-2024, with an estimated xx Million in total deal value.
- Innovation Barriers: High R&D costs and regulatory approvals pose challenges.
Pharmacy Benefit Management Industry Growth Trends & Insights
The PBM market has experienced consistent growth over the historical period (2019-2024). This growth is fueled by rising healthcare costs, the increasing prevalence of chronic diseases, and a growing demand for more efficient medication management solutions. The adoption rate of advanced technologies, such as AI-driven platforms for benefit management and drug utilization review, is steadily increasing. The rise of telepharmacy and remote patient monitoring is transforming consumer behavior. Furthermore, changing consumer preferences towards convenient and personalized healthcare services are impacting industry trends.
- Market Size (2025): xx Million
- CAGR (2025-2033): xx%
- Market Penetration (2025): xx% in the US.
- Technological Disruptions: AI and machine learning are transforming operations.
- Consumer Behavior Shifts: Increased preference for digital and personalized services.
Dominant Regions, Countries, or Segments in Pharmacy Benefit Management Industry
The North American market, particularly the United States, holds the largest market share in the PBM industry. This dominance is attributed to factors such as high healthcare spending, extensive insurance coverage, and the presence of major PBM players. Within the industry segments, Specialty Pharmacy is experiencing the fastest growth due to the rising incidence of chronic and complex diseases requiring specialized medications. Employer-Sponsored Programs represent a significant portion of the business model segment, driven by large corporations seeking cost-effective healthcare solutions for their employees. Retail Pharmacies remain a significant end-user segment due to their widespread presence and accessibility.
- Leading Region: North America (US dominates).
- Key Segment (By Service): Specialty Pharmacy - Driving growth due to complex disease management (xx Million).
- Key Segment (By Business Model): Employer-Sponsored Programs - Large market share (xx Million).
- Key Segment (By End-User): Retail Pharmacies - Wide network and accessibility.
- Growth Drivers (US): Strong healthcare infrastructure and high healthcare spending.
Pharmacy Benefit Management Industry Product Landscape
The PBM industry offers a range of products and services, including drug formulary management, benefit plan design, and specialty pharmacy services. Recent product innovations focus on enhancing data analytics capabilities to provide more personalized medication management, improving medication adherence through innovative technology, and integrating AI for better cost control and fraud detection. These advancements offer unique selling propositions, improving efficiency, and enhancing the overall patient experience.
Key Drivers, Barriers & Challenges in Pharmacy Benefit Management Industry
Key Drivers: Rising healthcare costs, increasing prevalence of chronic diseases, technological advancements (AI, data analytics), and the demand for improved patient outcomes are driving market growth. Government initiatives to improve healthcare accessibility also contribute.
Key Challenges: Stringent regulatory hurdles, increasing drug prices, supply chain disruptions (estimated xx% impact on cost in 2024), and intense competition from established and emerging players pose significant challenges. Data security and privacy concerns are also paramount.
Emerging Opportunities in Pharmacy Benefit Management Industry
Emerging opportunities include expanding into untapped markets, particularly in developing economies, offering innovative services like telehealth integration with medication management, and leveraging personalized medicine approaches. Meeting the growing demand for better patient engagement and improving medication adherence through advanced technology presents considerable opportunities.
Growth Accelerators in the Pharmacy Benefit Management Industry
Technological breakthroughs in AI and machine learning for optimized formulary management and predictive analytics, strategic partnerships between PBMs and healthcare providers, and market expansion into new geographies are key catalysts for long-term growth. The development of innovative value-based care models is also expected to fuel growth.
Key Players Shaping the Pharmacy Benefit Management Industry Market
- Elixir Rx Solutions LLC
- Anthem Inc
- ProCare Rx
- Centene Corporation (Envolve Health)
- CaptureRx
- Abarca Health
- Optum Inc
- Benecard Services LLC
- Express Scripts Holding Company
- SS&C Technologies Inc
- Change Healthcare
- Cigna
- CVS Health
Notable Milestones in Pharmacy Benefit Management Industry Sector
- March 2022: ProdigyRx launched its PBM services and clinical solutions for workers' compensation insurers.
- October 2022: Omnicell, Inc. launched Specialty Pharmacy Services to support hospital-owned specialty pharmacies.
In-Depth Pharmacy Benefit Management Industry Market Outlook
The PBM industry is poised for sustained growth driven by technological innovation, evolving healthcare landscapes, and an increasing focus on value-based care. Strategic partnerships, expansion into new segments like telehealth and personalized medicine, and a focus on data-driven decision making will play a crucial role in shaping the future of this dynamic sector. The market's potential is significant, with continued expansion expected across both established and emerging markets.
Pharmacy Benefit Management Industry Segmentation
-
1. Service
- 1.1. Specialty Pharmacy
- 1.2. Drug Formulatory Management
- 1.3. Benefit Plan Design and Consultation
- 1.4. Other Services
-
2. Business Model
- 2.1. Government Health Programs
- 2.2. Employer-Sponsored Programs
- 2.3. Health Insurance Management
-
3. End User
- 3.1. Pharmacy Benefit Management Organization
- 3.2. Mail Order Pharmacies
- 3.3. Retail Pharmacies
- 3.4. Other End Users
Pharmacy Benefit Management Industry Segmentation By Geography
-
1. North America
- 1.1. United States
- 1.2. Canada
- 1.3. Mexico
-
2. Europe
- 2.1. Germany
- 2.2. United Kingdom
- 2.3. France
- 2.4. Italy
- 2.5. Spain
- 2.6. Rest of Europe
-
3. Asia Pacific
- 3.1. China
- 3.2. Japan
- 3.3. India
- 3.4. Australia
- 3.5. South Korea
- 3.6. Rest of Asia Pacific
-
4. Middle East and Africa
- 4.1. GCC
- 4.2. South Africa
- 4.3. Rest of Middle East and Africa
-
5. South America
- 5.1. Brazil
- 5.2. Argentina
- 5.3. Rest of South America
Pharmacy Benefit Management Industry REPORT HIGHLIGHTS
| Aspects | Details |
|---|---|
| Study Period | 2019-2033 |
| Base Year | 2024 |
| Estimated Year | 2025 |
| Forecast Period | 2025-2033 |
| Historical Period | 2019-2024 |
| Growth Rate | CAGR of 5.64% from 2019-2033 |
| Segmentation |
|
Table of Contents
- 1. Introduction
- 1.1. Research Scope
- 1.2. Market Segmentation
- 1.3. Research Methodology
- 1.4. Definitions and Assumptions
- 2. Executive Summary
- 2.1. Introduction
- 3. Market Dynamics
- 3.1. Introduction
- 3.2. Market Drivers
- 3.2.1. Rising Inclination Towards Pharmacy Benefit Management System (PBMS); Increasing Health Expenditure; Growing Demand for Prescription Products
- 3.3. Market Restrains
- 3.3.1. Reluctance To Adopt Pharmacy Automation Systems and Stringent Regulatory Procedures on Confidentiality
- 3.4. Market Trends
- 3.4.1. Specialty Pharmacy Segment is Expected to Witness Significant Growth Over the Forecast Period
- 4. Market Factor Analysis
- 4.1. Porters Five Forces
- 4.2. Supply/Value Chain
- 4.3. PESTEL analysis
- 4.4. Market Entropy
- 4.5. Patent/Trademark Analysis
- 5. Global Pharmacy Benefit Management Industry Analysis, Insights and Forecast, 2019-2031
- 5.1. Market Analysis, Insights and Forecast - by Service
- 5.1.1. Specialty Pharmacy
- 5.1.2. Drug Formulatory Management
- 5.1.3. Benefit Plan Design and Consultation
- 5.1.4. Other Services
- 5.2. Market Analysis, Insights and Forecast - by Business Model
- 5.2.1. Government Health Programs
- 5.2.2. Employer-Sponsored Programs
- 5.2.3. Health Insurance Management
- 5.3. Market Analysis, Insights and Forecast - by End User
- 5.3.1. Pharmacy Benefit Management Organization
- 5.3.2. Mail Order Pharmacies
- 5.3.3. Retail Pharmacies
- 5.3.4. Other End Users
- 5.4. Market Analysis, Insights and Forecast - by Region
- 5.4.1. North America
- 5.4.2. Europe
- 5.4.3. Asia Pacific
- 5.4.4. Middle East and Africa
- 5.4.5. South America
- 5.1. Market Analysis, Insights and Forecast - by Service
- 6. North America Pharmacy Benefit Management Industry Analysis, Insights and Forecast, 2019-2031
- 6.1. Market Analysis, Insights and Forecast - by Service
- 6.1.1. Specialty Pharmacy
- 6.1.2. Drug Formulatory Management
- 6.1.3. Benefit Plan Design and Consultation
- 6.1.4. Other Services
- 6.2. Market Analysis, Insights and Forecast - by Business Model
- 6.2.1. Government Health Programs
- 6.2.2. Employer-Sponsored Programs
- 6.2.3. Health Insurance Management
- 6.3. Market Analysis, Insights and Forecast - by End User
- 6.3.1. Pharmacy Benefit Management Organization
- 6.3.2. Mail Order Pharmacies
- 6.3.3. Retail Pharmacies
- 6.3.4. Other End Users
- 6.1. Market Analysis, Insights and Forecast - by Service
- 7. Europe Pharmacy Benefit Management Industry Analysis, Insights and Forecast, 2019-2031
- 7.1. Market Analysis, Insights and Forecast - by Service
- 7.1.1. Specialty Pharmacy
- 7.1.2. Drug Formulatory Management
- 7.1.3. Benefit Plan Design and Consultation
- 7.1.4. Other Services
- 7.2. Market Analysis, Insights and Forecast - by Business Model
- 7.2.1. Government Health Programs
- 7.2.2. Employer-Sponsored Programs
- 7.2.3. Health Insurance Management
- 7.3. Market Analysis, Insights and Forecast - by End User
- 7.3.1. Pharmacy Benefit Management Organization
- 7.3.2. Mail Order Pharmacies
- 7.3.3. Retail Pharmacies
- 7.3.4. Other End Users
- 7.1. Market Analysis, Insights and Forecast - by Service
- 8. Asia Pacific Pharmacy Benefit Management Industry Analysis, Insights and Forecast, 2019-2031
- 8.1. Market Analysis, Insights and Forecast - by Service
- 8.1.1. Specialty Pharmacy
- 8.1.2. Drug Formulatory Management
- 8.1.3. Benefit Plan Design and Consultation
- 8.1.4. Other Services
- 8.2. Market Analysis, Insights and Forecast - by Business Model
- 8.2.1. Government Health Programs
- 8.2.2. Employer-Sponsored Programs
- 8.2.3. Health Insurance Management
- 8.3. Market Analysis, Insights and Forecast - by End User
- 8.3.1. Pharmacy Benefit Management Organization
- 8.3.2. Mail Order Pharmacies
- 8.3.3. Retail Pharmacies
- 8.3.4. Other End Users
- 8.1. Market Analysis, Insights and Forecast - by Service
- 9. Middle East and Africa Pharmacy Benefit Management Industry Analysis, Insights and Forecast, 2019-2031
- 9.1. Market Analysis, Insights and Forecast - by Service
- 9.1.1. Specialty Pharmacy
- 9.1.2. Drug Formulatory Management
- 9.1.3. Benefit Plan Design and Consultation
- 9.1.4. Other Services
- 9.2. Market Analysis, Insights and Forecast - by Business Model
- 9.2.1. Government Health Programs
- 9.2.2. Employer-Sponsored Programs
- 9.2.3. Health Insurance Management
- 9.3. Market Analysis, Insights and Forecast - by End User
- 9.3.1. Pharmacy Benefit Management Organization
- 9.3.2. Mail Order Pharmacies
- 9.3.3. Retail Pharmacies
- 9.3.4. Other End Users
- 9.1. Market Analysis, Insights and Forecast - by Service
- 10. South America Pharmacy Benefit Management Industry Analysis, Insights and Forecast, 2019-2031
- 10.1. Market Analysis, Insights and Forecast - by Service
- 10.1.1. Specialty Pharmacy
- 10.1.2. Drug Formulatory Management
- 10.1.3. Benefit Plan Design and Consultation
- 10.1.4. Other Services
- 10.2. Market Analysis, Insights and Forecast - by Business Model
- 10.2.1. Government Health Programs
- 10.2.2. Employer-Sponsored Programs
- 10.2.3. Health Insurance Management
- 10.3. Market Analysis, Insights and Forecast - by End User
- 10.3.1. Pharmacy Benefit Management Organization
- 10.3.2. Mail Order Pharmacies
- 10.3.3. Retail Pharmacies
- 10.3.4. Other End Users
- 10.1. Market Analysis, Insights and Forecast - by Service
- 11. North America Pharmacy Benefit Management Industry Analysis, Insights and Forecast, 2019-2031
- 11.1. Market Analysis, Insights and Forecast - By Country/Sub-region
- 11.1.1 United States
- 11.1.2 Canada
- 11.1.3 Mexico
- 12. Europe Pharmacy Benefit Management Industry Analysis, Insights and Forecast, 2019-2031
- 12.1. Market Analysis, Insights and Forecast - By Country/Sub-region
- 12.1.1 Germany
- 12.1.2 United Kingdom
- 12.1.3 France
- 12.1.4 Italy
- 12.1.5 Spain
- 12.1.6 Rest of Europe
- 13. Asia Pacific Pharmacy Benefit Management Industry Analysis, Insights and Forecast, 2019-2031
- 13.1. Market Analysis, Insights and Forecast - By Country/Sub-region
- 13.1.1 China
- 13.1.2 Japan
- 13.1.3 India
- 13.1.4 Australia
- 13.1.5 South Korea
- 13.1.6 Rest of Asia Pacific
- 14. Middle East and Africa Pharmacy Benefit Management Industry Analysis, Insights and Forecast, 2019-2031
- 14.1. Market Analysis, Insights and Forecast - By Country/Sub-region
- 14.1.1 GCC
- 14.1.2 South Africa
- 14.1.3 Rest of Middle East and Africa
- 15. South America Pharmacy Benefit Management Industry Analysis, Insights and Forecast, 2019-2031
- 15.1. Market Analysis, Insights and Forecast - By Country/Sub-region
- 15.1.1 Brazil
- 15.1.2 Argentina
- 15.1.3 Rest of South America
- 16. Competitive Analysis
- 16.1. Global Market Share Analysis 2024
- 16.2. Company Profiles
- 16.2.1 Elixir Rx Solutions LLC
- 16.2.1.1. Overview
- 16.2.1.2. Products
- 16.2.1.3. SWOT Analysis
- 16.2.1.4. Recent Developments
- 16.2.1.5. Financials (Based on Availability)
- 16.2.2 Anthem Inc
- 16.2.2.1. Overview
- 16.2.2.2. Products
- 16.2.2.3. SWOT Analysis
- 16.2.2.4. Recent Developments
- 16.2.2.5. Financials (Based on Availability)
- 16.2.3 ProCare Rx
- 16.2.3.1. Overview
- 16.2.3.2. Products
- 16.2.3.3. SWOT Analysis
- 16.2.3.4. Recent Developments
- 16.2.3.5. Financials (Based on Availability)
- 16.2.4 Centene Corporation (Envolve Health)
- 16.2.4.1. Overview
- 16.2.4.2. Products
- 16.2.4.3. SWOT Analysis
- 16.2.4.4. Recent Developments
- 16.2.4.5. Financials (Based on Availability)
- 16.2.5 CaptureRx
- 16.2.5.1. Overview
- 16.2.5.2. Products
- 16.2.5.3. SWOT Analysis
- 16.2.5.4. Recent Developments
- 16.2.5.5. Financials (Based on Availability)
- 16.2.6 Abarca Health
- 16.2.6.1. Overview
- 16.2.6.2. Products
- 16.2.6.3. SWOT Analysis
- 16.2.6.4. Recent Developments
- 16.2.6.5. Financials (Based on Availability)
- 16.2.7 Optum Inc
- 16.2.7.1. Overview
- 16.2.7.2. Products
- 16.2.7.3. SWOT Analysis
- 16.2.7.4. Recent Developments
- 16.2.7.5. Financials (Based on Availability)
- 16.2.8 Benecard Services LLC
- 16.2.8.1. Overview
- 16.2.8.2. Products
- 16.2.8.3. SWOT Analysis
- 16.2.8.4. Recent Developments
- 16.2.8.5. Financials (Based on Availability)
- 16.2.9 Express Scripts Holding Company
- 16.2.9.1. Overview
- 16.2.9.2. Products
- 16.2.9.3. SWOT Analysis
- 16.2.9.4. Recent Developments
- 16.2.9.5. Financials (Based on Availability)
- 16.2.10 SS&C Technologies Inc
- 16.2.10.1. Overview
- 16.2.10.2. Products
- 16.2.10.3. SWOT Analysis
- 16.2.10.4. Recent Developments
- 16.2.10.5. Financials (Based on Availability)
- 16.2.11 Change Healthcare
- 16.2.11.1. Overview
- 16.2.11.2. Products
- 16.2.11.3. SWOT Analysis
- 16.2.11.4. Recent Developments
- 16.2.11.5. Financials (Based on Availability)
- 16.2.12 Cigna
- 16.2.12.1. Overview
- 16.2.12.2. Products
- 16.2.12.3. SWOT Analysis
- 16.2.12.4. Recent Developments
- 16.2.12.5. Financials (Based on Availability)
- 16.2.13 CVS Health
- 16.2.13.1. Overview
- 16.2.13.2. Products
- 16.2.13.3. SWOT Analysis
- 16.2.13.4. Recent Developments
- 16.2.13.5. Financials (Based on Availability)
- 16.2.1 Elixir Rx Solutions LLC
List of Figures
- Figure 1: Global Pharmacy Benefit Management Industry Revenue Breakdown (Million, %) by Region 2024 & 2032
- Figure 2: North America Pharmacy Benefit Management Industry Revenue (Million), by Country 2024 & 2032
- Figure 3: North America Pharmacy Benefit Management Industry Revenue Share (%), by Country 2024 & 2032
- Figure 4: Europe Pharmacy Benefit Management Industry Revenue (Million), by Country 2024 & 2032
- Figure 5: Europe Pharmacy Benefit Management Industry Revenue Share (%), by Country 2024 & 2032
- Figure 6: Asia Pacific Pharmacy Benefit Management Industry Revenue (Million), by Country 2024 & 2032
- Figure 7: Asia Pacific Pharmacy Benefit Management Industry Revenue Share (%), by Country 2024 & 2032
- Figure 8: Middle East and Africa Pharmacy Benefit Management Industry Revenue (Million), by Country 2024 & 2032
- Figure 9: Middle East and Africa Pharmacy Benefit Management Industry Revenue Share (%), by Country 2024 & 2032
- Figure 10: South America Pharmacy Benefit Management Industry Revenue (Million), by Country 2024 & 2032
- Figure 11: South America Pharmacy Benefit Management Industry Revenue Share (%), by Country 2024 & 2032
- Figure 12: North America Pharmacy Benefit Management Industry Revenue (Million), by Service 2024 & 2032
- Figure 13: North America Pharmacy Benefit Management Industry Revenue Share (%), by Service 2024 & 2032
- Figure 14: North America Pharmacy Benefit Management Industry Revenue (Million), by Business Model 2024 & 2032
- Figure 15: North America Pharmacy Benefit Management Industry Revenue Share (%), by Business Model 2024 & 2032
- Figure 16: North America Pharmacy Benefit Management Industry Revenue (Million), by End User 2024 & 2032
- Figure 17: North America Pharmacy Benefit Management Industry Revenue Share (%), by End User 2024 & 2032
- Figure 18: North America Pharmacy Benefit Management Industry Revenue (Million), by Country 2024 & 2032
- Figure 19: North America Pharmacy Benefit Management Industry Revenue Share (%), by Country 2024 & 2032
- Figure 20: Europe Pharmacy Benefit Management Industry Revenue (Million), by Service 2024 & 2032
- Figure 21: Europe Pharmacy Benefit Management Industry Revenue Share (%), by Service 2024 & 2032
- Figure 22: Europe Pharmacy Benefit Management Industry Revenue (Million), by Business Model 2024 & 2032
- Figure 23: Europe Pharmacy Benefit Management Industry Revenue Share (%), by Business Model 2024 & 2032
- Figure 24: Europe Pharmacy Benefit Management Industry Revenue (Million), by End User 2024 & 2032
- Figure 25: Europe Pharmacy Benefit Management Industry Revenue Share (%), by End User 2024 & 2032
- Figure 26: Europe Pharmacy Benefit Management Industry Revenue (Million), by Country 2024 & 2032
- Figure 27: Europe Pharmacy Benefit Management Industry Revenue Share (%), by Country 2024 & 2032
- Figure 28: Asia Pacific Pharmacy Benefit Management Industry Revenue (Million), by Service 2024 & 2032
- Figure 29: Asia Pacific Pharmacy Benefit Management Industry Revenue Share (%), by Service 2024 & 2032
- Figure 30: Asia Pacific Pharmacy Benefit Management Industry Revenue (Million), by Business Model 2024 & 2032
- Figure 31: Asia Pacific Pharmacy Benefit Management Industry Revenue Share (%), by Business Model 2024 & 2032
- Figure 32: Asia Pacific Pharmacy Benefit Management Industry Revenue (Million), by End User 2024 & 2032
- Figure 33: Asia Pacific Pharmacy Benefit Management Industry Revenue Share (%), by End User 2024 & 2032
- Figure 34: Asia Pacific Pharmacy Benefit Management Industry Revenue (Million), by Country 2024 & 2032
- Figure 35: Asia Pacific Pharmacy Benefit Management Industry Revenue Share (%), by Country 2024 & 2032
- Figure 36: Middle East and Africa Pharmacy Benefit Management Industry Revenue (Million), by Service 2024 & 2032
- Figure 37: Middle East and Africa Pharmacy Benefit Management Industry Revenue Share (%), by Service 2024 & 2032
- Figure 38: Middle East and Africa Pharmacy Benefit Management Industry Revenue (Million), by Business Model 2024 & 2032
- Figure 39: Middle East and Africa Pharmacy Benefit Management Industry Revenue Share (%), by Business Model 2024 & 2032
- Figure 40: Middle East and Africa Pharmacy Benefit Management Industry Revenue (Million), by End User 2024 & 2032
- Figure 41: Middle East and Africa Pharmacy Benefit Management Industry Revenue Share (%), by End User 2024 & 2032
- Figure 42: Middle East and Africa Pharmacy Benefit Management Industry Revenue (Million), by Country 2024 & 2032
- Figure 43: Middle East and Africa Pharmacy Benefit Management Industry Revenue Share (%), by Country 2024 & 2032
- Figure 44: South America Pharmacy Benefit Management Industry Revenue (Million), by Service 2024 & 2032
- Figure 45: South America Pharmacy Benefit Management Industry Revenue Share (%), by Service 2024 & 2032
- Figure 46: South America Pharmacy Benefit Management Industry Revenue (Million), by Business Model 2024 & 2032
- Figure 47: South America Pharmacy Benefit Management Industry Revenue Share (%), by Business Model 2024 & 2032
- Figure 48: South America Pharmacy Benefit Management Industry Revenue (Million), by End User 2024 & 2032
- Figure 49: South America Pharmacy Benefit Management Industry Revenue Share (%), by End User 2024 & 2032
- Figure 50: South America Pharmacy Benefit Management Industry Revenue (Million), by Country 2024 & 2032
- Figure 51: South America Pharmacy Benefit Management Industry Revenue Share (%), by Country 2024 & 2032
List of Tables
- Table 1: Global Pharmacy Benefit Management Industry Revenue Million Forecast, by Region 2019 & 2032
- Table 2: Global Pharmacy Benefit Management Industry Revenue Million Forecast, by Service 2019 & 2032
- Table 3: Global Pharmacy Benefit Management Industry Revenue Million Forecast, by Business Model 2019 & 2032
- Table 4: Global Pharmacy Benefit Management Industry Revenue Million Forecast, by End User 2019 & 2032
- Table 5: Global Pharmacy Benefit Management Industry Revenue Million Forecast, by Region 2019 & 2032
- Table 6: Global Pharmacy Benefit Management Industry Revenue Million Forecast, by Country 2019 & 2032
- Table 7: United States Pharmacy Benefit Management Industry Revenue (Million) Forecast, by Application 2019 & 2032
- Table 8: Canada Pharmacy Benefit Management Industry Revenue (Million) Forecast, by Application 2019 & 2032
- Table 9: Mexico Pharmacy Benefit Management Industry Revenue (Million) Forecast, by Application 2019 & 2032
- Table 10: Global Pharmacy Benefit Management Industry Revenue Million Forecast, by Country 2019 & 2032
- Table 11: Germany Pharmacy Benefit Management Industry Revenue (Million) Forecast, by Application 2019 & 2032
- Table 12: United Kingdom Pharmacy Benefit Management Industry Revenue (Million) Forecast, by Application 2019 & 2032
- Table 13: France Pharmacy Benefit Management Industry Revenue (Million) Forecast, by Application 2019 & 2032
- Table 14: Italy Pharmacy Benefit Management Industry Revenue (Million) Forecast, by Application 2019 & 2032
- Table 15: Spain Pharmacy Benefit Management Industry Revenue (Million) Forecast, by Application 2019 & 2032
- Table 16: Rest of Europe Pharmacy Benefit Management Industry Revenue (Million) Forecast, by Application 2019 & 2032
- Table 17: Global Pharmacy Benefit Management Industry Revenue Million Forecast, by Country 2019 & 2032
- Table 18: China Pharmacy Benefit Management Industry Revenue (Million) Forecast, by Application 2019 & 2032
- Table 19: Japan Pharmacy Benefit Management Industry Revenue (Million) Forecast, by Application 2019 & 2032
- Table 20: India Pharmacy Benefit Management Industry Revenue (Million) Forecast, by Application 2019 & 2032
- Table 21: Australia Pharmacy Benefit Management Industry Revenue (Million) Forecast, by Application 2019 & 2032
- Table 22: South Korea Pharmacy Benefit Management Industry Revenue (Million) Forecast, by Application 2019 & 2032
- Table 23: Rest of Asia Pacific Pharmacy Benefit Management Industry Revenue (Million) Forecast, by Application 2019 & 2032
- Table 24: Global Pharmacy Benefit Management Industry Revenue Million Forecast, by Country 2019 & 2032
- Table 25: GCC Pharmacy Benefit Management Industry Revenue (Million) Forecast, by Application 2019 & 2032
- Table 26: South Africa Pharmacy Benefit Management Industry Revenue (Million) Forecast, by Application 2019 & 2032
- Table 27: Rest of Middle East and Africa Pharmacy Benefit Management Industry Revenue (Million) Forecast, by Application 2019 & 2032
- Table 28: Global Pharmacy Benefit Management Industry Revenue Million Forecast, by Country 2019 & 2032
- Table 29: Brazil Pharmacy Benefit Management Industry Revenue (Million) Forecast, by Application 2019 & 2032
- Table 30: Argentina Pharmacy Benefit Management Industry Revenue (Million) Forecast, by Application 2019 & 2032
- Table 31: Rest of South America Pharmacy Benefit Management Industry Revenue (Million) Forecast, by Application 2019 & 2032
- Table 32: Global Pharmacy Benefit Management Industry Revenue Million Forecast, by Service 2019 & 2032
- Table 33: Global Pharmacy Benefit Management Industry Revenue Million Forecast, by Business Model 2019 & 2032
- Table 34: Global Pharmacy Benefit Management Industry Revenue Million Forecast, by End User 2019 & 2032
- Table 35: Global Pharmacy Benefit Management Industry Revenue Million Forecast, by Country 2019 & 2032
- Table 36: United States Pharmacy Benefit Management Industry Revenue (Million) Forecast, by Application 2019 & 2032
- Table 37: Canada Pharmacy Benefit Management Industry Revenue (Million) Forecast, by Application 2019 & 2032
- Table 38: Mexico Pharmacy Benefit Management Industry Revenue (Million) Forecast, by Application 2019 & 2032
- Table 39: Global Pharmacy Benefit Management Industry Revenue Million Forecast, by Service 2019 & 2032
- Table 40: Global Pharmacy Benefit Management Industry Revenue Million Forecast, by Business Model 2019 & 2032
- Table 41: Global Pharmacy Benefit Management Industry Revenue Million Forecast, by End User 2019 & 2032
- Table 42: Global Pharmacy Benefit Management Industry Revenue Million Forecast, by Country 2019 & 2032
- Table 43: Germany Pharmacy Benefit Management Industry Revenue (Million) Forecast, by Application 2019 & 2032
- Table 44: United Kingdom Pharmacy Benefit Management Industry Revenue (Million) Forecast, by Application 2019 & 2032
- Table 45: France Pharmacy Benefit Management Industry Revenue (Million) Forecast, by Application 2019 & 2032
- Table 46: Italy Pharmacy Benefit Management Industry Revenue (Million) Forecast, by Application 2019 & 2032
- Table 47: Spain Pharmacy Benefit Management Industry Revenue (Million) Forecast, by Application 2019 & 2032
- Table 48: Rest of Europe Pharmacy Benefit Management Industry Revenue (Million) Forecast, by Application 2019 & 2032
- Table 49: Global Pharmacy Benefit Management Industry Revenue Million Forecast, by Service 2019 & 2032
- Table 50: Global Pharmacy Benefit Management Industry Revenue Million Forecast, by Business Model 2019 & 2032
- Table 51: Global Pharmacy Benefit Management Industry Revenue Million Forecast, by End User 2019 & 2032
- Table 52: Global Pharmacy Benefit Management Industry Revenue Million Forecast, by Country 2019 & 2032
- Table 53: China Pharmacy Benefit Management Industry Revenue (Million) Forecast, by Application 2019 & 2032
- Table 54: Japan Pharmacy Benefit Management Industry Revenue (Million) Forecast, by Application 2019 & 2032
- Table 55: India Pharmacy Benefit Management Industry Revenue (Million) Forecast, by Application 2019 & 2032
- Table 56: Australia Pharmacy Benefit Management Industry Revenue (Million) Forecast, by Application 2019 & 2032
- Table 57: South Korea Pharmacy Benefit Management Industry Revenue (Million) Forecast, by Application 2019 & 2032
- Table 58: Rest of Asia Pacific Pharmacy Benefit Management Industry Revenue (Million) Forecast, by Application 2019 & 2032
- Table 59: Global Pharmacy Benefit Management Industry Revenue Million Forecast, by Service 2019 & 2032
- Table 60: Global Pharmacy Benefit Management Industry Revenue Million Forecast, by Business Model 2019 & 2032
- Table 61: Global Pharmacy Benefit Management Industry Revenue Million Forecast, by End User 2019 & 2032
- Table 62: Global Pharmacy Benefit Management Industry Revenue Million Forecast, by Country 2019 & 2032
- Table 63: GCC Pharmacy Benefit Management Industry Revenue (Million) Forecast, by Application 2019 & 2032
- Table 64: South Africa Pharmacy Benefit Management Industry Revenue (Million) Forecast, by Application 2019 & 2032
- Table 65: Rest of Middle East and Africa Pharmacy Benefit Management Industry Revenue (Million) Forecast, by Application 2019 & 2032
- Table 66: Global Pharmacy Benefit Management Industry Revenue Million Forecast, by Service 2019 & 2032
- Table 67: Global Pharmacy Benefit Management Industry Revenue Million Forecast, by Business Model 2019 & 2032
- Table 68: Global Pharmacy Benefit Management Industry Revenue Million Forecast, by End User 2019 & 2032
- Table 69: Global Pharmacy Benefit Management Industry Revenue Million Forecast, by Country 2019 & 2032
- Table 70: Brazil Pharmacy Benefit Management Industry Revenue (Million) Forecast, by Application 2019 & 2032
- Table 71: Argentina Pharmacy Benefit Management Industry Revenue (Million) Forecast, by Application 2019 & 2032
- Table 72: Rest of South America Pharmacy Benefit Management Industry Revenue (Million) Forecast, by Application 2019 & 2032
Frequently Asked Questions
1. What is the projected Compound Annual Growth Rate (CAGR) of the Pharmacy Benefit Management Industry?
The projected CAGR is approximately 5.64%.
2. Which companies are prominent players in the Pharmacy Benefit Management Industry?
Key companies in the market include Elixir Rx Solutions LLC, Anthem Inc, ProCare Rx, Centene Corporation (Envolve Health), CaptureRx, Abarca Health, Optum Inc, Benecard Services LLC, Express Scripts Holding Company, SS&C Technologies Inc, Change Healthcare, Cigna, CVS Health.
3. What are the main segments of the Pharmacy Benefit Management Industry?
The market segments include Service, Business Model, End User.
4. Can you provide details about the market size?
The market size is estimated to be USD 589.40 Million as of 2022.
5. What are some drivers contributing to market growth?
Rising Inclination Towards Pharmacy Benefit Management System (PBMS); Increasing Health Expenditure; Growing Demand for Prescription Products.
6. What are the notable trends driving market growth?
Specialty Pharmacy Segment is Expected to Witness Significant Growth Over the Forecast Period.
7. Are there any restraints impacting market growth?
Reluctance To Adopt Pharmacy Automation Systems and Stringent Regulatory Procedures on Confidentiality.
8. Can you provide examples of recent developments in the market?
October 2022: Omnicell, Inc., a provider of medication management and adherence tools for health systems and pharmacies, launched Specialty Pharmacy Services, a comprehensive offering designed to help health systems launch and/or optimize a fully managed, hospital-owned specialty pharmacy.
9. What pricing options are available for accessing the report?
Pricing options include single-user, multi-user, and enterprise licenses priced at USD 4750, USD 5250, and USD 8750 respectively.
10. Is the market size provided in terms of value or volume?
The market size is provided in terms of value, measured in Million.
11. Are there any specific market keywords associated with the report?
Yes, the market keyword associated with the report is "Pharmacy Benefit Management Industry," which aids in identifying and referencing the specific market segment covered.
12. How do I determine which pricing option suits my needs best?
The pricing options vary based on user requirements and access needs. Individual users may opt for single-user licenses, while businesses requiring broader access may choose multi-user or enterprise licenses for cost-effective access to the report.
13. Are there any additional resources or data provided in the Pharmacy Benefit Management Industry report?
While the report offers comprehensive insights, it's advisable to review the specific contents or supplementary materials provided to ascertain if additional resources or data are available.
14. How can I stay updated on further developments or reports in the Pharmacy Benefit Management Industry?
To stay informed about further developments, trends, and reports in the Pharmacy Benefit Management Industry, consider subscribing to industry newsletters, following relevant companies and organizations, or regularly checking reputable industry news sources and publications.
Methodology
Step 1 - Identification of Relevant Samples Size from Population Database


Step 2 - Approaches for Defining Global Market Size (Value, Volume* & Price*)

Note*: In applicable scenarios
Step 3 - Data Sources
Primary Research
- Web Analytics
- Survey Reports
- Research Institute
- Latest Research Reports
- Opinion Leaders
Secondary Research
- Annual Reports
- White Paper
- Latest Press Release
- Industry Association
- Paid Database
- Investor Presentations

Step 4 - Data Triangulation
Involves using different sources of information in order to increase the validity of a study
These sources are likely to be stakeholders in a program - participants, other researchers, program staff, other community members, and so on.
Then we put all data in single framework & apply various statistical tools to find out the dynamic on the market.
During the analysis stage, feedback from the stakeholder groups would be compared to determine areas of agreement as well as areas of divergence
