

Key Insights
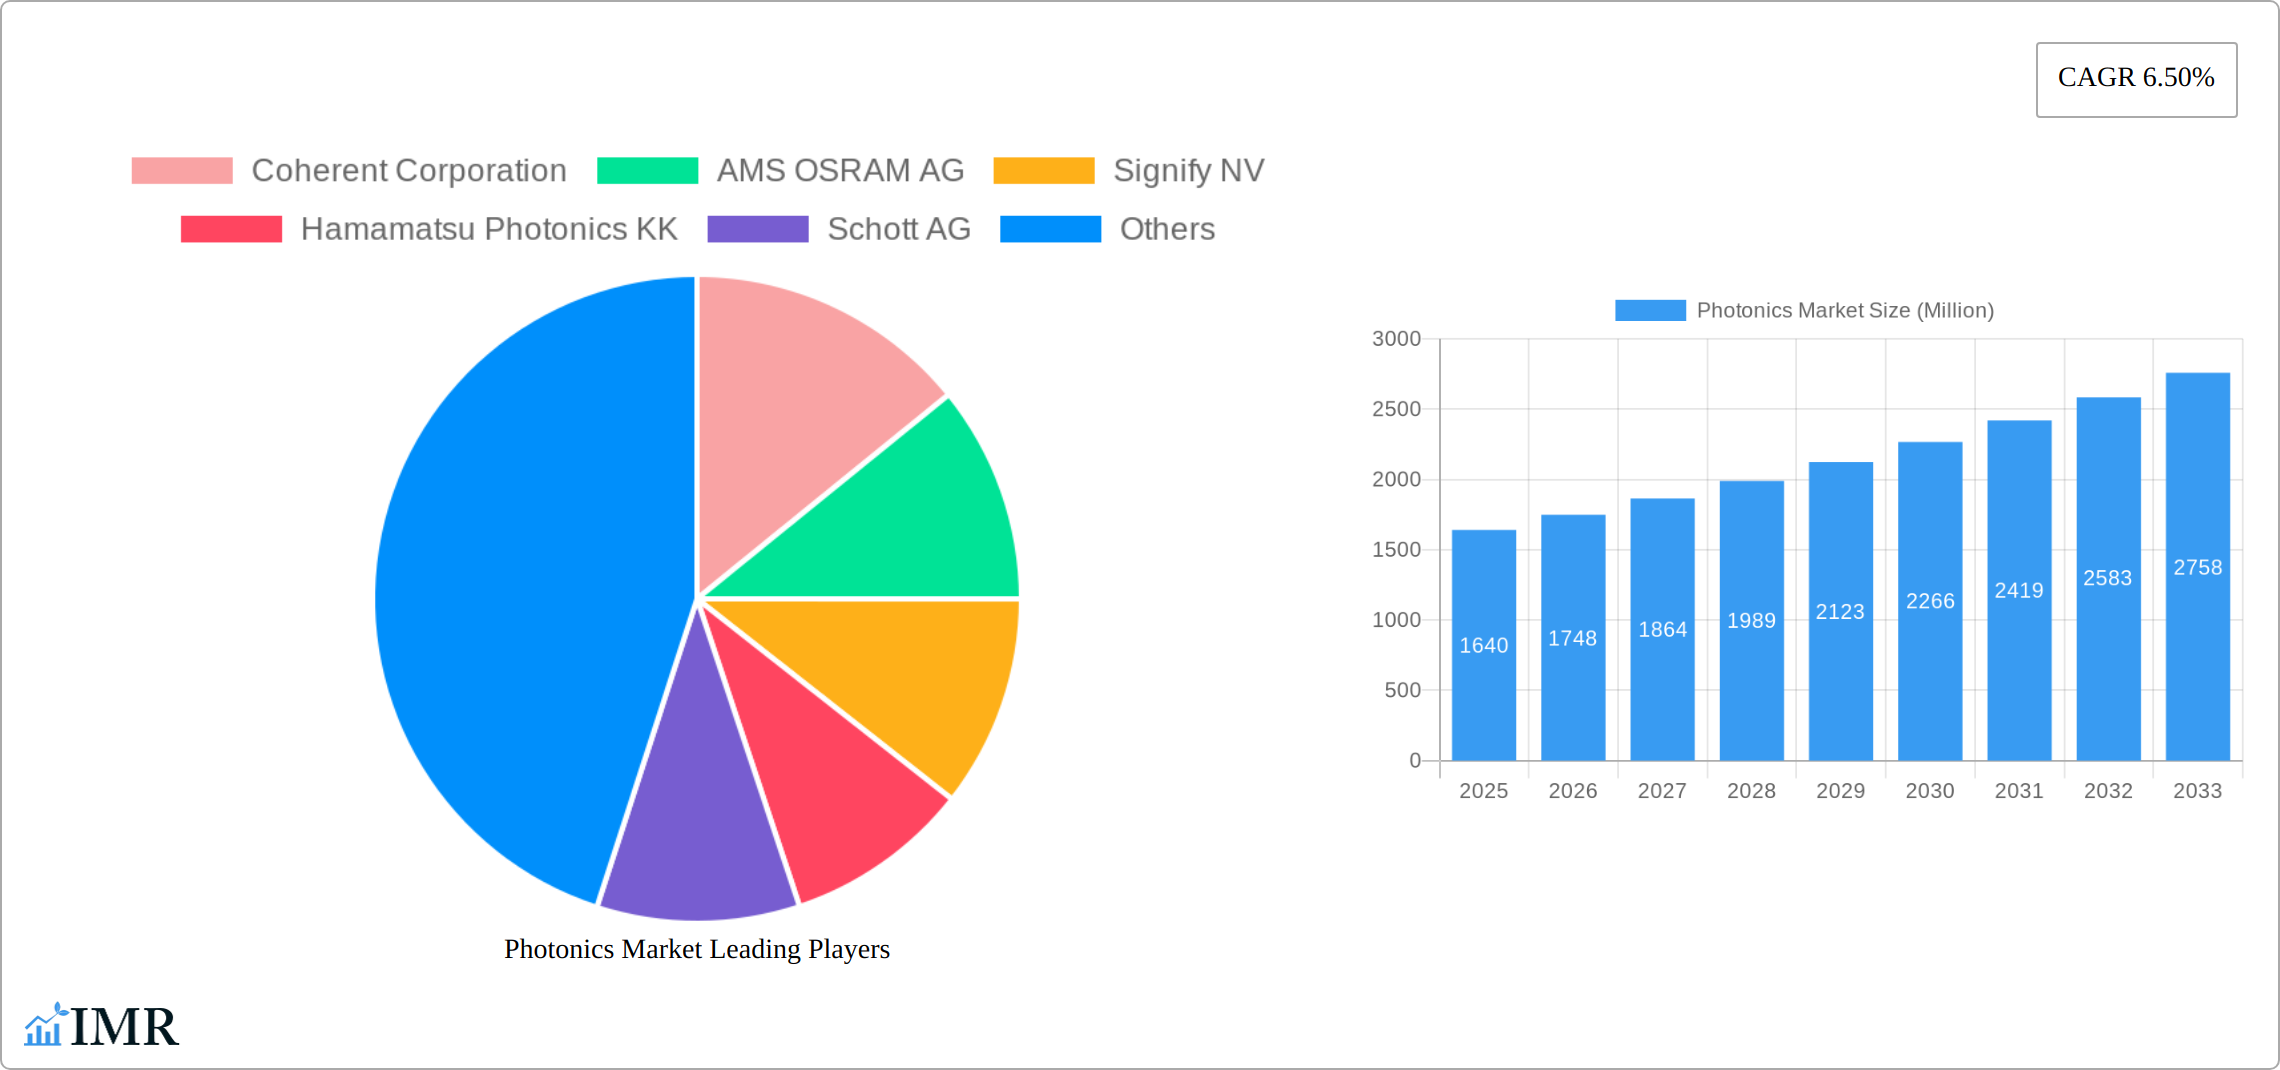
The global photonics market, valued at $1.64 billion in 2025, is projected to experience robust growth, driven by a compound annual growth rate (CAGR) of 6.50% from 2025 to 2033. This expansion is fueled by several key factors. The increasing adoption of photonics technologies across diverse sectors, including consumer electronics, aerospace and defense, and medical instrumentation, is a significant driver. Advancements in laser technology, particularly in areas like fiber lasers and semiconductor lasers, are enhancing performance and reducing costs, making photonics more accessible and attractive to various industries. Furthermore, the growing demand for high-speed data transmission, particularly in telecommunications and data centers, is bolstering the market. The development of novel photonic devices and systems, such as advanced sensors and imaging systems, is opening up new applications and further fueling market growth. While challenges such as high initial investment costs for certain photonic technologies and the need for specialized expertise exist, the overall market trajectory is positive, reflecting a sustained commitment to research and development in this crucial technological area.
Significant regional variations are expected. North America, currently holding a substantial market share, is likely to continue its strong performance due to the presence of major technology players and substantial government investment in research and development. However, the Asia-Pacific region, particularly China and India, is poised for significant growth driven by expanding industrialization and increasing adoption of photonics in various applications. Europe is also expected to contribute substantially, driven by ongoing advancements in research and the strong presence of established photonics companies. The competitive landscape is marked by the presence of both established multinational corporations and innovative startups, leading to continuous product innovation and market diversification. The market will likely witness strategic partnerships, mergers, and acquisitions as companies seek to consolidate their position and expand their reach in this dynamic and rapidly evolving field.
Photonics Market: A Comprehensive Report (2019-2033)
This comprehensive report provides a detailed analysis of the global Photonics market, encompassing market dynamics, growth trends, regional dominance, product landscapes, key players, and future outlooks. The report covers the period from 2019 to 2033, with 2025 serving as the base and estimated year. This in-depth study is essential for industry professionals, investors, and anyone seeking to understand the intricacies and potential of this rapidly evolving sector. The report segments the market by end-user industries, offering granular insights into each sector's contribution to overall market growth.
Photonics Market Dynamics & Structure
The global photonics market exhibits a moderately consolidated structure, with several key players holding significant market share. Technological innovation is a primary growth driver, fueled by advancements in laser technology, optical sensors, and integrated photonics. Stringent regulatory frameworks concerning safety and environmental impact influence market dynamics, while the emergence of competitive product substitutes necessitates continuous innovation. The end-user demographics are diverse, spanning various industries, resulting in a complex market landscape. Mergers and acquisitions (M&A) activity, although not exceptionally high, plays a role in shaping market competition and expanding product portfolios. The overall market concentration is estimated at xx%, with the top 5 players controlling approximately xx% of the market share in 2025.
- Market Concentration: Moderate, with top 5 players controlling approximately xx% of the market share in 2025.
- Technological Innovation: Significant driver, encompassing advancements in laser technology, optical sensors, and integrated photonics.
- Regulatory Frameworks: Influence market dynamics through safety and environmental regulations.
- Competitive Substitutes: Presence of alternatives necessitates ongoing innovation and product differentiation.
- End-User Demographics: Highly diverse across numerous industries, including consumer electronics, automotive, and healthcare.
- M&A Activity: Contributes to market consolidation and expansion of product offerings; approximately xx M&A deals were recorded between 2019-2024.
Photonics Market Growth Trends & Insights
The photonics market experienced significant growth during the historical period (2019-2024), with a Compound Annual Growth Rate (CAGR) of xx%. This growth is projected to continue throughout the forecast period (2025-2033), albeit at a slightly moderated pace, with a projected CAGR of xx%. The market size, valued at xx Million in 2025, is expected to reach xx Million by 2033. Technological disruptions, particularly in areas like 5G infrastructure, advanced driver-assistance systems (ADAS), and medical imaging, are key catalysts for market expansion. Consumer behavior shifts towards increased adoption of smart devices and connected technologies further contribute to market growth. Increasing market penetration in developing economies is also a key factor. The adoption rate of photonics technologies in various applications is steadily increasing, particularly in the automotive and healthcare sectors, reflecting the growing demand for advanced functionalities and improved performance.

Dominant Regions, Countries, or Segments in Photonics Market
North America currently holds the dominant position in the photonics market, driven by significant investments in research and development, robust technological infrastructure, and the presence of major industry players. The region's strong economic performance and supportive government policies also contribute to its market leadership. Asia-Pacific, however, is poised for significant growth, owing to rapid industrialization, rising consumer spending, and government initiatives promoting technological advancements. Within the end-user segments, the medical and bioinstrumentation sector demonstrates substantial growth potential, driven by the increasing demand for advanced diagnostic and therapeutic tools. The automotive sector is another key contributor, fueled by the adoption of advanced driver-assistance systems (ADAS) and autonomous driving technologies.
- Key Drivers in North America: Strong R&D investment, robust technological infrastructure, favorable government policies, and high consumer spending.
- Key Drivers in Asia-Pacific: Rapid industrialization, rising consumer spending, and supportive government initiatives.
- High-Growth End-User Segment: Medical and bioinstrumentation, driven by the demand for advanced diagnostic and therapeutic tools.
- Significant Growth Potential: Automotive sector, fueled by the adoption of ADAS and autonomous driving technologies. North America currently holds approximately xx% market share, followed by Asia Pacific at xx%.
Photonics Market Product Landscape
The photonics market showcases a diverse range of products, including lasers, optical fibers, sensors, and imaging systems. Recent innovations focus on miniaturization, increased efficiency, and enhanced performance. Advanced laser technologies, such as ultrafast lasers and fiber lasers, are gaining traction across various applications. The unique selling propositions of these products encompass superior precision, speed, and reliability, catering to the demands of diverse industries. The integration of photonics technologies with other technologies like AI and machine learning is driving further innovation and expanding application areas.
Key Drivers, Barriers & Challenges in Photonics Market
Key Drivers:
- Technological advancements in laser technology, optical fibers, and sensor technology.
- Growing demand for advanced functionalities in diverse industries (automotive, healthcare, consumer electronics).
- Increasing government investments in research and development.
Challenges and Restraints:
- High initial investment costs for photonics technologies can pose a barrier to adoption for some businesses.
- Complex supply chain dynamics can lead to production delays and increased costs. This was particularly noticeable in 2022, causing a xx% increase in raw material costs.
- Stringent regulatory requirements can slow down product development and market entry.
Emerging Opportunities in Photonics Market
- Expanding applications in 5G and 6G communication infrastructure.
- Growing demand for advanced imaging technologies in medical diagnostics and industrial inspection.
- Increasing use of photonics in environmental monitoring and sensing applications.
- Development of novel photonics-based materials with enhanced functionalities.
Growth Accelerators in the Photonics Market Industry
Technological breakthroughs in integrated photonics, particularly in silicon photonics, are driving market expansion by reducing costs and enhancing performance. Strategic partnerships between leading photonics companies and other technology players are fostering innovation and broadening market reach. Government initiatives supporting research and development in photonics are creating a favorable environment for growth and attracting new investments.
Key Players Shaping the Photonics Market Market
- Coherent Corporation
- AMS OSRAM AG
- Signify NV
- Hamamatsu Photonics KK
- Schott AG
- Nikon Corporation
- Molex Inc (Koch Industries)
- Polatis Incorporated (HUBER+SUHNER)
- Innolume GmbH
- LEA Photonics SAS (Keopsys)
- Infinera Corporation
- Alcatel-lucent SA (Nokia Corporation)
- Corning Inc
- NEC Corporation
- IPG Photonics Corporation
- Carl Zeiss AG (Scantinel Photonics GmbH)
- Intel Corporation
Notable Milestones in Photonics Market Sector
- November 2023: Ams OSRAM AG launched the OSTAR Projection Compact family of LEDs, featuring red, true green, and blue colors, enabling the creation of more powerful and slimmer products for machine vision and stage lighting.
- September 2023: IPG Photonics Corporation launched a new dual-beam laser with the highest single-mode core power, offering significant speed and productivity improvements for battery welding.
In-Depth Photonics Market Market Outlook
The photonics market is poised for sustained growth, driven by ongoing technological advancements, increasing demand across diverse sectors, and supportive government policies. Strategic partnerships and market expansion initiatives will further propel market growth. The long-term outlook remains positive, with significant opportunities for innovation and market penetration across emerging applications and geographies. The market is predicted to witness a xx% increase in overall value by 2033.
Photonics Market Segmentation
-
1. End-user Industry
- 1.1. Consumer
- 1.2. Aerospace and Defense
- 1.3. Display
- 1.4. Solar
- 1.5. LED Lighting
- 1.6. Medical and Bioinstrumentation
- 1.7. Industrial and Manufacturing
- 1.8. Automotive
- 1.9. Other End-user Industries
Photonics Market Segmentation By Geography
-
1. North America
- 1.1. United States
- 1.2. Canada
-
2. Europe
- 2.1. United Kingdom
- 2.2. Germany
- 2.3. France
- 2.4. Italy
- 2.5. Rest of Europe
-
3. Asia Pacific
- 3.1. Japan
- 3.2. China
- 3.3. India
- 3.4. Taiwan
- 3.5. South Korea
- 3.6. Rest of Asia Pacific
- 4. Rest of the World

Photonics Market REPORT HIGHLIGHTS
| Aspects | Details |
|---|---|
| Study Period | 2019-2033 |
| Base Year | 2024 |
| Estimated Year | 2025 |
| Forecast Period | 2025-2033 |
| Historical Period | 2019-2024 |
| Growth Rate | CAGR of 6.50% from 2019-2033 |
| Segmentation |
|
Table of Contents
- 1. Introduction
- 1.1. Research Scope
- 1.2. Market Segmentation
- 1.3. Research Methodology
- 1.4. Definitions and Assumptions
- 2. Executive Summary
- 2.1. Introduction
- 3. Market Dynamics
- 3.1. Introduction
- 3.2. Market Drivers
- 3.2.1. Emergence of Silicon-based Photonics Applications; Increasing Focus on High Performance and Eco-friendly Solutions
- 3.3. Market Restrains
- 3.3.1. High Initial Cost of Photonics-enabled Devices
- 3.4. Market Trends
- 3.4.1. Consumer End-user Industry Segment Holds Significant Market Share
- 4. Market Factor Analysis
- 4.1. Porters Five Forces
- 4.2. Supply/Value Chain
- 4.3. PESTEL analysis
- 4.4. Market Entropy
- 4.5. Patent/Trademark Analysis
- 5. Global Photonics Market Analysis, Insights and Forecast, 2019-2031
- 5.1. Market Analysis, Insights and Forecast - by End-user Industry
- 5.1.1. Consumer
- 5.1.2. Aerospace and Defense
- 5.1.3. Display
- 5.1.4. Solar
- 5.1.5. LED Lighting
- 5.1.6. Medical and Bioinstrumentation
- 5.1.7. Industrial and Manufacturing
- 5.1.8. Automotive
- 5.1.9. Other End-user Industries
- 5.2. Market Analysis, Insights and Forecast - by Region
- 5.2.1. North America
- 5.2.2. Europe
- 5.2.3. Asia Pacific
- 5.2.4. Rest of the World
- 5.1. Market Analysis, Insights and Forecast - by End-user Industry
- 6. North America Photonics Market Analysis, Insights and Forecast, 2019-2031
- 6.1. Market Analysis, Insights and Forecast - by End-user Industry
- 6.1.1. Consumer
- 6.1.2. Aerospace and Defense
- 6.1.3. Display
- 6.1.4. Solar
- 6.1.5. LED Lighting
- 6.1.6. Medical and Bioinstrumentation
- 6.1.7. Industrial and Manufacturing
- 6.1.8. Automotive
- 6.1.9. Other End-user Industries
- 6.1. Market Analysis, Insights and Forecast - by End-user Industry
- 7. Europe Photonics Market Analysis, Insights and Forecast, 2019-2031
- 7.1. Market Analysis, Insights and Forecast - by End-user Industry
- 7.1.1. Consumer
- 7.1.2. Aerospace and Defense
- 7.1.3. Display
- 7.1.4. Solar
- 7.1.5. LED Lighting
- 7.1.6. Medical and Bioinstrumentation
- 7.1.7. Industrial and Manufacturing
- 7.1.8. Automotive
- 7.1.9. Other End-user Industries
- 7.1. Market Analysis, Insights and Forecast - by End-user Industry
- 8. Asia Pacific Photonics Market Analysis, Insights and Forecast, 2019-2031
- 8.1. Market Analysis, Insights and Forecast - by End-user Industry
- 8.1.1. Consumer
- 8.1.2. Aerospace and Defense
- 8.1.3. Display
- 8.1.4. Solar
- 8.1.5. LED Lighting
- 8.1.6. Medical and Bioinstrumentation
- 8.1.7. Industrial and Manufacturing
- 8.1.8. Automotive
- 8.1.9. Other End-user Industries
- 8.1. Market Analysis, Insights and Forecast - by End-user Industry
- 9. Rest of the World Photonics Market Analysis, Insights and Forecast, 2019-2031
- 9.1. Market Analysis, Insights and Forecast - by End-user Industry
- 9.1.1. Consumer
- 9.1.2. Aerospace and Defense
- 9.1.3. Display
- 9.1.4. Solar
- 9.1.5. LED Lighting
- 9.1.6. Medical and Bioinstrumentation
- 9.1.7. Industrial and Manufacturing
- 9.1.8. Automotive
- 9.1.9. Other End-user Industries
- 9.1. Market Analysis, Insights and Forecast - by End-user Industry
- 10. North America Photonics Market Analysis, Insights and Forecast, 2019-2031
- 10.1. Market Analysis, Insights and Forecast - By Country/Sub-region
- 10.1.1 United States
- 10.1.2 Canada
- 10.1.3 Mexico
- 11. Europe Photonics Market Analysis, Insights and Forecast, 2019-2031
- 11.1. Market Analysis, Insights and Forecast - By Country/Sub-region
- 11.1.1 Germany
- 11.1.2 United Kingdom
- 11.1.3 France
- 11.1.4 Spain
- 11.1.5 Italy
- 11.1.6 Spain
- 11.1.7 Belgium
- 11.1.8 Netherland
- 11.1.9 Nordics
- 11.1.10 Rest of Europe
- 12. Asia Pacific Photonics Market Analysis, Insights and Forecast, 2019-2031
- 12.1. Market Analysis, Insights and Forecast - By Country/Sub-region
- 12.1.1 China
- 12.1.2 Japan
- 12.1.3 India
- 12.1.4 South Korea
- 12.1.5 Southeast Asia
- 12.1.6 Australia
- 12.1.7 Indonesia
- 12.1.8 Phillipes
- 12.1.9 Singapore
- 12.1.10 Thailandc
- 12.1.11 Rest of Asia Pacific
- 13. South America Photonics Market Analysis, Insights and Forecast, 2019-2031
- 13.1. Market Analysis, Insights and Forecast - By Country/Sub-region
- 13.1.1 Brazil
- 13.1.2 Argentina
- 13.1.3 Peru
- 13.1.4 Chile
- 13.1.5 Colombia
- 13.1.6 Ecuador
- 13.1.7 Venezuela
- 13.1.8 Rest of South America
- 14. North America Photonics Market Analysis, Insights and Forecast, 2019-2031
- 14.1. Market Analysis, Insights and Forecast - By Country/Sub-region
- 14.1.1 United States
- 14.1.2 Canada
- 14.1.3 Mexico
- 15. MEA Photonics Market Analysis, Insights and Forecast, 2019-2031
- 15.1. Market Analysis, Insights and Forecast - By Country/Sub-region
- 15.1.1 United Arab Emirates
- 15.1.2 Saudi Arabia
- 15.1.3 South Africa
- 15.1.4 Rest of Middle East and Africa
- 16. Competitive Analysis
- 16.1. Global Market Share Analysis 2024
- 16.2. Company Profiles
- 16.2.1 Coherent Corporation
- 16.2.1.1. Overview
- 16.2.1.2. Products
- 16.2.1.3. SWOT Analysis
- 16.2.1.4. Recent Developments
- 16.2.1.5. Financials (Based on Availability)
- 16.2.2 AMS OSRAM AG
- 16.2.2.1. Overview
- 16.2.2.2. Products
- 16.2.2.3. SWOT Analysis
- 16.2.2.4. Recent Developments
- 16.2.2.5. Financials (Based on Availability)
- 16.2.3 Signify NV
- 16.2.3.1. Overview
- 16.2.3.2. Products
- 16.2.3.3. SWOT Analysis
- 16.2.3.4. Recent Developments
- 16.2.3.5. Financials (Based on Availability)
- 16.2.4 Hamamatsu Photonics KK
- 16.2.4.1. Overview
- 16.2.4.2. Products
- 16.2.4.3. SWOT Analysis
- 16.2.4.4. Recent Developments
- 16.2.4.5. Financials (Based on Availability)
- 16.2.5 Schott AG
- 16.2.5.1. Overview
- 16.2.5.2. Products
- 16.2.5.3. SWOT Analysis
- 16.2.5.4. Recent Developments
- 16.2.5.5. Financials (Based on Availability)
- 16.2.6 Nikon Corporation
- 16.2.6.1. Overview
- 16.2.6.2. Products
- 16.2.6.3. SWOT Analysis
- 16.2.6.4. Recent Developments
- 16.2.6.5. Financials (Based on Availability)
- 16.2.7 Molex Inc (Koch Industries)
- 16.2.7.1. Overview
- 16.2.7.2. Products
- 16.2.7.3. SWOT Analysis
- 16.2.7.4. Recent Developments
- 16.2.7.5. Financials (Based on Availability)
- 16.2.8 Polatis Incorporated (HUBER+SUHNER)
- 16.2.8.1. Overview
- 16.2.8.2. Products
- 16.2.8.3. SWOT Analysis
- 16.2.8.4. Recent Developments
- 16.2.8.5. Financials (Based on Availability)
- 16.2.9 Innolume GmbH
- 16.2.9.1. Overview
- 16.2.9.2. Products
- 16.2.9.3. SWOT Analysis
- 16.2.9.4. Recent Developments
- 16.2.9.5. Financials (Based on Availability)
- 16.2.10 LEA Photonics SAS (Keopsys)
- 16.2.10.1. Overview
- 16.2.10.2. Products
- 16.2.10.3. SWOT Analysis
- 16.2.10.4. Recent Developments
- 16.2.10.5. Financials (Based on Availability)
- 16.2.11 Infinera Corporation
- 16.2.11.1. Overview
- 16.2.11.2. Products
- 16.2.11.3. SWOT Analysis
- 16.2.11.4. Recent Developments
- 16.2.11.5. Financials (Based on Availability)
- 16.2.12 Alcatel-lucent SA (Nokia Corporation)
- 16.2.12.1. Overview
- 16.2.12.2. Products
- 16.2.12.3. SWOT Analysis
- 16.2.12.4. Recent Developments
- 16.2.12.5. Financials (Based on Availability)
- 16.2.13 Corning Inc
- 16.2.13.1. Overview
- 16.2.13.2. Products
- 16.2.13.3. SWOT Analysis
- 16.2.13.4. Recent Developments
- 16.2.13.5. Financials (Based on Availability)
- 16.2.14 NEC Corporation
- 16.2.14.1. Overview
- 16.2.14.2. Products
- 16.2.14.3. SWOT Analysis
- 16.2.14.4. Recent Developments
- 16.2.14.5. Financials (Based on Availability)
- 16.2.15 IPG Photonics Corporation
- 16.2.15.1. Overview
- 16.2.15.2. Products
- 16.2.15.3. SWOT Analysis
- 16.2.15.4. Recent Developments
- 16.2.15.5. Financials (Based on Availability)
- 16.2.16 Carl Zeiss AG (Scantinel Photonics GmbH)
- 16.2.16.1. Overview
- 16.2.16.2. Products
- 16.2.16.3. SWOT Analysis
- 16.2.16.4. Recent Developments
- 16.2.16.5. Financials (Based on Availability)
- 16.2.17 Intel Corporation
- 16.2.17.1. Overview
- 16.2.17.2. Products
- 16.2.17.3. SWOT Analysis
- 16.2.17.4. Recent Developments
- 16.2.17.5. Financials (Based on Availability)
- 16.2.1 Coherent Corporation
List of Figures
- Figure 1: Global Photonics Market Revenue Breakdown (Million, %) by Region 2024 & 2032
- Figure 2: North America Photonics Market Revenue (Million), by Country 2024 & 2032
- Figure 3: North America Photonics Market Revenue Share (%), by Country 2024 & 2032
- Figure 4: Europe Photonics Market Revenue (Million), by Country 2024 & 2032
- Figure 5: Europe Photonics Market Revenue Share (%), by Country 2024 & 2032
- Figure 6: Asia Pacific Photonics Market Revenue (Million), by Country 2024 & 2032
- Figure 7: Asia Pacific Photonics Market Revenue Share (%), by Country 2024 & 2032
- Figure 8: South America Photonics Market Revenue (Million), by Country 2024 & 2032
- Figure 9: South America Photonics Market Revenue Share (%), by Country 2024 & 2032
- Figure 10: North America Photonics Market Revenue (Million), by Country 2024 & 2032
- Figure 11: North America Photonics Market Revenue Share (%), by Country 2024 & 2032
- Figure 12: MEA Photonics Market Revenue (Million), by Country 2024 & 2032
- Figure 13: MEA Photonics Market Revenue Share (%), by Country 2024 & 2032
- Figure 14: North America Photonics Market Revenue (Million), by End-user Industry 2024 & 2032
- Figure 15: North America Photonics Market Revenue Share (%), by End-user Industry 2024 & 2032
- Figure 16: North America Photonics Market Revenue (Million), by Country 2024 & 2032
- Figure 17: North America Photonics Market Revenue Share (%), by Country 2024 & 2032
- Figure 18: Europe Photonics Market Revenue (Million), by End-user Industry 2024 & 2032
- Figure 19: Europe Photonics Market Revenue Share (%), by End-user Industry 2024 & 2032
- Figure 20: Europe Photonics Market Revenue (Million), by Country 2024 & 2032
- Figure 21: Europe Photonics Market Revenue Share (%), by Country 2024 & 2032
- Figure 22: Asia Pacific Photonics Market Revenue (Million), by End-user Industry 2024 & 2032
- Figure 23: Asia Pacific Photonics Market Revenue Share (%), by End-user Industry 2024 & 2032
- Figure 24: Asia Pacific Photonics Market Revenue (Million), by Country 2024 & 2032
- Figure 25: Asia Pacific Photonics Market Revenue Share (%), by Country 2024 & 2032
- Figure 26: Rest of the World Photonics Market Revenue (Million), by End-user Industry 2024 & 2032
- Figure 27: Rest of the World Photonics Market Revenue Share (%), by End-user Industry 2024 & 2032
- Figure 28: Rest of the World Photonics Market Revenue (Million), by Country 2024 & 2032
- Figure 29: Rest of the World Photonics Market Revenue Share (%), by Country 2024 & 2032
List of Tables
- Table 1: Global Photonics Market Revenue Million Forecast, by Region 2019 & 2032
- Table 2: Global Photonics Market Revenue Million Forecast, by End-user Industry 2019 & 2032
- Table 3: Global Photonics Market Revenue Million Forecast, by Region 2019 & 2032
- Table 4: Global Photonics Market Revenue Million Forecast, by Country 2019 & 2032
- Table 5: United States Photonics Market Revenue (Million) Forecast, by Application 2019 & 2032
- Table 6: Canada Photonics Market Revenue (Million) Forecast, by Application 2019 & 2032
- Table 7: Mexico Photonics Market Revenue (Million) Forecast, by Application 2019 & 2032
- Table 8: Global Photonics Market Revenue Million Forecast, by Country 2019 & 2032
- Table 9: Germany Photonics Market Revenue (Million) Forecast, by Application 2019 & 2032
- Table 10: United Kingdom Photonics Market Revenue (Million) Forecast, by Application 2019 & 2032
- Table 11: France Photonics Market Revenue (Million) Forecast, by Application 2019 & 2032
- Table 12: Spain Photonics Market Revenue (Million) Forecast, by Application 2019 & 2032
- Table 13: Italy Photonics Market Revenue (Million) Forecast, by Application 2019 & 2032
- Table 14: Spain Photonics Market Revenue (Million) Forecast, by Application 2019 & 2032
- Table 15: Belgium Photonics Market Revenue (Million) Forecast, by Application 2019 & 2032
- Table 16: Netherland Photonics Market Revenue (Million) Forecast, by Application 2019 & 2032
- Table 17: Nordics Photonics Market Revenue (Million) Forecast, by Application 2019 & 2032
- Table 18: Rest of Europe Photonics Market Revenue (Million) Forecast, by Application 2019 & 2032
- Table 19: Global Photonics Market Revenue Million Forecast, by Country 2019 & 2032
- Table 20: China Photonics Market Revenue (Million) Forecast, by Application 2019 & 2032
- Table 21: Japan Photonics Market Revenue (Million) Forecast, by Application 2019 & 2032
- Table 22: India Photonics Market Revenue (Million) Forecast, by Application 2019 & 2032
- Table 23: South Korea Photonics Market Revenue (Million) Forecast, by Application 2019 & 2032
- Table 24: Southeast Asia Photonics Market Revenue (Million) Forecast, by Application 2019 & 2032
- Table 25: Australia Photonics Market Revenue (Million) Forecast, by Application 2019 & 2032
- Table 26: Indonesia Photonics Market Revenue (Million) Forecast, by Application 2019 & 2032
- Table 27: Phillipes Photonics Market Revenue (Million) Forecast, by Application 2019 & 2032
- Table 28: Singapore Photonics Market Revenue (Million) Forecast, by Application 2019 & 2032
- Table 29: Thailandc Photonics Market Revenue (Million) Forecast, by Application 2019 & 2032
- Table 30: Rest of Asia Pacific Photonics Market Revenue (Million) Forecast, by Application 2019 & 2032
- Table 31: Global Photonics Market Revenue Million Forecast, by Country 2019 & 2032
- Table 32: Brazil Photonics Market Revenue (Million) Forecast, by Application 2019 & 2032
- Table 33: Argentina Photonics Market Revenue (Million) Forecast, by Application 2019 & 2032
- Table 34: Peru Photonics Market Revenue (Million) Forecast, by Application 2019 & 2032
- Table 35: Chile Photonics Market Revenue (Million) Forecast, by Application 2019 & 2032
- Table 36: Colombia Photonics Market Revenue (Million) Forecast, by Application 2019 & 2032
- Table 37: Ecuador Photonics Market Revenue (Million) Forecast, by Application 2019 & 2032
- Table 38: Venezuela Photonics Market Revenue (Million) Forecast, by Application 2019 & 2032
- Table 39: Rest of South America Photonics Market Revenue (Million) Forecast, by Application 2019 & 2032
- Table 40: Global Photonics Market Revenue Million Forecast, by Country 2019 & 2032
- Table 41: United States Photonics Market Revenue (Million) Forecast, by Application 2019 & 2032
- Table 42: Canada Photonics Market Revenue (Million) Forecast, by Application 2019 & 2032
- Table 43: Mexico Photonics Market Revenue (Million) Forecast, by Application 2019 & 2032
- Table 44: Global Photonics Market Revenue Million Forecast, by Country 2019 & 2032
- Table 45: United Arab Emirates Photonics Market Revenue (Million) Forecast, by Application 2019 & 2032
- Table 46: Saudi Arabia Photonics Market Revenue (Million) Forecast, by Application 2019 & 2032
- Table 47: South Africa Photonics Market Revenue (Million) Forecast, by Application 2019 & 2032
- Table 48: Rest of Middle East and Africa Photonics Market Revenue (Million) Forecast, by Application 2019 & 2032
- Table 49: Global Photonics Market Revenue Million Forecast, by End-user Industry 2019 & 2032
- Table 50: Global Photonics Market Revenue Million Forecast, by Country 2019 & 2032
- Table 51: United States Photonics Market Revenue (Million) Forecast, by Application 2019 & 2032
- Table 52: Canada Photonics Market Revenue (Million) Forecast, by Application 2019 & 2032
- Table 53: Global Photonics Market Revenue Million Forecast, by End-user Industry 2019 & 2032
- Table 54: Global Photonics Market Revenue Million Forecast, by Country 2019 & 2032
- Table 55: United Kingdom Photonics Market Revenue (Million) Forecast, by Application 2019 & 2032
- Table 56: Germany Photonics Market Revenue (Million) Forecast, by Application 2019 & 2032
- Table 57: France Photonics Market Revenue (Million) Forecast, by Application 2019 & 2032
- Table 58: Italy Photonics Market Revenue (Million) Forecast, by Application 2019 & 2032
- Table 59: Rest of Europe Photonics Market Revenue (Million) Forecast, by Application 2019 & 2032
- Table 60: Global Photonics Market Revenue Million Forecast, by End-user Industry 2019 & 2032
- Table 61: Global Photonics Market Revenue Million Forecast, by Country 2019 & 2032
- Table 62: Japan Photonics Market Revenue (Million) Forecast, by Application 2019 & 2032
- Table 63: China Photonics Market Revenue (Million) Forecast, by Application 2019 & 2032
- Table 64: India Photonics Market Revenue (Million) Forecast, by Application 2019 & 2032
- Table 65: Taiwan Photonics Market Revenue (Million) Forecast, by Application 2019 & 2032
- Table 66: South Korea Photonics Market Revenue (Million) Forecast, by Application 2019 & 2032
- Table 67: Rest of Asia Pacific Photonics Market Revenue (Million) Forecast, by Application 2019 & 2032
- Table 68: Global Photonics Market Revenue Million Forecast, by End-user Industry 2019 & 2032
- Table 69: Global Photonics Market Revenue Million Forecast, by Country 2019 & 2032
Frequently Asked Questions
1. What is the projected Compound Annual Growth Rate (CAGR) of the Photonics Market?
The projected CAGR is approximately 6.50%.
2. Which companies are prominent players in the Photonics Market?
Key companies in the market include Coherent Corporation, AMS OSRAM AG, Signify NV, Hamamatsu Photonics KK, Schott AG, Nikon Corporation, Molex Inc (Koch Industries), Polatis Incorporated (HUBER+SUHNER), Innolume GmbH, LEA Photonics SAS (Keopsys), Infinera Corporation, Alcatel-lucent SA (Nokia Corporation), Corning Inc, NEC Corporation, IPG Photonics Corporation, Carl Zeiss AG (Scantinel Photonics GmbH), Intel Corporation.
3. What are the main segments of the Photonics Market?
The market segments include End-user Industry.
4. Can you provide details about the market size?
The market size is estimated to be USD 1.64 Million as of 2022.
5. What are some drivers contributing to market growth?
Emergence of Silicon-based Photonics Applications; Increasing Focus on High Performance and Eco-friendly Solutions.
6. What are the notable trends driving market growth?
Consumer End-user Industry Segment Holds Significant Market Share.
7. Are there any restraints impacting market growth?
High Initial Cost of Photonics-enabled Devices.
8. Can you provide examples of recent developments in the market?
November 2023 - Ams OSRAM AG adds Red, True Green, and Blue colors to its OSTAR Projection Compact family of low-profile, ultra-high brightness LEDs, which enables manufacturers of machine vision systems or stage lighting fixtures to create more powerful and slimmer products. The OSTAR Projection Compact LEDs can be packed very closely together in high-power luminaire designs because of their excellent thermal dissipation and small, flat package. The thermal resistance is just 1.4 K/W, while the 4040 package has 4.0 mm x 4.0 mm x 0.75 mm dimensions.
9. What pricing options are available for accessing the report?
Pricing options include single-user, multi-user, and enterprise licenses priced at USD 4750, USD 5250, and USD 8750 respectively.
10. Is the market size provided in terms of value or volume?
The market size is provided in terms of value, measured in Million.
11. Are there any specific market keywords associated with the report?
Yes, the market keyword associated with the report is "Photonics Market," which aids in identifying and referencing the specific market segment covered.
12. How do I determine which pricing option suits my needs best?
The pricing options vary based on user requirements and access needs. Individual users may opt for single-user licenses, while businesses requiring broader access may choose multi-user or enterprise licenses for cost-effective access to the report.
13. Are there any additional resources or data provided in the Photonics Market report?
While the report offers comprehensive insights, it's advisable to review the specific contents or supplementary materials provided to ascertain if additional resources or data are available.
14. How can I stay updated on further developments or reports in the Photonics Market?
To stay informed about further developments, trends, and reports in the Photonics Market, consider subscribing to industry newsletters, following relevant companies and organizations, or regularly checking reputable industry news sources and publications.
Methodology
Step 1 - Identification of Relevant Samples Size from Population Database


Step 2 - Approaches for Defining Global Market Size (Value, Volume* & Price*)

Note*: In applicable scenarios
Step 3 - Data Sources
Primary Research
- Web Analytics
- Survey Reports
- Research Institute
- Latest Research Reports
- Opinion Leaders
Secondary Research
- Annual Reports
- White Paper
- Latest Press Release
- Industry Association
- Paid Database
- Investor Presentations

Step 4 - Data Triangulation
Involves using different sources of information in order to increase the validity of a study
These sources are likely to be stakeholders in a program - participants, other researchers, program staff, other community members, and so on.
Then we put all data in single framework & apply various statistical tools to find out the dynamic on the market.
During the analysis stage, feedback from the stakeholder groups would be compared to determine areas of agreement as well as areas of divergence
