

Key Insights
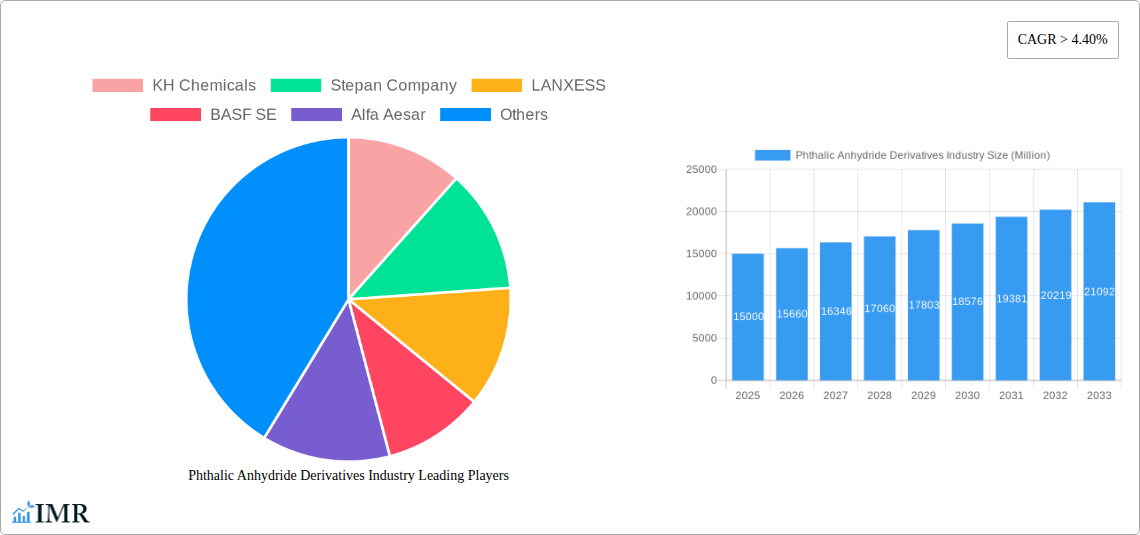
The phthalic anhydride derivatives market is experiencing robust growth, driven by increasing demand across diverse end-use industries. The market's Compound Annual Growth Rate (CAGR) exceeding 4.40% indicates a consistently expanding market size, projected to reach a significant value in the coming years. Key drivers include the burgeoning construction sector, particularly in developing economies, fueled by infrastructure development and urbanization. The automotive industry's reliance on phthalic anhydride derivatives for various components also contributes significantly to market expansion. Furthermore, the growing electronics and electrical sectors are increasing the demand for these materials in insulation and other applications. While challenges such as fluctuating raw material prices and environmental concerns related to production processes exist, innovation in sustainable manufacturing practices and the development of higher-performance derivatives are mitigating these restraints. Segmentation analysis reveals unsaturated polyester resins as a dominant derivative type, while the construction industry constitutes a major end-user segment. Leading players in the market are strategically investing in research and development to expand their product portfolio and enhance their market position. Geographic expansion, particularly in Asia-Pacific, driven by rapid industrialization and economic growth, presents substantial opportunities for market players.
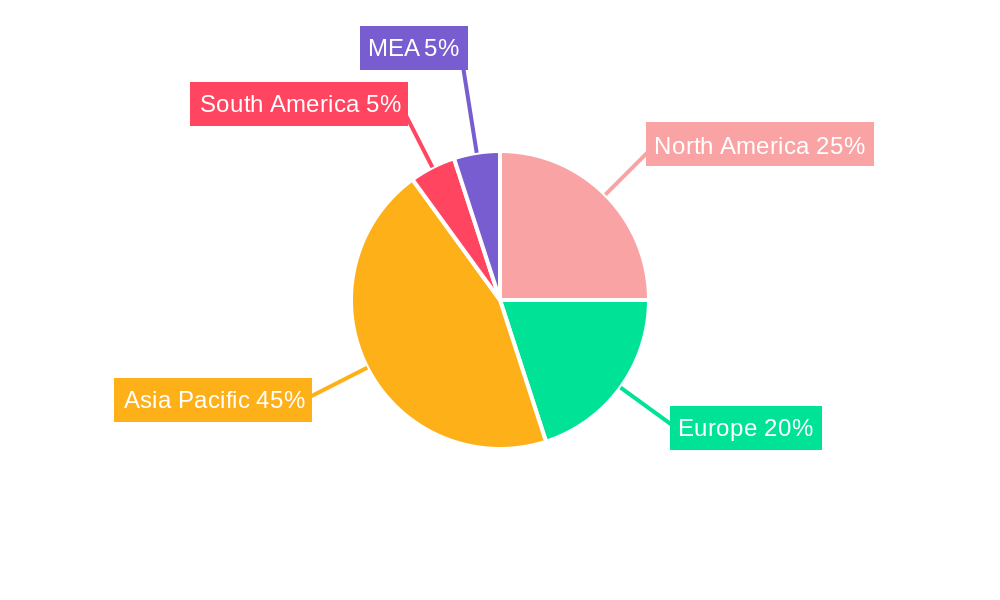
The forecast period (2025-2033) promises continued expansion, with projections indicating a significant increase in market value. Regional variations in growth will likely persist, with Asia-Pacific maintaining a strong lead due to its rapidly developing infrastructure and manufacturing sectors. North America and Europe, while exhibiting steady growth, are expected to maintain a relatively smaller share compared to Asia-Pacific. The competitive landscape remains dynamic, with both established multinational corporations and regional players vying for market share through strategic acquisitions, collaborations, and capacity expansion. The long-term outlook for the phthalic anhydride derivatives market remains positive, anticipating continued growth fueled by technological advancements and expanding industrial applications. However, maintaining a sustainable production model and addressing environmental concerns will remain crucial for long-term success within this sector.
Phthalic Anhydride Derivatives Industry: A Comprehensive Market Report (2019-2033)
This comprehensive report provides an in-depth analysis of the Phthalic Anhydride Derivatives industry, offering invaluable insights for industry professionals, investors, and strategic decision-makers. The report covers the period 2019-2033, with a focus on the forecast period 2025-2033 (Base Year: 2025, Estimated Year: 2025). It examines market dynamics, growth trends, dominant segments, key players, and emerging opportunities within the parent market of chemical intermediates and the child markets of unsaturated polyester resins, alkyd resins, plasticizers, and other derivatives. The report is meticulously researched and delivers actionable intelligence for navigating this dynamic market. The total market size is predicted to reach xx Million by 2033.
Phthalic Anhydride Derivatives Industry Market Dynamics & Structure
The Phthalic Anhydride Derivatives market is characterized by moderate concentration, with key players such as BASF SE, LANXESS, and Stepan Company holding significant market share. Technological innovation, particularly in enhancing product performance and sustainability, is a crucial driver. Stringent environmental regulations are shaping industry practices, pushing for more eco-friendly production methods. The market faces competition from alternative materials, but the versatile nature of phthalic anhydride derivatives ensures continued demand. The M&A landscape has witnessed a moderate level of activity in recent years, primarily focused on consolidating market share and expanding geographic reach.
- Market Concentration: Moderately concentrated, with top 5 players holding approximately xx% market share in 2024.
- Technological Innovation: Focus on improving product efficiency, reducing environmental impact, and developing specialized applications.
- Regulatory Framework: Stringent environmental regulations drive adoption of sustainable production processes.
- Competitive Substitutes: Bio-based alternatives and other polymers pose some competition.
- End-User Demographics: Primarily driven by construction, automotive, and electrical & electronics industries.
- M&A Trends: Moderate activity observed, with xx M&A deals recorded between 2019 and 2024.
Phthalic Anhydride Derivatives Industry Growth Trends & Insights
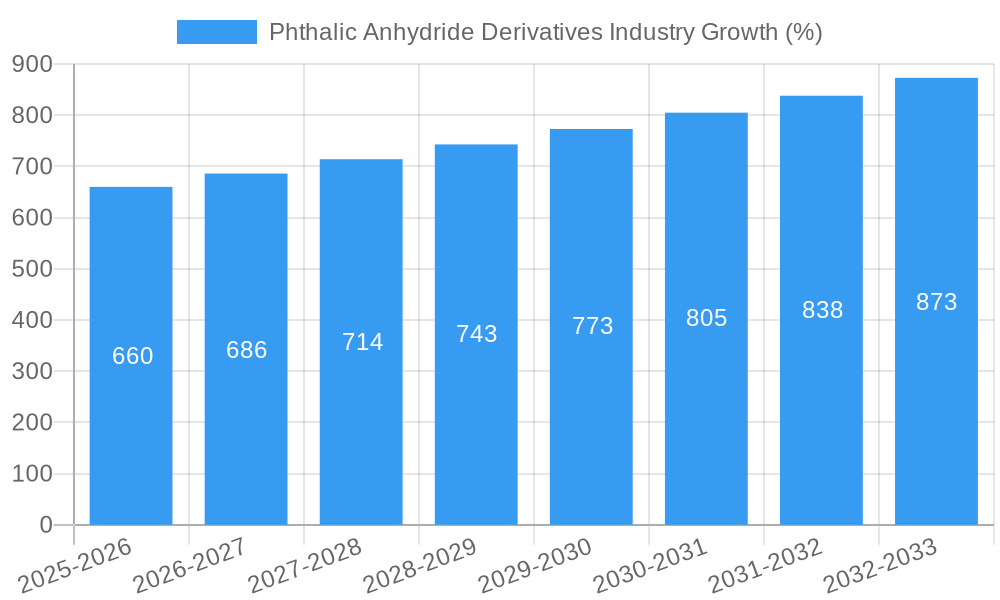
The Phthalic Anhydride Derivatives market experienced a CAGR of xx% during the historical period (2019-2024). This growth is attributed to the robust demand from major end-user industries, particularly the construction and automotive sectors. Technological advancements, leading to enhanced product properties and efficiency, have also fueled market expansion. The increasing adoption of these derivatives in various applications, coupled with favorable economic conditions in key regions, further supports market growth. However, fluctuations in raw material prices and environmental concerns represent potential challenges. The forecast period (2025-2033) projects a CAGR of xx%, driven by increasing infrastructure development and the rising demand for lightweight and durable materials in various sectors. Market penetration is expected to increase by xx% by 2033.
Dominant Regions, Countries, or Segments in Phthalic Anhydride Derivatives Industry
The Asia-Pacific region is currently the dominant market for Phthalic Anhydride Derivatives, driven by rapid industrialization and infrastructure development in countries like China and India. Within the derivative segments, Unsaturated Polyester Resins and Alkyd Resins hold the largest market shares, due to their extensive use in construction and automotive applications. The construction sector is the leading end-user industry globally, while the automotive sector demonstrates the highest growth potential.
- Asia-Pacific: Dominates the market due to rapid industrialization and infrastructure growth.
- Unsaturated Polyester Resins & Alkyd Resins: Largest derivative segments due to extensive construction and automotive applications.
- Construction Sector: Leading end-user industry globally, providing substantial market demand.
- Automotive Sector: Exhibits highest growth potential, driven by increasing vehicle production.
- Key Drivers: Government infrastructure projects, expanding automotive industry, increasing construction activity, rising disposable income in developing economies.
Phthalic Anhydride Derivatives Industry Product Landscape
Phthalic anhydride derivatives are characterized by their diverse applications and customizable properties. Innovations focus on enhancing performance, such as improved heat resistance, UV stability, and flexibility. These advancements cater to the demands of diverse end-users, including specialized applications in aerospace and electronics. The unique selling propositions lie in their cost-effectiveness, versatility, and compatibility with various processing methods.
Key Drivers, Barriers & Challenges in Phthalic Anhydride Derivatives Industry
Key Drivers:
- Growing construction and automotive industries.
- Expanding application scope in electrical & electronics and aerospace sectors.
- Technological advancements leading to improved product properties.
Key Challenges:
- Fluctuations in raw material prices (e.g., crude oil prices).
- Stringent environmental regulations impacting production costs.
- Intense competition from alternative materials and substitutes. This is expected to reduce market growth by xx% by 2030.
Emerging Opportunities in Phthalic Anhydride Derivatives Industry
- Untapped markets in developing economies.
- Growing demand for sustainable and eco-friendly derivatives.
- Expansion into niche applications, such as bioplastics and composites.
- Development of high-performance derivatives for specialized applications.
Growth Accelerators in the Phthalic Anhydride Derivatives Industry Industry
Long-term growth is fueled by technological breakthroughs leading to higher efficiency and performance, strategic partnerships for market expansion, and exploration of new applications in emerging industries. Increased focus on sustainable production practices, driven by environmental regulations, will also be a key growth driver.
Key Players Shaping the Phthalic Anhydride Derivatives Industry Market
- KH Chemicals
- Stepan Company
- LANXESS
- BASF SE
- Alfa Aesar
- PENPET Petrochemical Trading GmbH
- JFE Chemical Corporation
- I G Petrochemicals Ltd
- Polynt SpA
- Thirumalai Chemicals Ltd
- Tokyo Chemical Industry
- S I Group Inc
- Koppers Inc
- Perstorp
- The Chemical Company
Notable Milestones in Phthalic Anhydride Derivatives Industry Sector
- 2020: BASF SE launches a new generation of phthalate-free plasticizers.
- 2022: Stepan Company invests in a new production facility for alkyd resins in Southeast Asia.
- 2023: A significant merger between two smaller players in the market consolidates market share.
In-Depth Phthalic Anhydride Derivatives Industry Market Outlook
The Phthalic Anhydride Derivatives market is poised for continued growth, driven by increasing industrialization and infrastructure development. Strategic investments in R&D, focusing on sustainable and high-performance derivatives, will be crucial for market leadership. The focus on diversification into new applications and geographical expansion will further solidify future market dominance. The long-term outlook is positive, with significant opportunities for growth and innovation.
Phthalic Anhydride Derivatives Industry Segmentation
-
1. Derivatives
- 1.1. Unsaturated Polyester Resins
- 1.2. Alkyd Resin
- 1.3. Plasticizer
- 1.4. Other
-
2. End-user Industry
- 2.1. Construction
- 2.2. Automotive
- 2.3. Electrical and Electronics
- 2.4. Aerospace
- 2.5. Others
Phthalic Anhydride Derivatives Industry Segmentation By Geography
-
1. Asia Pacific
- 1.1. China
- 1.2. India
- 1.3. Japan
- 1.4. South Korea
- 1.5. Rest of Asia Pacific
-
2. North America
- 2.1. United States
- 2.2. Canada
- 2.3. Mexico
-
3. Europe
- 3.1. Germany
- 3.2. United Kingdom
- 3.3. France
- 3.4. Italy
- 3.5. Rest of Europe
-
4. South America
- 4.1. Brazil
- 4.2. Argentina
- 4.3. Rest of South America
-
5. Middle East and Africa
- 5.1. Saudi Arabia
- 5.2. South Africa
- 5.3. Rest of Middle East and Africa
Phthalic Anhydride Derivatives Industry REPORT HIGHLIGHTS
| Aspects | Details |
|---|---|
| Study Period | 2019-2033 |
| Base Year | 2024 |
| Estimated Year | 2025 |
| Forecast Period | 2025-2033 |
| Historical Period | 2019-2024 |
| Growth Rate | CAGR of > 4.40% from 2019-2033 |
| Segmentation |
|
Table of Contents
- 1. Introduction
- 1.1. Research Scope
- 1.2. Market Segmentation
- 1.3. Research Methodology
- 1.4. Definitions and Assumptions
- 2. Executive Summary
- 2.1. Introduction
- 3. Market Dynamics
- 3.1. Introduction
- 3.2. Market Drivers
- 3.2.1. ; Increasing Consumption of Plastics in Construction Sector; Other Drivers
- 3.3. Market Restrains
- 3.3.1. ; Toxicity related to Phthalic Anhydride; Unfavorable Conditions Arising Due to COVID-19 Outbreak
- 3.4. Market Trends
- 3.4.1. Construction Sector to Dominate the Market
- 4. Market Factor Analysis
- 4.1. Porters Five Forces
- 4.2. Supply/Value Chain
- 4.3. PESTEL analysis
- 4.4. Market Entropy
- 4.5. Patent/Trademark Analysis
- 5. Global Phthalic Anhydride Derivatives Industry Analysis, Insights and Forecast, 2019-2031
- 5.1. Market Analysis, Insights and Forecast - by Derivatives
- 5.1.1. Unsaturated Polyester Resins
- 5.1.2. Alkyd Resin
- 5.1.3. Plasticizer
- 5.1.4. Other
- 5.2. Market Analysis, Insights and Forecast - by End-user Industry
- 5.2.1. Construction
- 5.2.2. Automotive
- 5.2.3. Electrical and Electronics
- 5.2.4. Aerospace
- 5.2.5. Others
- 5.3. Market Analysis, Insights and Forecast - by Region
- 5.3.1. Asia Pacific
- 5.3.2. North America
- 5.3.3. Europe
- 5.3.4. South America
- 5.3.5. Middle East and Africa
- 5.1. Market Analysis, Insights and Forecast - by Derivatives
- 6. Asia Pacific Phthalic Anhydride Derivatives Industry Analysis, Insights and Forecast, 2019-2031
- 6.1. Market Analysis, Insights and Forecast - by Derivatives
- 6.1.1. Unsaturated Polyester Resins
- 6.1.2. Alkyd Resin
- 6.1.3. Plasticizer
- 6.1.4. Other
- 6.2. Market Analysis, Insights and Forecast - by End-user Industry
- 6.2.1. Construction
- 6.2.2. Automotive
- 6.2.3. Electrical and Electronics
- 6.2.4. Aerospace
- 6.2.5. Others
- 6.1. Market Analysis, Insights and Forecast - by Derivatives
- 7. North America Phthalic Anhydride Derivatives Industry Analysis, Insights and Forecast, 2019-2031
- 7.1. Market Analysis, Insights and Forecast - by Derivatives
- 7.1.1. Unsaturated Polyester Resins
- 7.1.2. Alkyd Resin
- 7.1.3. Plasticizer
- 7.1.4. Other
- 7.2. Market Analysis, Insights and Forecast - by End-user Industry
- 7.2.1. Construction
- 7.2.2. Automotive
- 7.2.3. Electrical and Electronics
- 7.2.4. Aerospace
- 7.2.5. Others
- 7.1. Market Analysis, Insights and Forecast - by Derivatives
- 8. Europe Phthalic Anhydride Derivatives Industry Analysis, Insights and Forecast, 2019-2031
- 8.1. Market Analysis, Insights and Forecast - by Derivatives
- 8.1.1. Unsaturated Polyester Resins
- 8.1.2. Alkyd Resin
- 8.1.3. Plasticizer
- 8.1.4. Other
- 8.2. Market Analysis, Insights and Forecast - by End-user Industry
- 8.2.1. Construction
- 8.2.2. Automotive
- 8.2.3. Electrical and Electronics
- 8.2.4. Aerospace
- 8.2.5. Others
- 8.1. Market Analysis, Insights and Forecast - by Derivatives
- 9. South America Phthalic Anhydride Derivatives Industry Analysis, Insights and Forecast, 2019-2031
- 9.1. Market Analysis, Insights and Forecast - by Derivatives
- 9.1.1. Unsaturated Polyester Resins
- 9.1.2. Alkyd Resin
- 9.1.3. Plasticizer
- 9.1.4. Other
- 9.2. Market Analysis, Insights and Forecast - by End-user Industry
- 9.2.1. Construction
- 9.2.2. Automotive
- 9.2.3. Electrical and Electronics
- 9.2.4. Aerospace
- 9.2.5. Others
- 9.1. Market Analysis, Insights and Forecast - by Derivatives
- 10. Middle East and Africa Phthalic Anhydride Derivatives Industry Analysis, Insights and Forecast, 2019-2031
- 10.1. Market Analysis, Insights and Forecast - by Derivatives
- 10.1.1. Unsaturated Polyester Resins
- 10.1.2. Alkyd Resin
- 10.1.3. Plasticizer
- 10.1.4. Other
- 10.2. Market Analysis, Insights and Forecast - by End-user Industry
- 10.2.1. Construction
- 10.2.2. Automotive
- 10.2.3. Electrical and Electronics
- 10.2.4. Aerospace
- 10.2.5. Others
- 10.1. Market Analysis, Insights and Forecast - by Derivatives
- 11. North America Phthalic Anhydride Derivatives Industry Analysis, Insights and Forecast, 2019-2031
- 11.1. Market Analysis, Insights and Forecast - By Country/Sub-region
- 11.1.1 United States
- 11.1.2 Canada
- 11.1.3 Mexico
- 12. Europe Phthalic Anhydride Derivatives Industry Analysis, Insights and Forecast, 2019-2031
- 12.1. Market Analysis, Insights and Forecast - By Country/Sub-region
- 12.1.1 Germany
- 12.1.2 France
- 12.1.3 Italy
- 12.1.4 United Kingdom
- 12.1.5 Netherlands
- 12.1.6 Rest of Europe
- 13. Asia Pacific Phthalic Anhydride Derivatives Industry Analysis, Insights and Forecast, 2019-2031
- 13.1. Market Analysis, Insights and Forecast - By Country/Sub-region
- 13.1.1 China
- 13.1.2 Japan
- 13.1.3 India
- 13.1.4 South Korea
- 13.1.5 Taiwan
- 13.1.6 Australia
- 13.1.7 Rest of Asia-Pacific
- 14. South America Phthalic Anhydride Derivatives Industry Analysis, Insights and Forecast, 2019-2031
- 14.1. Market Analysis, Insights and Forecast - By Country/Sub-region
- 14.1.1 Brazil
- 14.1.2 Argentina
- 14.1.3 Rest of South America
- 15. MEA Phthalic Anhydride Derivatives Industry Analysis, Insights and Forecast, 2019-2031
- 15.1. Market Analysis, Insights and Forecast - By Country/Sub-region
- 15.1.1 Middle East
- 15.1.2 Africa
- 16. Competitive Analysis
- 16.1. Global Market Share Analysis 2024
- 16.2. Company Profiles
- 16.2.1 KH Chemicals
- 16.2.1.1. Overview
- 16.2.1.2. Products
- 16.2.1.3. SWOT Analysis
- 16.2.1.4. Recent Developments
- 16.2.1.5. Financials (Based on Availability)
- 16.2.2 Stepan Company
- 16.2.2.1. Overview
- 16.2.2.2. Products
- 16.2.2.3. SWOT Analysis
- 16.2.2.4. Recent Developments
- 16.2.2.5. Financials (Based on Availability)
- 16.2.3 LANXESS
- 16.2.3.1. Overview
- 16.2.3.2. Products
- 16.2.3.3. SWOT Analysis
- 16.2.3.4. Recent Developments
- 16.2.3.5. Financials (Based on Availability)
- 16.2.4 BASF SE
- 16.2.4.1. Overview
- 16.2.4.2. Products
- 16.2.4.3. SWOT Analysis
- 16.2.4.4. Recent Developments
- 16.2.4.5. Financials (Based on Availability)
- 16.2.5 Alfa Aesar
- 16.2.5.1. Overview
- 16.2.5.2. Products
- 16.2.5.3. SWOT Analysis
- 16.2.5.4. Recent Developments
- 16.2.5.5. Financials (Based on Availability)
- 16.2.6 PENPET Petrochemical Trading GmbH
- 16.2.6.1. Overview
- 16.2.6.2. Products
- 16.2.6.3. SWOT Analysis
- 16.2.6.4. Recent Developments
- 16.2.6.5. Financials (Based on Availability)
- 16.2.7 JFE Chemical Corporation
- 16.2.7.1. Overview
- 16.2.7.2. Products
- 16.2.7.3. SWOT Analysis
- 16.2.7.4. Recent Developments
- 16.2.7.5. Financials (Based on Availability)
- 16.2.8 I G Petrochemicals Ltd
- 16.2.8.1. Overview
- 16.2.8.2. Products
- 16.2.8.3. SWOT Analysis
- 16.2.8.4. Recent Developments
- 16.2.8.5. Financials (Based on Availability)
- 16.2.9 Polynt SpA
- 16.2.9.1. Overview
- 16.2.9.2. Products
- 16.2.9.3. SWOT Analysis
- 16.2.9.4. Recent Developments
- 16.2.9.5. Financials (Based on Availability)
- 16.2.10 Thirumalai Chemicals Ltd
- 16.2.10.1. Overview
- 16.2.10.2. Products
- 16.2.10.3. SWOT Analysis
- 16.2.10.4. Recent Developments
- 16.2.10.5. Financials (Based on Availability)
- 16.2.11 Tokyo Chemical Industry
- 16.2.11.1. Overview
- 16.2.11.2. Products
- 16.2.11.3. SWOT Analysis
- 16.2.11.4. Recent Developments
- 16.2.11.5. Financials (Based on Availability)
- 16.2.12 S I Group Inc
- 16.2.12.1. Overview
- 16.2.12.2. Products
- 16.2.12.3. SWOT Analysis
- 16.2.12.4. Recent Developments
- 16.2.12.5. Financials (Based on Availability)
- 16.2.13 Koppers Inc
- 16.2.13.1. Overview
- 16.2.13.2. Products
- 16.2.13.3. SWOT Analysis
- 16.2.13.4. Recent Developments
- 16.2.13.5. Financials (Based on Availability)
- 16.2.14 Perstorp
- 16.2.14.1. Overview
- 16.2.14.2. Products
- 16.2.14.3. SWOT Analysis
- 16.2.14.4. Recent Developments
- 16.2.14.5. Financials (Based on Availability)
- 16.2.15 The Chemical Company
- 16.2.15.1. Overview
- 16.2.15.2. Products
- 16.2.15.3. SWOT Analysis
- 16.2.15.4. Recent Developments
- 16.2.15.5. Financials (Based on Availability)
- 16.2.1 KH Chemicals
List of Figures
- Figure 1: Global Phthalic Anhydride Derivatives Industry Revenue Breakdown (Million, %) by Region 2024 & 2032
- Figure 2: Global Phthalic Anhydride Derivatives Industry Volume Breakdown (K Tons, %) by Region 2024 & 2032
- Figure 3: North America Phthalic Anhydride Derivatives Industry Revenue (Million), by Country 2024 & 2032
- Figure 4: North America Phthalic Anhydride Derivatives Industry Volume (K Tons), by Country 2024 & 2032
- Figure 5: North America Phthalic Anhydride Derivatives Industry Revenue Share (%), by Country 2024 & 2032
- Figure 6: North America Phthalic Anhydride Derivatives Industry Volume Share (%), by Country 2024 & 2032
- Figure 7: Europe Phthalic Anhydride Derivatives Industry Revenue (Million), by Country 2024 & 2032
- Figure 8: Europe Phthalic Anhydride Derivatives Industry Volume (K Tons), by Country 2024 & 2032
- Figure 9: Europe Phthalic Anhydride Derivatives Industry Revenue Share (%), by Country 2024 & 2032
- Figure 10: Europe Phthalic Anhydride Derivatives Industry Volume Share (%), by Country 2024 & 2032
- Figure 11: Asia Pacific Phthalic Anhydride Derivatives Industry Revenue (Million), by Country 2024 & 2032
- Figure 12: Asia Pacific Phthalic Anhydride Derivatives Industry Volume (K Tons), by Country 2024 & 2032
- Figure 13: Asia Pacific Phthalic Anhydride Derivatives Industry Revenue Share (%), by Country 2024 & 2032
- Figure 14: Asia Pacific Phthalic Anhydride Derivatives Industry Volume Share (%), by Country 2024 & 2032
- Figure 15: South America Phthalic Anhydride Derivatives Industry Revenue (Million), by Country 2024 & 2032
- Figure 16: South America Phthalic Anhydride Derivatives Industry Volume (K Tons), by Country 2024 & 2032
- Figure 17: South America Phthalic Anhydride Derivatives Industry Revenue Share (%), by Country 2024 & 2032
- Figure 18: South America Phthalic Anhydride Derivatives Industry Volume Share (%), by Country 2024 & 2032
- Figure 19: MEA Phthalic Anhydride Derivatives Industry Revenue (Million), by Country 2024 & 2032
- Figure 20: MEA Phthalic Anhydride Derivatives Industry Volume (K Tons), by Country 2024 & 2032
- Figure 21: MEA Phthalic Anhydride Derivatives Industry Revenue Share (%), by Country 2024 & 2032
- Figure 22: MEA Phthalic Anhydride Derivatives Industry Volume Share (%), by Country 2024 & 2032
- Figure 23: Asia Pacific Phthalic Anhydride Derivatives Industry Revenue (Million), by Derivatives 2024 & 2032
- Figure 24: Asia Pacific Phthalic Anhydride Derivatives Industry Volume (K Tons), by Derivatives 2024 & 2032
- Figure 25: Asia Pacific Phthalic Anhydride Derivatives Industry Revenue Share (%), by Derivatives 2024 & 2032
- Figure 26: Asia Pacific Phthalic Anhydride Derivatives Industry Volume Share (%), by Derivatives 2024 & 2032
- Figure 27: Asia Pacific Phthalic Anhydride Derivatives Industry Revenue (Million), by End-user Industry 2024 & 2032
- Figure 28: Asia Pacific Phthalic Anhydride Derivatives Industry Volume (K Tons), by End-user Industry 2024 & 2032
- Figure 29: Asia Pacific Phthalic Anhydride Derivatives Industry Revenue Share (%), by End-user Industry 2024 & 2032
- Figure 30: Asia Pacific Phthalic Anhydride Derivatives Industry Volume Share (%), by End-user Industry 2024 & 2032
- Figure 31: Asia Pacific Phthalic Anhydride Derivatives Industry Revenue (Million), by Country 2024 & 2032
- Figure 32: Asia Pacific Phthalic Anhydride Derivatives Industry Volume (K Tons), by Country 2024 & 2032
- Figure 33: Asia Pacific Phthalic Anhydride Derivatives Industry Revenue Share (%), by Country 2024 & 2032
- Figure 34: Asia Pacific Phthalic Anhydride Derivatives Industry Volume Share (%), by Country 2024 & 2032
- Figure 35: North America Phthalic Anhydride Derivatives Industry Revenue (Million), by Derivatives 2024 & 2032
- Figure 36: North America Phthalic Anhydride Derivatives Industry Volume (K Tons), by Derivatives 2024 & 2032
- Figure 37: North America Phthalic Anhydride Derivatives Industry Revenue Share (%), by Derivatives 2024 & 2032
- Figure 38: North America Phthalic Anhydride Derivatives Industry Volume Share (%), by Derivatives 2024 & 2032
- Figure 39: North America Phthalic Anhydride Derivatives Industry Revenue (Million), by End-user Industry 2024 & 2032
- Figure 40: North America Phthalic Anhydride Derivatives Industry Volume (K Tons), by End-user Industry 2024 & 2032
- Figure 41: North America Phthalic Anhydride Derivatives Industry Revenue Share (%), by End-user Industry 2024 & 2032
- Figure 42: North America Phthalic Anhydride Derivatives Industry Volume Share (%), by End-user Industry 2024 & 2032
- Figure 43: North America Phthalic Anhydride Derivatives Industry Revenue (Million), by Country 2024 & 2032
- Figure 44: North America Phthalic Anhydride Derivatives Industry Volume (K Tons), by Country 2024 & 2032
- Figure 45: North America Phthalic Anhydride Derivatives Industry Revenue Share (%), by Country 2024 & 2032
- Figure 46: North America Phthalic Anhydride Derivatives Industry Volume Share (%), by Country 2024 & 2032
- Figure 47: Europe Phthalic Anhydride Derivatives Industry Revenue (Million), by Derivatives 2024 & 2032
- Figure 48: Europe Phthalic Anhydride Derivatives Industry Volume (K Tons), by Derivatives 2024 & 2032
- Figure 49: Europe Phthalic Anhydride Derivatives Industry Revenue Share (%), by Derivatives 2024 & 2032
- Figure 50: Europe Phthalic Anhydride Derivatives Industry Volume Share (%), by Derivatives 2024 & 2032
- Figure 51: Europe Phthalic Anhydride Derivatives Industry Revenue (Million), by End-user Industry 2024 & 2032
- Figure 52: Europe Phthalic Anhydride Derivatives Industry Volume (K Tons), by End-user Industry 2024 & 2032
- Figure 53: Europe Phthalic Anhydride Derivatives Industry Revenue Share (%), by End-user Industry 2024 & 2032
- Figure 54: Europe Phthalic Anhydride Derivatives Industry Volume Share (%), by End-user Industry 2024 & 2032
- Figure 55: Europe Phthalic Anhydride Derivatives Industry Revenue (Million), by Country 2024 & 2032
- Figure 56: Europe Phthalic Anhydride Derivatives Industry Volume (K Tons), by Country 2024 & 2032
- Figure 57: Europe Phthalic Anhydride Derivatives Industry Revenue Share (%), by Country 2024 & 2032
- Figure 58: Europe Phthalic Anhydride Derivatives Industry Volume Share (%), by Country 2024 & 2032
- Figure 59: South America Phthalic Anhydride Derivatives Industry Revenue (Million), by Derivatives 2024 & 2032
- Figure 60: South America Phthalic Anhydride Derivatives Industry Volume (K Tons), by Derivatives 2024 & 2032
- Figure 61: South America Phthalic Anhydride Derivatives Industry Revenue Share (%), by Derivatives 2024 & 2032
- Figure 62: South America Phthalic Anhydride Derivatives Industry Volume Share (%), by Derivatives 2024 & 2032
- Figure 63: South America Phthalic Anhydride Derivatives Industry Revenue (Million), by End-user Industry 2024 & 2032
- Figure 64: South America Phthalic Anhydride Derivatives Industry Volume (K Tons), by End-user Industry 2024 & 2032
- Figure 65: South America Phthalic Anhydride Derivatives Industry Revenue Share (%), by End-user Industry 2024 & 2032
- Figure 66: South America Phthalic Anhydride Derivatives Industry Volume Share (%), by End-user Industry 2024 & 2032
- Figure 67: South America Phthalic Anhydride Derivatives Industry Revenue (Million), by Country 2024 & 2032
- Figure 68: South America Phthalic Anhydride Derivatives Industry Volume (K Tons), by Country 2024 & 2032
- Figure 69: South America Phthalic Anhydride Derivatives Industry Revenue Share (%), by Country 2024 & 2032
- Figure 70: South America Phthalic Anhydride Derivatives Industry Volume Share (%), by Country 2024 & 2032
- Figure 71: Middle East and Africa Phthalic Anhydride Derivatives Industry Revenue (Million), by Derivatives 2024 & 2032
- Figure 72: Middle East and Africa Phthalic Anhydride Derivatives Industry Volume (K Tons), by Derivatives 2024 & 2032
- Figure 73: Middle East and Africa Phthalic Anhydride Derivatives Industry Revenue Share (%), by Derivatives 2024 & 2032
- Figure 74: Middle East and Africa Phthalic Anhydride Derivatives Industry Volume Share (%), by Derivatives 2024 & 2032
- Figure 75: Middle East and Africa Phthalic Anhydride Derivatives Industry Revenue (Million), by End-user Industry 2024 & 2032
- Figure 76: Middle East and Africa Phthalic Anhydride Derivatives Industry Volume (K Tons), by End-user Industry 2024 & 2032
- Figure 77: Middle East and Africa Phthalic Anhydride Derivatives Industry Revenue Share (%), by End-user Industry 2024 & 2032
- Figure 78: Middle East and Africa Phthalic Anhydride Derivatives Industry Volume Share (%), by End-user Industry 2024 & 2032
- Figure 79: Middle East and Africa Phthalic Anhydride Derivatives Industry Revenue (Million), by Country 2024 & 2032
- Figure 80: Middle East and Africa Phthalic Anhydride Derivatives Industry Volume (K Tons), by Country 2024 & 2032
- Figure 81: Middle East and Africa Phthalic Anhydride Derivatives Industry Revenue Share (%), by Country 2024 & 2032
- Figure 82: Middle East and Africa Phthalic Anhydride Derivatives Industry Volume Share (%), by Country 2024 & 2032
List of Tables
- Table 1: Global Phthalic Anhydride Derivatives Industry Revenue Million Forecast, by Region 2019 & 2032
- Table 2: Global Phthalic Anhydride Derivatives Industry Volume K Tons Forecast, by Region 2019 & 2032
- Table 3: Global Phthalic Anhydride Derivatives Industry Revenue Million Forecast, by Derivatives 2019 & 2032
- Table 4: Global Phthalic Anhydride Derivatives Industry Volume K Tons Forecast, by Derivatives 2019 & 2032
- Table 5: Global Phthalic Anhydride Derivatives Industry Revenue Million Forecast, by End-user Industry 2019 & 2032
- Table 6: Global Phthalic Anhydride Derivatives Industry Volume K Tons Forecast, by End-user Industry 2019 & 2032
- Table 7: Global Phthalic Anhydride Derivatives Industry Revenue Million Forecast, by Region 2019 & 2032
- Table 8: Global Phthalic Anhydride Derivatives Industry Volume K Tons Forecast, by Region 2019 & 2032
- Table 9: Global Phthalic Anhydride Derivatives Industry Revenue Million Forecast, by Country 2019 & 2032
- Table 10: Global Phthalic Anhydride Derivatives Industry Volume K Tons Forecast, by Country 2019 & 2032
- Table 11: United States Phthalic Anhydride Derivatives Industry Revenue (Million) Forecast, by Application 2019 & 2032
- Table 12: United States Phthalic Anhydride Derivatives Industry Volume (K Tons) Forecast, by Application 2019 & 2032
- Table 13: Canada Phthalic Anhydride Derivatives Industry Revenue (Million) Forecast, by Application 2019 & 2032
- Table 14: Canada Phthalic Anhydride Derivatives Industry Volume (K Tons) Forecast, by Application 2019 & 2032
- Table 15: Mexico Phthalic Anhydride Derivatives Industry Revenue (Million) Forecast, by Application 2019 & 2032
- Table 16: Mexico Phthalic Anhydride Derivatives Industry Volume (K Tons) Forecast, by Application 2019 & 2032
- Table 17: Global Phthalic Anhydride Derivatives Industry Revenue Million Forecast, by Country 2019 & 2032
- Table 18: Global Phthalic Anhydride Derivatives Industry Volume K Tons Forecast, by Country 2019 & 2032
- Table 19: Germany Phthalic Anhydride Derivatives Industry Revenue (Million) Forecast, by Application 2019 & 2032
- Table 20: Germany Phthalic Anhydride Derivatives Industry Volume (K Tons) Forecast, by Application 2019 & 2032
- Table 21: France Phthalic Anhydride Derivatives Industry Revenue (Million) Forecast, by Application 2019 & 2032
- Table 22: France Phthalic Anhydride Derivatives Industry Volume (K Tons) Forecast, by Application 2019 & 2032
- Table 23: Italy Phthalic Anhydride Derivatives Industry Revenue (Million) Forecast, by Application 2019 & 2032
- Table 24: Italy Phthalic Anhydride Derivatives Industry Volume (K Tons) Forecast, by Application 2019 & 2032
- Table 25: United Kingdom Phthalic Anhydride Derivatives Industry Revenue (Million) Forecast, by Application 2019 & 2032
- Table 26: United Kingdom Phthalic Anhydride Derivatives Industry Volume (K Tons) Forecast, by Application 2019 & 2032
- Table 27: Netherlands Phthalic Anhydride Derivatives Industry Revenue (Million) Forecast, by Application 2019 & 2032
- Table 28: Netherlands Phthalic Anhydride Derivatives Industry Volume (K Tons) Forecast, by Application 2019 & 2032
- Table 29: Rest of Europe Phthalic Anhydride Derivatives Industry Revenue (Million) Forecast, by Application 2019 & 2032
- Table 30: Rest of Europe Phthalic Anhydride Derivatives Industry Volume (K Tons) Forecast, by Application 2019 & 2032
- Table 31: Global Phthalic Anhydride Derivatives Industry Revenue Million Forecast, by Country 2019 & 2032
- Table 32: Global Phthalic Anhydride Derivatives Industry Volume K Tons Forecast, by Country 2019 & 2032
- Table 33: China Phthalic Anhydride Derivatives Industry Revenue (Million) Forecast, by Application 2019 & 2032
- Table 34: China Phthalic Anhydride Derivatives Industry Volume (K Tons) Forecast, by Application 2019 & 2032
- Table 35: Japan Phthalic Anhydride Derivatives Industry Revenue (Million) Forecast, by Application 2019 & 2032
- Table 36: Japan Phthalic Anhydride Derivatives Industry Volume (K Tons) Forecast, by Application 2019 & 2032
- Table 37: India Phthalic Anhydride Derivatives Industry Revenue (Million) Forecast, by Application 2019 & 2032
- Table 38: India Phthalic Anhydride Derivatives Industry Volume (K Tons) Forecast, by Application 2019 & 2032
- Table 39: South Korea Phthalic Anhydride Derivatives Industry Revenue (Million) Forecast, by Application 2019 & 2032
- Table 40: South Korea Phthalic Anhydride Derivatives Industry Volume (K Tons) Forecast, by Application 2019 & 2032
- Table 41: Taiwan Phthalic Anhydride Derivatives Industry Revenue (Million) Forecast, by Application 2019 & 2032
- Table 42: Taiwan Phthalic Anhydride Derivatives Industry Volume (K Tons) Forecast, by Application 2019 & 2032
- Table 43: Australia Phthalic Anhydride Derivatives Industry Revenue (Million) Forecast, by Application 2019 & 2032
- Table 44: Australia Phthalic Anhydride Derivatives Industry Volume (K Tons) Forecast, by Application 2019 & 2032
- Table 45: Rest of Asia-Pacific Phthalic Anhydride Derivatives Industry Revenue (Million) Forecast, by Application 2019 & 2032
- Table 46: Rest of Asia-Pacific Phthalic Anhydride Derivatives Industry Volume (K Tons) Forecast, by Application 2019 & 2032
- Table 47: Global Phthalic Anhydride Derivatives Industry Revenue Million Forecast, by Country 2019 & 2032
- Table 48: Global Phthalic Anhydride Derivatives Industry Volume K Tons Forecast, by Country 2019 & 2032
- Table 49: Brazil Phthalic Anhydride Derivatives Industry Revenue (Million) Forecast, by Application 2019 & 2032
- Table 50: Brazil Phthalic Anhydride Derivatives Industry Volume (K Tons) Forecast, by Application 2019 & 2032
- Table 51: Argentina Phthalic Anhydride Derivatives Industry Revenue (Million) Forecast, by Application 2019 & 2032
- Table 52: Argentina Phthalic Anhydride Derivatives Industry Volume (K Tons) Forecast, by Application 2019 & 2032
- Table 53: Rest of South America Phthalic Anhydride Derivatives Industry Revenue (Million) Forecast, by Application 2019 & 2032
- Table 54: Rest of South America Phthalic Anhydride Derivatives Industry Volume (K Tons) Forecast, by Application 2019 & 2032
- Table 55: Global Phthalic Anhydride Derivatives Industry Revenue Million Forecast, by Country 2019 & 2032
- Table 56: Global Phthalic Anhydride Derivatives Industry Volume K Tons Forecast, by Country 2019 & 2032
- Table 57: Middle East Phthalic Anhydride Derivatives Industry Revenue (Million) Forecast, by Application 2019 & 2032
- Table 58: Middle East Phthalic Anhydride Derivatives Industry Volume (K Tons) Forecast, by Application 2019 & 2032
- Table 59: Africa Phthalic Anhydride Derivatives Industry Revenue (Million) Forecast, by Application 2019 & 2032
- Table 60: Africa Phthalic Anhydride Derivatives Industry Volume (K Tons) Forecast, by Application 2019 & 2032
- Table 61: Global Phthalic Anhydride Derivatives Industry Revenue Million Forecast, by Derivatives 2019 & 2032
- Table 62: Global Phthalic Anhydride Derivatives Industry Volume K Tons Forecast, by Derivatives 2019 & 2032
- Table 63: Global Phthalic Anhydride Derivatives Industry Revenue Million Forecast, by End-user Industry 2019 & 2032
- Table 64: Global Phthalic Anhydride Derivatives Industry Volume K Tons Forecast, by End-user Industry 2019 & 2032
- Table 65: Global Phthalic Anhydride Derivatives Industry Revenue Million Forecast, by Country 2019 & 2032
- Table 66: Global Phthalic Anhydride Derivatives Industry Volume K Tons Forecast, by Country 2019 & 2032
- Table 67: China Phthalic Anhydride Derivatives Industry Revenue (Million) Forecast, by Application 2019 & 2032
- Table 68: China Phthalic Anhydride Derivatives Industry Volume (K Tons) Forecast, by Application 2019 & 2032
- Table 69: India Phthalic Anhydride Derivatives Industry Revenue (Million) Forecast, by Application 2019 & 2032
- Table 70: India Phthalic Anhydride Derivatives Industry Volume (K Tons) Forecast, by Application 2019 & 2032
- Table 71: Japan Phthalic Anhydride Derivatives Industry Revenue (Million) Forecast, by Application 2019 & 2032
- Table 72: Japan Phthalic Anhydride Derivatives Industry Volume (K Tons) Forecast, by Application 2019 & 2032
- Table 73: South Korea Phthalic Anhydride Derivatives Industry Revenue (Million) Forecast, by Application 2019 & 2032
- Table 74: South Korea Phthalic Anhydride Derivatives Industry Volume (K Tons) Forecast, by Application 2019 & 2032
- Table 75: Rest of Asia Pacific Phthalic Anhydride Derivatives Industry Revenue (Million) Forecast, by Application 2019 & 2032
- Table 76: Rest of Asia Pacific Phthalic Anhydride Derivatives Industry Volume (K Tons) Forecast, by Application 2019 & 2032
- Table 77: Global Phthalic Anhydride Derivatives Industry Revenue Million Forecast, by Derivatives 2019 & 2032
- Table 78: Global Phthalic Anhydride Derivatives Industry Volume K Tons Forecast, by Derivatives 2019 & 2032
- Table 79: Global Phthalic Anhydride Derivatives Industry Revenue Million Forecast, by End-user Industry 2019 & 2032
- Table 80: Global Phthalic Anhydride Derivatives Industry Volume K Tons Forecast, by End-user Industry 2019 & 2032
- Table 81: Global Phthalic Anhydride Derivatives Industry Revenue Million Forecast, by Country 2019 & 2032
- Table 82: Global Phthalic Anhydride Derivatives Industry Volume K Tons Forecast, by Country 2019 & 2032
- Table 83: United States Phthalic Anhydride Derivatives Industry Revenue (Million) Forecast, by Application 2019 & 2032
- Table 84: United States Phthalic Anhydride Derivatives Industry Volume (K Tons) Forecast, by Application 2019 & 2032
- Table 85: Canada Phthalic Anhydride Derivatives Industry Revenue (Million) Forecast, by Application 2019 & 2032
- Table 86: Canada Phthalic Anhydride Derivatives Industry Volume (K Tons) Forecast, by Application 2019 & 2032
- Table 87: Mexico Phthalic Anhydride Derivatives Industry Revenue (Million) Forecast, by Application 2019 & 2032
- Table 88: Mexico Phthalic Anhydride Derivatives Industry Volume (K Tons) Forecast, by Application 2019 & 2032
- Table 89: Global Phthalic Anhydride Derivatives Industry Revenue Million Forecast, by Derivatives 2019 & 2032
- Table 90: Global Phthalic Anhydride Derivatives Industry Volume K Tons Forecast, by Derivatives 2019 & 2032
- Table 91: Global Phthalic Anhydride Derivatives Industry Revenue Million Forecast, by End-user Industry 2019 & 2032
- Table 92: Global Phthalic Anhydride Derivatives Industry Volume K Tons Forecast, by End-user Industry 2019 & 2032
- Table 93: Global Phthalic Anhydride Derivatives Industry Revenue Million Forecast, by Country 2019 & 2032
- Table 94: Global Phthalic Anhydride Derivatives Industry Volume K Tons Forecast, by Country 2019 & 2032
- Table 95: Germany Phthalic Anhydride Derivatives Industry Revenue (Million) Forecast, by Application 2019 & 2032
- Table 96: Germany Phthalic Anhydride Derivatives Industry Volume (K Tons) Forecast, by Application 2019 & 2032
- Table 97: United Kingdom Phthalic Anhydride Derivatives Industry Revenue (Million) Forecast, by Application 2019 & 2032
- Table 98: United Kingdom Phthalic Anhydride Derivatives Industry Volume (K Tons) Forecast, by Application 2019 & 2032
- Table 99: France Phthalic Anhydride Derivatives Industry Revenue (Million) Forecast, by Application 2019 & 2032
- Table 100: France Phthalic Anhydride Derivatives Industry Volume (K Tons) Forecast, by Application 2019 & 2032
- Table 101: Italy Phthalic Anhydride Derivatives Industry Revenue (Million) Forecast, by Application 2019 & 2032
- Table 102: Italy Phthalic Anhydride Derivatives Industry Volume (K Tons) Forecast, by Application 2019 & 2032
- Table 103: Rest of Europe Phthalic Anhydride Derivatives Industry Revenue (Million) Forecast, by Application 2019 & 2032
- Table 104: Rest of Europe Phthalic Anhydride Derivatives Industry Volume (K Tons) Forecast, by Application 2019 & 2032
- Table 105: Global Phthalic Anhydride Derivatives Industry Revenue Million Forecast, by Derivatives 2019 & 2032
- Table 106: Global Phthalic Anhydride Derivatives Industry Volume K Tons Forecast, by Derivatives 2019 & 2032
- Table 107: Global Phthalic Anhydride Derivatives Industry Revenue Million Forecast, by End-user Industry 2019 & 2032
- Table 108: Global Phthalic Anhydride Derivatives Industry Volume K Tons Forecast, by End-user Industry 2019 & 2032
- Table 109: Global Phthalic Anhydride Derivatives Industry Revenue Million Forecast, by Country 2019 & 2032
- Table 110: Global Phthalic Anhydride Derivatives Industry Volume K Tons Forecast, by Country 2019 & 2032
- Table 111: Brazil Phthalic Anhydride Derivatives Industry Revenue (Million) Forecast, by Application 2019 & 2032
- Table 112: Brazil Phthalic Anhydride Derivatives Industry Volume (K Tons) Forecast, by Application 2019 & 2032
- Table 113: Argentina Phthalic Anhydride Derivatives Industry Revenue (Million) Forecast, by Application 2019 & 2032
- Table 114: Argentina Phthalic Anhydride Derivatives Industry Volume (K Tons) Forecast, by Application 2019 & 2032
- Table 115: Rest of South America Phthalic Anhydride Derivatives Industry Revenue (Million) Forecast, by Application 2019 & 2032
- Table 116: Rest of South America Phthalic Anhydride Derivatives Industry Volume (K Tons) Forecast, by Application 2019 & 2032
- Table 117: Global Phthalic Anhydride Derivatives Industry Revenue Million Forecast, by Derivatives 2019 & 2032
- Table 118: Global Phthalic Anhydride Derivatives Industry Volume K Tons Forecast, by Derivatives 2019 & 2032
- Table 119: Global Phthalic Anhydride Derivatives Industry Revenue Million Forecast, by End-user Industry 2019 & 2032
- Table 120: Global Phthalic Anhydride Derivatives Industry Volume K Tons Forecast, by End-user Industry 2019 & 2032
- Table 121: Global Phthalic Anhydride Derivatives Industry Revenue Million Forecast, by Country 2019 & 2032
- Table 122: Global Phthalic Anhydride Derivatives Industry Volume K Tons Forecast, by Country 2019 & 2032
- Table 123: Saudi Arabia Phthalic Anhydride Derivatives Industry Revenue (Million) Forecast, by Application 2019 & 2032
- Table 124: Saudi Arabia Phthalic Anhydride Derivatives Industry Volume (K Tons) Forecast, by Application 2019 & 2032
- Table 125: South Africa Phthalic Anhydride Derivatives Industry Revenue (Million) Forecast, by Application 2019 & 2032
- Table 126: South Africa Phthalic Anhydride Derivatives Industry Volume (K Tons) Forecast, by Application 2019 & 2032
- Table 127: Rest of Middle East and Africa Phthalic Anhydride Derivatives Industry Revenue (Million) Forecast, by Application 2019 & 2032
- Table 128: Rest of Middle East and Africa Phthalic Anhydride Derivatives Industry Volume (K Tons) Forecast, by Application 2019 & 2032
Frequently Asked Questions
1. What is the projected Compound Annual Growth Rate (CAGR) of the Phthalic Anhydride Derivatives Industry?
The projected CAGR is approximately > 4.40%.
2. Which companies are prominent players in the Phthalic Anhydride Derivatives Industry?
Key companies in the market include KH Chemicals, Stepan Company, LANXESS, BASF SE, Alfa Aesar, PENPET Petrochemical Trading GmbH, JFE Chemical Corporation, I G Petrochemicals Ltd, Polynt SpA, Thirumalai Chemicals Ltd, Tokyo Chemical Industry, S I Group Inc, Koppers Inc, Perstorp, The Chemical Company.
3. What are the main segments of the Phthalic Anhydride Derivatives Industry?
The market segments include Derivatives, End-user Industry.
4. Can you provide details about the market size?
The market size is estimated to be USD XX Million as of 2022.
5. What are some drivers contributing to market growth?
; Increasing Consumption of Plastics in Construction Sector; Other Drivers.
6. What are the notable trends driving market growth?
Construction Sector to Dominate the Market.
7. Are there any restraints impacting market growth?
; Toxicity related to Phthalic Anhydride; Unfavorable Conditions Arising Due to COVID-19 Outbreak.
8. Can you provide examples of recent developments in the market?
N/A
9. What pricing options are available for accessing the report?
Pricing options include single-user, multi-user, and enterprise licenses priced at USD 4750, USD 5250, and USD 8750 respectively.
10. Is the market size provided in terms of value or volume?
The market size is provided in terms of value, measured in Million and volume, measured in K Tons.
11. Are there any specific market keywords associated with the report?
Yes, the market keyword associated with the report is "Phthalic Anhydride Derivatives Industry," which aids in identifying and referencing the specific market segment covered.
12. How do I determine which pricing option suits my needs best?
The pricing options vary based on user requirements and access needs. Individual users may opt for single-user licenses, while businesses requiring broader access may choose multi-user or enterprise licenses for cost-effective access to the report.
13. Are there any additional resources or data provided in the Phthalic Anhydride Derivatives Industry report?
While the report offers comprehensive insights, it's advisable to review the specific contents or supplementary materials provided to ascertain if additional resources or data are available.
14. How can I stay updated on further developments or reports in the Phthalic Anhydride Derivatives Industry?
To stay informed about further developments, trends, and reports in the Phthalic Anhydride Derivatives Industry, consider subscribing to industry newsletters, following relevant companies and organizations, or regularly checking reputable industry news sources and publications.
Methodology
Step 1 - Identification of Relevant Samples Size from Population Database


Step 2 - Approaches for Defining Global Market Size (Value, Volume* & Price*)

Note*: In applicable scenarios
Step 3 - Data Sources
Primary Research
- Web Analytics
- Survey Reports
- Research Institute
- Latest Research Reports
- Opinion Leaders
Secondary Research
- Annual Reports
- White Paper
- Latest Press Release
- Industry Association
- Paid Database
- Investor Presentations

Step 4 - Data Triangulation
Involves using different sources of information in order to increase the validity of a study
These sources are likely to be stakeholders in a program - participants, other researchers, program staff, other community members, and so on.
Then we put all data in single framework & apply various statistical tools to find out the dynamic on the market.
During the analysis stage, feedback from the stakeholder groups would be compared to determine areas of agreement as well as areas of divergence
