

Key Insights
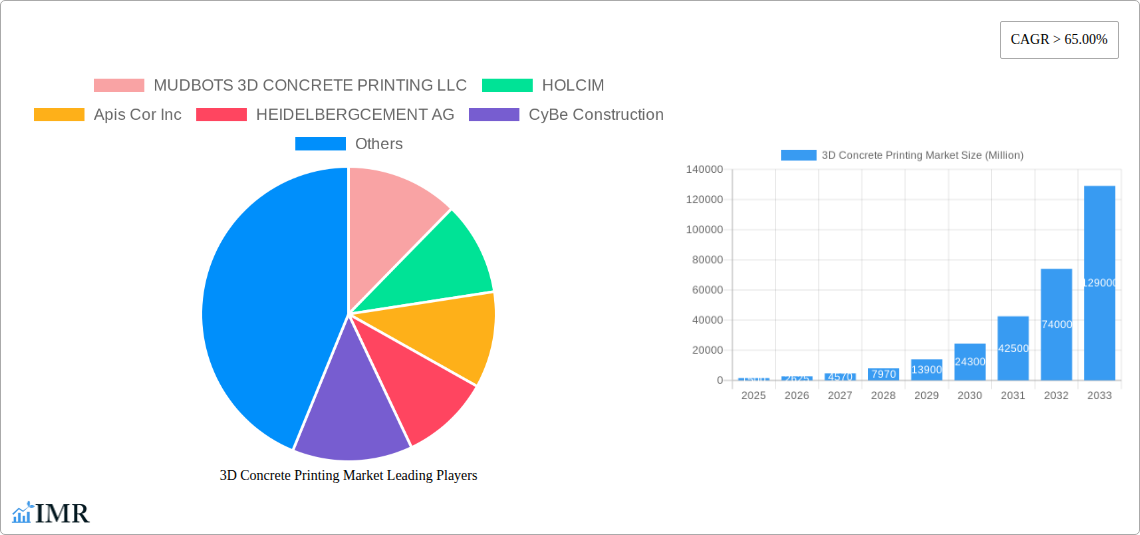
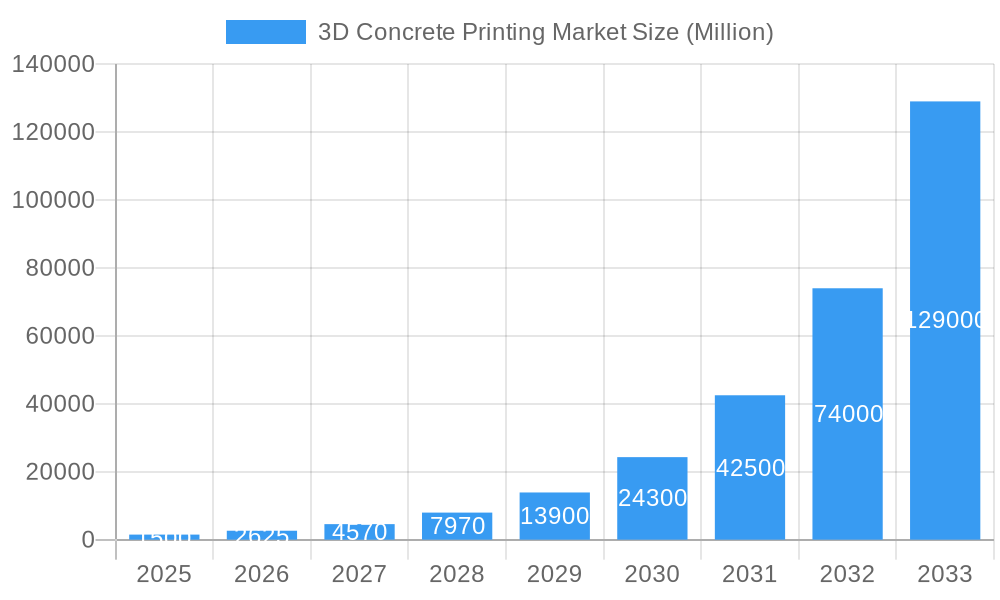
The 3D concrete printing market is experiencing explosive growth, projected to maintain a CAGR exceeding 65% from 2025 to 2033. This surge is driven by several key factors. Firstly, the construction industry's increasing demand for faster, more efficient, and sustainable building methods is fueling adoption. 3D concrete printing offers significant advantages in this regard, reducing labor costs, material waste, and construction timelines. Secondly, technological advancements in printing technology, materials science, and software are continuously improving the precision, speed, and complexity of structures that can be created. This leads to increased design flexibility and the potential to create intricate and innovative architectural designs previously impossible with traditional methods. Furthermore, the growing focus on sustainable construction practices is boosting the market, as 3D printing minimizes material waste and allows for the utilization of recycled materials, contributing to reduced environmental impact. The market is segmented across various end-use sectors, including residential, commercial, infrastructural, and architectural projects, with ready-mix, high-performance, precast, and shotcrete concrete types further diversifying the applications. Major players like Holcim, HeidelbergCement, and ICON are actively shaping the market through technological innovation, strategic partnerships, and expanding geographical reach.
3D Concrete Printing Market Market Size (In Billion)
The geographical distribution of the market is geographically diverse, with North America, Europe, and Asia-Pacific currently leading the adoption of 3D concrete printing. However, significant growth potential exists in emerging economies across Asia-Pacific, South America, and the Middle East and Africa, as infrastructure development accelerates and awareness of 3D printing's benefits increases. While challenges remain, such as the initial high investment costs and the need for skilled labor, these are expected to be mitigated by ongoing technological advancements and increasing economies of scale. The market's robust growth trajectory is expected to continue, driven by increasing acceptance, technological maturity, and expanding applications across various sectors and regions. The continuous innovation and collaboration among industry players are poised to further accelerate the market's expansion in the coming years.
3D Concrete Printing Market Company Market Share
3D Concrete Printing Market: A Comprehensive Report (2019-2033)
This in-depth report provides a comprehensive analysis of the 3D Concrete Printing market, encompassing market dynamics, growth trends, regional dominance, product landscape, key players, and future outlook. The study period covers 2019-2033, with 2025 as the base and estimated year. This report is invaluable for industry professionals, investors, and strategists seeking to understand and capitalize on the burgeoning opportunities within this transformative sector. The market is segmented by end-use sector (Residential, Commercial, Infrastructural, Architectural) and concrete type (Ready-mix, High Performance, Precast, Shotcrete). The total market size in 2025 is estimated at xx Million Units and is projected to reach xx Million Units by 2033.
3D Concrete Printing Market Dynamics & Structure
The 3D Concrete Printing market is characterized by moderate concentration, with key players like Holcim, ICON Technology Inc, and COBOD holding significant market share. Technological innovation, particularly in material science and robotic automation, is a primary growth driver. Regulatory frameworks, while still evolving, are increasingly supportive of sustainable and efficient construction methods. Competitive substitutes, primarily traditional construction techniques, face increasing pressure due to the cost and time efficiencies offered by 3D printing. The market exhibits strong M&A activity, as evidenced by Holcim’s investment in COBOD (October 2022).
- Market Concentration: Moderately concentrated, with a few major players dominating. Holcim and ICON hold approximately xx% and xx% market share respectively (2025 estimates).
- Technological Innovation: Focus on material optimization for strength, durability, and sustainability; advancements in robotic precision and printing speeds.
- Regulatory Landscape: Growing adoption of supportive policies promoting sustainable construction and digitalization.
- Competitive Substitutes: Traditional construction methods face increasing competition due to 3D printing's efficiency.
- End-User Demographics: Primarily driven by large-scale construction firms, government agencies, and increasingly, private residential developers.
- M&A Activity: Significant increase in mergers and acquisitions in recent years, with xx major deals recorded between 2019-2024.
3D Concrete Printing Market Growth Trends & Insights
The 3D Concrete Printing market is experiencing exponential growth, driven by increasing demand for affordable, sustainable, and efficient construction solutions. Adoption rates are accelerating across various end-use sectors, particularly in residential and infrastructural projects. Technological advancements, like the development of high-performance concrete mixes and automated printing systems, are significantly contributing to market expansion. Consumer behavior is shifting towards a preference for customized and sustainable construction solutions.
The market exhibited a CAGR of xx% during the historical period (2019-2024) and is projected to maintain a CAGR of xx% during the forecast period (2025-2033). Market penetration is expected to increase from xx% in 2025 to xx% by 2033, driven by factors like declining printing costs and increasing awareness of the technology's benefits. Disruptive innovations, such as the development of self-healing concrete and bio-printed structures, further fuel the market's rapid expansion.
Dominant Regions, Countries, or Segments in 3D Concrete Printing Market
The North American region currently dominates the 3D Concrete Printing market, followed by Europe. Within North America, the US leads due to significant government investment in infrastructure projects and the presence of key players like ICON. The residential and infrastructural segments are the fastest-growing end-use sectors, driven by the need for affordable housing and efficient infrastructure development. High-performance concrete is gaining traction due to its superior strength and durability.
Key Drivers:
- North America: Strong government support for infrastructure development, presence of key technology innovators.
- Europe: Focus on sustainable construction practices and adoption of innovative building technologies.
- Residential Sector: Demand for affordable housing, faster construction times, and design flexibility.
- Infrastructural Sector: Need for efficient construction of roads, bridges, and other large-scale projects.
- High-Performance Concrete: Superior strength, durability, and sustainability compared to traditional concrete.
Dominance Factors: Early adoption by government agencies and large construction firms, coupled with significant technological advancements, is shaping the current market leadership.
3D Concrete Printing Market Product Landscape
The 3D concrete printing market offers a range of products, including large-scale construction printers, specialized concrete mixes, and software solutions for design and construction management. These products are characterized by high precision, speed, and efficiency compared to traditional methods. Recent innovations focus on improving material sustainability, reducing printing time, and enhancing the structural integrity of 3D-printed concrete structures. Unique selling propositions include cost-effectiveness, design freedom, and reduced construction time and waste. Technological advancements continually enhance the precision, speed, and sustainability of 3D concrete printing processes.
Key Drivers, Barriers & Challenges in 3D Concrete Printing Market
Key Drivers:
- Increasing demand for sustainable and efficient construction practices.
- Growing government investments in infrastructure development.
- Technological advancements leading to higher precision and efficiency.
- Cost reductions in 3D printing technology making it more accessible.
Key Challenges & Restraints:
- High initial investment costs associated with 3D printing equipment and materials.
- Skill gaps and limited workforce training in 3D concrete printing technology.
- Regulatory hurdles and building code compliance issues.
- Potential supply chain disruptions impacting material availability. The impact is estimated to be a xx% reduction in market growth in 2026.
Emerging Opportunities in 3D Concrete Printing Market
- Expansion into new markets, particularly in developing countries with high construction demand.
- Development of innovative applications, such as the printing of complex architectural designs and disaster relief shelters.
- Growing adoption of 3D concrete printing in prefabrication and modular construction.
- Exploration of sustainable and recycled materials for 3D concrete printing.
Growth Accelerators in the 3D Concrete Printing Market Industry
Technological breakthroughs in materials science and robotic automation are key growth catalysts. Strategic partnerships between technology providers, construction companies, and government agencies are accelerating market penetration. Expanding into new geographic markets and developing innovative applications will further fuel long-term growth. The establishment of industry standards and best practices will enhance confidence and adoption.
Key Players Shaping the 3D Concrete Printing Market Market
- MUDBOTS 3D CONCRETE PRINTING LLC
- HOLCIM
- Apis Cor Inc
- HEIDELBERGCEMENT AG
- CyBe Construction
- ICON Technology Inc
- WASP Srl - Via Castelletto
- XtreeE
- Sika AG
- Skanska
- Yingchuang Building Technique (Shanghai) Co Ltd (WinSun)
- COBOD
Notable Milestones in 3D Concrete Printing Market Sector
- October 2022: Holcim announced its investment in COBOD International, advancing 3D printing materials, robotics, and automation. Successful collaborations included 3D-printed windmill tower bases with GE, the world's first 3D-printed school in Malawi, and Africa's largest 3D-printed affordable housing project in Kenya.
- April 2022: The US Army partnered with ICON to build the largest 3D-printed buildings in the West, including barracks at Fort Bliss, Texas, using ICON's Vulcan printer.
In-Depth 3D Concrete Printing Market Market Outlook
The 3D Concrete Printing market is poised for sustained growth, driven by technological advancements, increasing demand for sustainable construction solutions, and supportive government policies. Strategic partnerships and expansion into new geographic markets will further unlock the market's substantial future potential. The focus on cost reduction, material innovation, and improved efficiency will be crucial for realizing the full transformative potential of this technology across the construction industry.
3D Concrete Printing Market Segmentation
-
1. Concrete Type
- 1.1. Ready-mix
- 1.2. High Performance
- 1.3. Precast
- 1.4. Shotcrete
-
2. End-use Sector
- 2.1. Residential
- 2.2. Commercial
- 2.3. Infrastructural
- 2.4. Architectural
3D Concrete Printing Market Segmentation By Geography
-
1. Asia Pacific
- 1.1. China
- 1.2. India
- 1.3. Japan
- 1.4. South Korea
- 1.5. ASEAN Countries
- 1.6. Rest of Asia Pacific
-
2. North America
- 2.1. United States
- 2.2. Canada
- 2.3. Mexico
-
3. Europe
- 3.1. Germany
- 3.2. United Kingdom
- 3.3. France
- 3.4. Nordic Countries
- 3.5. The Netherlands
- 3.6. Rest of Europe
-
4. South America
- 4.1. Brazil
- 4.2. Argentina
- 4.3. Rest of South America
-
5. Middle East and Africa
- 5.1. GCC Countries
- 5.2. South Africa
- 5.3. Rest of Middle East and Africa
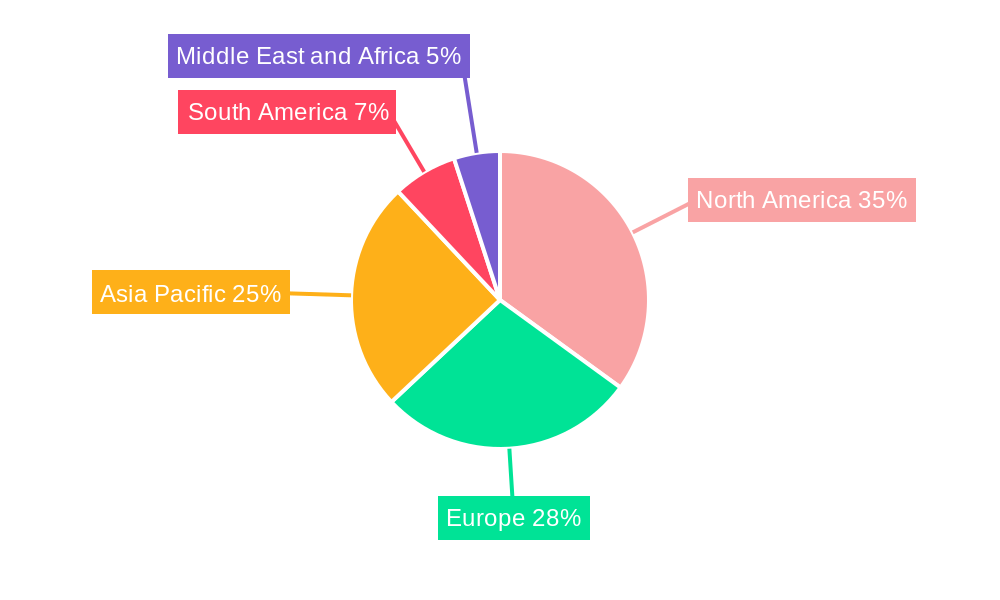
3D Concrete Printing Market Regional Market Share
Geographic Coverage of 3D Concrete Printing Market
3D Concrete Printing Market REPORT HIGHLIGHTS
| Aspects | Details |
|---|---|
| Study Period | 2020-2034 |
| Base Year | 2025 |
| Estimated Year | 2026 |
| Forecast Period | 2026-2034 |
| Historical Period | 2020-2025 |
| Growth Rate | CAGR of 45.86% from 2020-2034 |
| Segmentation |
|
Table of Contents
- 1. Introduction
- 1.1. Research Scope
- 1.2. Market Segmentation
- 1.3. Research Objective
- 1.4. Definitions and Assumptions
- 2. Executive Summary
- 2.1. Market Snapshot
- 3. Market Dynamics
- 3.1. Market Drivers
- 3.2. Market Restrains
- 3.3. Market Trends
- 3.4. Market Opportunities
- 4. Market Factor Analysis
- 4.1. Porters Five Forces
- 4.1.1. Bargaining Power of Suppliers
- 4.1.2. Bargaining Power of Buyers
- 4.1.3. Threat of New Entrants
- 4.1.4. Threat of Substitutes
- 4.1.5. Competitive Rivalry
- 4.2. PESTEL analysis
- 4.3. BCG Analysis
- 4.3.1. Stars (High Growth, High Market Share)
- 4.3.2. Cash Cows (Low Growth, High Market Share)
- 4.3.3. Question Mark (High Growth, Low Market Share)
- 4.3.4. Dogs (Low Growth, Low Market Share)
- 4.4. Ansoff Matrix Analysis
- 4.5. Supply Chain Analysis
- 4.6. Regulatory Landscape
- 4.7. Current Market Potential and Opportunity Assessment (TAM–SAM–SOM Framework)
- 4.8. IMR Analyst Note
- 4.1. Porters Five Forces
- 5. Market Analysis, Insights and Forecast 2021-2033
- 5.1. Market Analysis, Insights and Forecast - by Concrete Type
- 5.1.1. Ready-mix
- 5.1.2. High Performance
- 5.1.3. Precast
- 5.1.4. Shotcrete
- 5.2. Market Analysis, Insights and Forecast - by End-use Sector
- 5.2.1. Residential
- 5.2.2. Commercial
- 5.2.3. Infrastructural
- 5.2.4. Architectural
- 5.3. Market Analysis, Insights and Forecast - by Region
- 5.3.1. Asia Pacific
- 5.3.2. North America
- 5.3.3. Europe
- 5.3.4. South America
- 5.3.5. Middle East and Africa
- 5.1. Market Analysis, Insights and Forecast - by Concrete Type
- 6. Global 3D Concrete Printing Market Analysis, Insights and Forecast, 2021-2033
- 6.1. Market Analysis, Insights and Forecast - by Concrete Type
- 6.1.1. Ready-mix
- 6.1.2. High Performance
- 6.1.3. Precast
- 6.1.4. Shotcrete
- 6.2. Market Analysis, Insights and Forecast - by End-use Sector
- 6.2.1. Residential
- 6.2.2. Commercial
- 6.2.3. Infrastructural
- 6.2.4. Architectural
- 6.1. Market Analysis, Insights and Forecast - by Concrete Type
- 7. Asia Pacific 3D Concrete Printing Market Analysis, Insights and Forecast, 2020-2032
- 7.1. Market Analysis, Insights and Forecast - by Concrete Type
- 7.1.1. Ready-mix
- 7.1.2. High Performance
- 7.1.3. Precast
- 7.1.4. Shotcrete
- 7.2. Market Analysis, Insights and Forecast - by End-use Sector
- 7.2.1. Residential
- 7.2.2. Commercial
- 7.2.3. Infrastructural
- 7.2.4. Architectural
- 7.1. Market Analysis, Insights and Forecast - by Concrete Type
- 8. North America 3D Concrete Printing Market Analysis, Insights and Forecast, 2020-2032
- 8.1. Market Analysis, Insights and Forecast - by Concrete Type
- 8.1.1. Ready-mix
- 8.1.2. High Performance
- 8.1.3. Precast
- 8.1.4. Shotcrete
- 8.2. Market Analysis, Insights and Forecast - by End-use Sector
- 8.2.1. Residential
- 8.2.2. Commercial
- 8.2.3. Infrastructural
- 8.2.4. Architectural
- 8.1. Market Analysis, Insights and Forecast - by Concrete Type
- 9. Europe 3D Concrete Printing Market Analysis, Insights and Forecast, 2020-2032
- 9.1. Market Analysis, Insights and Forecast - by Concrete Type
- 9.1.1. Ready-mix
- 9.1.2. High Performance
- 9.1.3. Precast
- 9.1.4. Shotcrete
- 9.2. Market Analysis, Insights and Forecast - by End-use Sector
- 9.2.1. Residential
- 9.2.2. Commercial
- 9.2.3. Infrastructural
- 9.2.4. Architectural
- 9.1. Market Analysis, Insights and Forecast - by Concrete Type
- 10. South America 3D Concrete Printing Market Analysis, Insights and Forecast, 2020-2032
- 10.1. Market Analysis, Insights and Forecast - by Concrete Type
- 10.1.1. Ready-mix
- 10.1.2. High Performance
- 10.1.3. Precast
- 10.1.4. Shotcrete
- 10.2. Market Analysis, Insights and Forecast - by End-use Sector
- 10.2.1. Residential
- 10.2.2. Commercial
- 10.2.3. Infrastructural
- 10.2.4. Architectural
- 10.1. Market Analysis, Insights and Forecast - by Concrete Type
- 11. Middle East and Africa 3D Concrete Printing Market Analysis, Insights and Forecast, 2020-2032
- 11.1. Market Analysis, Insights and Forecast - by Concrete Type
- 11.1.1. Ready-mix
- 11.1.2. High Performance
- 11.1.3. Precast
- 11.1.4. Shotcrete
- 11.2. Market Analysis, Insights and Forecast - by End-use Sector
- 11.2.1. Residential
- 11.2.2. Commercial
- 11.2.3. Infrastructural
- 11.2.4. Architectural
- 11.1. Market Analysis, Insights and Forecast - by Concrete Type
- 12. Competitive Analysis
- 12.1. Company Profiles
- 12.1.1 MUDBOTS 3D CONCRETE PRINTING LLC
- 12.1.1.1. Company Overview
- 12.1.1.2. Products
- 12.1.1.3. Company Financials
- 12.1.1.4. SWOT Analysis
- 12.1.2 HOLCIM
- 12.1.2.1. Company Overview
- 12.1.2.2. Products
- 12.1.2.3. Company Financials
- 12.1.2.4. SWOT Analysis
- 12.1.3 Apis Cor Inc
- 12.1.3.1. Company Overview
- 12.1.3.2. Products
- 12.1.3.3. Company Financials
- 12.1.3.4. SWOT Analysis
- 12.1.4 HEIDELBERGCEMENT AG
- 12.1.4.1. Company Overview
- 12.1.4.2. Products
- 12.1.4.3. Company Financials
- 12.1.4.4. SWOT Analysis
- 12.1.5 CyBe Construction
- 12.1.5.1. Company Overview
- 12.1.5.2. Products
- 12.1.5.3. Company Financials
- 12.1.5.4. SWOT Analysis
- 12.1.6 ICON Technology Inc
- 12.1.6.1. Company Overview
- 12.1.6.2. Products
- 12.1.6.3. Company Financials
- 12.1.6.4. SWOT Analysis
- 12.1.7 WASP Srl - Via Castelletto
- 12.1.7.1. Company Overview
- 12.1.7.2. Products
- 12.1.7.3. Company Financials
- 12.1.7.4. SWOT Analysis
- 12.1.8 XtreeE
- 12.1.8.1. Company Overview
- 12.1.8.2. Products
- 12.1.8.3. Company Financials
- 12.1.8.4. SWOT Analysis
- 12.1.9 Sika AG
- 12.1.9.1. Company Overview
- 12.1.9.2. Products
- 12.1.9.3. Company Financials
- 12.1.9.4. SWOT Analysis
- 12.1.10 Skanska
- 12.1.10.1. Company Overview
- 12.1.10.2. Products
- 12.1.10.3. Company Financials
- 12.1.10.4. SWOT Analysis
- 12.1.11 Yingchuang Building Technique (Shanghai) Co Ltd (WinSun)
- 12.1.11.1. Company Overview
- 12.1.11.2. Products
- 12.1.11.3. Company Financials
- 12.1.11.4. SWOT Analysis
- 12.1.12 COBOD
- 12.1.12.1. Company Overview
- 12.1.12.2. Products
- 12.1.12.3. Company Financials
- 12.1.12.4. SWOT Analysis
- 12.1.1 MUDBOTS 3D CONCRETE PRINTING LLC
- 12.2. Market Entropy
- 12.2.1 Company's Key Areas Served
- 12.2.2 Recent Developments
- 12.3. Company Market Share Analysis 2025
- 12.3.1 Top 5 Companies Market Share Analysis
- 12.3.2 Top 3 Companies Market Share Analysis
- 12.4. List of Potential Customers
- 13. Research Methodology
List of Figures
- Figure 1: Global 3D Concrete Printing Market Revenue Breakdown (billion, %) by Region 2025 & 2033
- Figure 2: Global 3D Concrete Printing Market Volume Breakdown (K Tons, %) by Region 2025 & 2033
- Figure 3: Asia Pacific 3D Concrete Printing Market Revenue (billion), by Concrete Type 2025 & 2033
- Figure 4: Asia Pacific 3D Concrete Printing Market Volume (K Tons), by Concrete Type 2025 & 2033
- Figure 5: Asia Pacific 3D Concrete Printing Market Revenue Share (%), by Concrete Type 2025 & 2033
- Figure 6: Asia Pacific 3D Concrete Printing Market Volume Share (%), by Concrete Type 2025 & 2033
- Figure 7: Asia Pacific 3D Concrete Printing Market Revenue (billion), by End-use Sector 2025 & 2033
- Figure 8: Asia Pacific 3D Concrete Printing Market Volume (K Tons), by End-use Sector 2025 & 2033
- Figure 9: Asia Pacific 3D Concrete Printing Market Revenue Share (%), by End-use Sector 2025 & 2033
- Figure 10: Asia Pacific 3D Concrete Printing Market Volume Share (%), by End-use Sector 2025 & 2033
- Figure 11: Asia Pacific 3D Concrete Printing Market Revenue (billion), by Country 2025 & 2033
- Figure 12: Asia Pacific 3D Concrete Printing Market Volume (K Tons), by Country 2025 & 2033
- Figure 13: Asia Pacific 3D Concrete Printing Market Revenue Share (%), by Country 2025 & 2033
- Figure 14: Asia Pacific 3D Concrete Printing Market Volume Share (%), by Country 2025 & 2033
- Figure 15: North America 3D Concrete Printing Market Revenue (billion), by Concrete Type 2025 & 2033
- Figure 16: North America 3D Concrete Printing Market Volume (K Tons), by Concrete Type 2025 & 2033
- Figure 17: North America 3D Concrete Printing Market Revenue Share (%), by Concrete Type 2025 & 2033
- Figure 18: North America 3D Concrete Printing Market Volume Share (%), by Concrete Type 2025 & 2033
- Figure 19: North America 3D Concrete Printing Market Revenue (billion), by End-use Sector 2025 & 2033
- Figure 20: North America 3D Concrete Printing Market Volume (K Tons), by End-use Sector 2025 & 2033
- Figure 21: North America 3D Concrete Printing Market Revenue Share (%), by End-use Sector 2025 & 2033
- Figure 22: North America 3D Concrete Printing Market Volume Share (%), by End-use Sector 2025 & 2033
- Figure 23: North America 3D Concrete Printing Market Revenue (billion), by Country 2025 & 2033
- Figure 24: North America 3D Concrete Printing Market Volume (K Tons), by Country 2025 & 2033
- Figure 25: North America 3D Concrete Printing Market Revenue Share (%), by Country 2025 & 2033
- Figure 26: North America 3D Concrete Printing Market Volume Share (%), by Country 2025 & 2033
- Figure 27: Europe 3D Concrete Printing Market Revenue (billion), by Concrete Type 2025 & 2033
- Figure 28: Europe 3D Concrete Printing Market Volume (K Tons), by Concrete Type 2025 & 2033
- Figure 29: Europe 3D Concrete Printing Market Revenue Share (%), by Concrete Type 2025 & 2033
- Figure 30: Europe 3D Concrete Printing Market Volume Share (%), by Concrete Type 2025 & 2033
- Figure 31: Europe 3D Concrete Printing Market Revenue (billion), by End-use Sector 2025 & 2033
- Figure 32: Europe 3D Concrete Printing Market Volume (K Tons), by End-use Sector 2025 & 2033
- Figure 33: Europe 3D Concrete Printing Market Revenue Share (%), by End-use Sector 2025 & 2033
- Figure 34: Europe 3D Concrete Printing Market Volume Share (%), by End-use Sector 2025 & 2033
- Figure 35: Europe 3D Concrete Printing Market Revenue (billion), by Country 2025 & 2033
- Figure 36: Europe 3D Concrete Printing Market Volume (K Tons), by Country 2025 & 2033
- Figure 37: Europe 3D Concrete Printing Market Revenue Share (%), by Country 2025 & 2033
- Figure 38: Europe 3D Concrete Printing Market Volume Share (%), by Country 2025 & 2033
- Figure 39: South America 3D Concrete Printing Market Revenue (billion), by Concrete Type 2025 & 2033
- Figure 40: South America 3D Concrete Printing Market Volume (K Tons), by Concrete Type 2025 & 2033
- Figure 41: South America 3D Concrete Printing Market Revenue Share (%), by Concrete Type 2025 & 2033
- Figure 42: South America 3D Concrete Printing Market Volume Share (%), by Concrete Type 2025 & 2033
- Figure 43: South America 3D Concrete Printing Market Revenue (billion), by End-use Sector 2025 & 2033
- Figure 44: South America 3D Concrete Printing Market Volume (K Tons), by End-use Sector 2025 & 2033
- Figure 45: South America 3D Concrete Printing Market Revenue Share (%), by End-use Sector 2025 & 2033
- Figure 46: South America 3D Concrete Printing Market Volume Share (%), by End-use Sector 2025 & 2033
- Figure 47: South America 3D Concrete Printing Market Revenue (billion), by Country 2025 & 2033
- Figure 48: South America 3D Concrete Printing Market Volume (K Tons), by Country 2025 & 2033
- Figure 49: South America 3D Concrete Printing Market Revenue Share (%), by Country 2025 & 2033
- Figure 50: South America 3D Concrete Printing Market Volume Share (%), by Country 2025 & 2033
- Figure 51: Middle East and Africa 3D Concrete Printing Market Revenue (billion), by Concrete Type 2025 & 2033
- Figure 52: Middle East and Africa 3D Concrete Printing Market Volume (K Tons), by Concrete Type 2025 & 2033
- Figure 53: Middle East and Africa 3D Concrete Printing Market Revenue Share (%), by Concrete Type 2025 & 2033
- Figure 54: Middle East and Africa 3D Concrete Printing Market Volume Share (%), by Concrete Type 2025 & 2033
- Figure 55: Middle East and Africa 3D Concrete Printing Market Revenue (billion), by End-use Sector 2025 & 2033
- Figure 56: Middle East and Africa 3D Concrete Printing Market Volume (K Tons), by End-use Sector 2025 & 2033
- Figure 57: Middle East and Africa 3D Concrete Printing Market Revenue Share (%), by End-use Sector 2025 & 2033
- Figure 58: Middle East and Africa 3D Concrete Printing Market Volume Share (%), by End-use Sector 2025 & 2033
- Figure 59: Middle East and Africa 3D Concrete Printing Market Revenue (billion), by Country 2025 & 2033
- Figure 60: Middle East and Africa 3D Concrete Printing Market Volume (K Tons), by Country 2025 & 2033
- Figure 61: Middle East and Africa 3D Concrete Printing Market Revenue Share (%), by Country 2025 & 2033
- Figure 62: Middle East and Africa 3D Concrete Printing Market Volume Share (%), by Country 2025 & 2033
List of Tables
- Table 1: Global 3D Concrete Printing Market Revenue billion Forecast, by Concrete Type 2020 & 2033
- Table 2: Global 3D Concrete Printing Market Volume K Tons Forecast, by Concrete Type 2020 & 2033
- Table 3: Global 3D Concrete Printing Market Revenue billion Forecast, by End-use Sector 2020 & 2033
- Table 4: Global 3D Concrete Printing Market Volume K Tons Forecast, by End-use Sector 2020 & 2033
- Table 5: Global 3D Concrete Printing Market Revenue billion Forecast, by Region 2020 & 2033
- Table 6: Global 3D Concrete Printing Market Volume K Tons Forecast, by Region 2020 & 2033
- Table 7: Global 3D Concrete Printing Market Revenue billion Forecast, by Concrete Type 2020 & 2033
- Table 8: Global 3D Concrete Printing Market Volume K Tons Forecast, by Concrete Type 2020 & 2033
- Table 9: Global 3D Concrete Printing Market Revenue billion Forecast, by End-use Sector 2020 & 2033
- Table 10: Global 3D Concrete Printing Market Volume K Tons Forecast, by End-use Sector 2020 & 2033
- Table 11: Global 3D Concrete Printing Market Revenue billion Forecast, by Country 2020 & 2033
- Table 12: Global 3D Concrete Printing Market Volume K Tons Forecast, by Country 2020 & 2033
- Table 13: China 3D Concrete Printing Market Revenue (billion) Forecast, by Application 2020 & 2033
- Table 14: China 3D Concrete Printing Market Volume (K Tons) Forecast, by Application 2020 & 2033
- Table 15: India 3D Concrete Printing Market Revenue (billion) Forecast, by Application 2020 & 2033
- Table 16: India 3D Concrete Printing Market Volume (K Tons) Forecast, by Application 2020 & 2033
- Table 17: Japan 3D Concrete Printing Market Revenue (billion) Forecast, by Application 2020 & 2033
- Table 18: Japan 3D Concrete Printing Market Volume (K Tons) Forecast, by Application 2020 & 2033
- Table 19: South Korea 3D Concrete Printing Market Revenue (billion) Forecast, by Application 2020 & 2033
- Table 20: South Korea 3D Concrete Printing Market Volume (K Tons) Forecast, by Application 2020 & 2033
- Table 21: ASEAN Countries 3D Concrete Printing Market Revenue (billion) Forecast, by Application 2020 & 2033
- Table 22: ASEAN Countries 3D Concrete Printing Market Volume (K Tons) Forecast, by Application 2020 & 2033
- Table 23: Rest of Asia Pacific 3D Concrete Printing Market Revenue (billion) Forecast, by Application 2020 & 2033
- Table 24: Rest of Asia Pacific 3D Concrete Printing Market Volume (K Tons) Forecast, by Application 2020 & 2033
- Table 25: Global 3D Concrete Printing Market Revenue billion Forecast, by Concrete Type 2020 & 2033
- Table 26: Global 3D Concrete Printing Market Volume K Tons Forecast, by Concrete Type 2020 & 2033
- Table 27: Global 3D Concrete Printing Market Revenue billion Forecast, by End-use Sector 2020 & 2033
- Table 28: Global 3D Concrete Printing Market Volume K Tons Forecast, by End-use Sector 2020 & 2033
- Table 29: Global 3D Concrete Printing Market Revenue billion Forecast, by Country 2020 & 2033
- Table 30: Global 3D Concrete Printing Market Volume K Tons Forecast, by Country 2020 & 2033
- Table 31: United States 3D Concrete Printing Market Revenue (billion) Forecast, by Application 2020 & 2033
- Table 32: United States 3D Concrete Printing Market Volume (K Tons) Forecast, by Application 2020 & 2033
- Table 33: Canada 3D Concrete Printing Market Revenue (billion) Forecast, by Application 2020 & 2033
- Table 34: Canada 3D Concrete Printing Market Volume (K Tons) Forecast, by Application 2020 & 2033
- Table 35: Mexico 3D Concrete Printing Market Revenue (billion) Forecast, by Application 2020 & 2033
- Table 36: Mexico 3D Concrete Printing Market Volume (K Tons) Forecast, by Application 2020 & 2033
- Table 37: Global 3D Concrete Printing Market Revenue billion Forecast, by Concrete Type 2020 & 2033
- Table 38: Global 3D Concrete Printing Market Volume K Tons Forecast, by Concrete Type 2020 & 2033
- Table 39: Global 3D Concrete Printing Market Revenue billion Forecast, by End-use Sector 2020 & 2033
- Table 40: Global 3D Concrete Printing Market Volume K Tons Forecast, by End-use Sector 2020 & 2033
- Table 41: Global 3D Concrete Printing Market Revenue billion Forecast, by Country 2020 & 2033
- Table 42: Global 3D Concrete Printing Market Volume K Tons Forecast, by Country 2020 & 2033
- Table 43: Germany 3D Concrete Printing Market Revenue (billion) Forecast, by Application 2020 & 2033
- Table 44: Germany 3D Concrete Printing Market Volume (K Tons) Forecast, by Application 2020 & 2033
- Table 45: United Kingdom 3D Concrete Printing Market Revenue (billion) Forecast, by Application 2020 & 2033
- Table 46: United Kingdom 3D Concrete Printing Market Volume (K Tons) Forecast, by Application 2020 & 2033
- Table 47: France 3D Concrete Printing Market Revenue (billion) Forecast, by Application 2020 & 2033
- Table 48: France 3D Concrete Printing Market Volume (K Tons) Forecast, by Application 2020 & 2033
- Table 49: Nordic Countries 3D Concrete Printing Market Revenue (billion) Forecast, by Application 2020 & 2033
- Table 50: Nordic Countries 3D Concrete Printing Market Volume (K Tons) Forecast, by Application 2020 & 2033
- Table 51: The Netherlands 3D Concrete Printing Market Revenue (billion) Forecast, by Application 2020 & 2033
- Table 52: The Netherlands 3D Concrete Printing Market Volume (K Tons) Forecast, by Application 2020 & 2033
- Table 53: Rest of Europe 3D Concrete Printing Market Revenue (billion) Forecast, by Application 2020 & 2033
- Table 54: Rest of Europe 3D Concrete Printing Market Volume (K Tons) Forecast, by Application 2020 & 2033
- Table 55: Global 3D Concrete Printing Market Revenue billion Forecast, by Concrete Type 2020 & 2033
- Table 56: Global 3D Concrete Printing Market Volume K Tons Forecast, by Concrete Type 2020 & 2033
- Table 57: Global 3D Concrete Printing Market Revenue billion Forecast, by End-use Sector 2020 & 2033
- Table 58: Global 3D Concrete Printing Market Volume K Tons Forecast, by End-use Sector 2020 & 2033
- Table 59: Global 3D Concrete Printing Market Revenue billion Forecast, by Country 2020 & 2033
- Table 60: Global 3D Concrete Printing Market Volume K Tons Forecast, by Country 2020 & 2033
- Table 61: Brazil 3D Concrete Printing Market Revenue (billion) Forecast, by Application 2020 & 2033
- Table 62: Brazil 3D Concrete Printing Market Volume (K Tons) Forecast, by Application 2020 & 2033
- Table 63: Argentina 3D Concrete Printing Market Revenue (billion) Forecast, by Application 2020 & 2033
- Table 64: Argentina 3D Concrete Printing Market Volume (K Tons) Forecast, by Application 2020 & 2033
- Table 65: Rest of South America 3D Concrete Printing Market Revenue (billion) Forecast, by Application 2020 & 2033
- Table 66: Rest of South America 3D Concrete Printing Market Volume (K Tons) Forecast, by Application 2020 & 2033
- Table 67: Global 3D Concrete Printing Market Revenue billion Forecast, by Concrete Type 2020 & 2033
- Table 68: Global 3D Concrete Printing Market Volume K Tons Forecast, by Concrete Type 2020 & 2033
- Table 69: Global 3D Concrete Printing Market Revenue billion Forecast, by End-use Sector 2020 & 2033
- Table 70: Global 3D Concrete Printing Market Volume K Tons Forecast, by End-use Sector 2020 & 2033
- Table 71: Global 3D Concrete Printing Market Revenue billion Forecast, by Country 2020 & 2033
- Table 72: Global 3D Concrete Printing Market Volume K Tons Forecast, by Country 2020 & 2033
- Table 73: GCC Countries 3D Concrete Printing Market Revenue (billion) Forecast, by Application 2020 & 2033
- Table 74: GCC Countries 3D Concrete Printing Market Volume (K Tons) Forecast, by Application 2020 & 2033
- Table 75: South Africa 3D Concrete Printing Market Revenue (billion) Forecast, by Application 2020 & 2033
- Table 76: South Africa 3D Concrete Printing Market Volume (K Tons) Forecast, by Application 2020 & 2033
- Table 77: Rest of Middle East and Africa 3D Concrete Printing Market Revenue (billion) Forecast, by Application 2020 & 2033
- Table 78: Rest of Middle East and Africa 3D Concrete Printing Market Volume (K Tons) Forecast, by Application 2020 & 2033
Frequently Asked Questions
1. What is the projected Compound Annual Growth Rate (CAGR) of the 3D Concrete Printing Market?
The projected CAGR is approximately 45.86%.
2. Which companies are prominent players in the 3D Concrete Printing Market?
Key companies in the market include MUDBOTS 3D CONCRETE PRINTING LLC, HOLCIM, Apis Cor Inc, HEIDELBERGCEMENT AG, CyBe Construction, ICON Technology Inc, WASP Srl - Via Castelletto, XtreeE, Sika AG, Skanska, Yingchuang Building Technique (Shanghai) Co Ltd (WinSun), COBOD.
3. What are the main segments of the 3D Concrete Printing Market?
The market segments include Concrete Type, End-use Sector.
4. Can you provide details about the market size?
The market size is estimated to be USD 0.16 billion as of 2022.
5. What are some drivers contributing to market growth?
Increasing Demand for Customized and Money Efficient Constructions; Increasing Investments in Infrastructure due to Rapid Urbanization and Industrialization; Increasing Focus on Eco-friendly and Smart Constructions.
6. What are the notable trends driving market growth?
Infrastructural Sector to Dominate the Market.
7. Are there any restraints impacting market growth?
Stagnant Industrial Growth in the Developed Countries.
8. Can you provide examples of recent developments in the market?
October 2022: Holcim announced its investment in COBOD International to advance world-class 3D printing materials, robotics, and automation. The 3D-printed windmill tower bases with GE, the world's first 3D-printed school in Malawi, and Africa's largest 3D-printed affordable housing project in Kenya are just a few of the cutting-edge construction projects on which Holcim and COBOD have successfully collaborated.
9. What pricing options are available for accessing the report?
Pricing options include single-user, multi-user, and enterprise licenses priced at USD 4750, USD 5250, and USD 8750 respectively.
10. Is the market size provided in terms of value or volume?
The market size is provided in terms of value, measured in billion and volume, measured in K Tons.
11. Are there any specific market keywords associated with the report?
Yes, the market keyword associated with the report is "3D Concrete Printing Market," which aids in identifying and referencing the specific market segment covered.
12. How do I determine which pricing option suits my needs best?
The pricing options vary based on user requirements and access needs. Individual users may opt for single-user licenses, while businesses requiring broader access may choose multi-user or enterprise licenses for cost-effective access to the report.
13. Are there any additional resources or data provided in the 3D Concrete Printing Market report?
While the report offers comprehensive insights, it's advisable to review the specific contents or supplementary materials provided to ascertain if additional resources or data are available.
14. How can I stay updated on further developments or reports in the 3D Concrete Printing Market?
To stay informed about further developments, trends, and reports in the 3D Concrete Printing Market, consider subscribing to industry newsletters, following relevant companies and organizations, or regularly checking reputable industry news sources and publications.
Methodology
Step 1 - Identification of Relevant Samples Size from Population Database


Step 2 - Approaches for Defining Global Market Size (Value, Volume* & Price*)

Note*: In applicable scenarios
Step 3 - Data Sources
Primary Research
- Web Analytics
- Survey Reports
- Research Institute
- Latest Research Reports
- Opinion Leaders
Secondary Research
- Annual Reports
- White Paper
- Latest Press Release
- Industry Association
- Paid Database
- Investor Presentations

Step 4 - Data Triangulation
Involves using different sources of information in order to increase the validity of a study
These sources are likely to be stakeholders in a program - participants, other researchers, program staff, other community members, and so on.
Then we put all data in single framework & apply various statistical tools to find out the dynamic on the market.
During the analysis stage, feedback from the stakeholder groups would be compared to determine areas of agreement as well as areas of divergence