

Key Insights
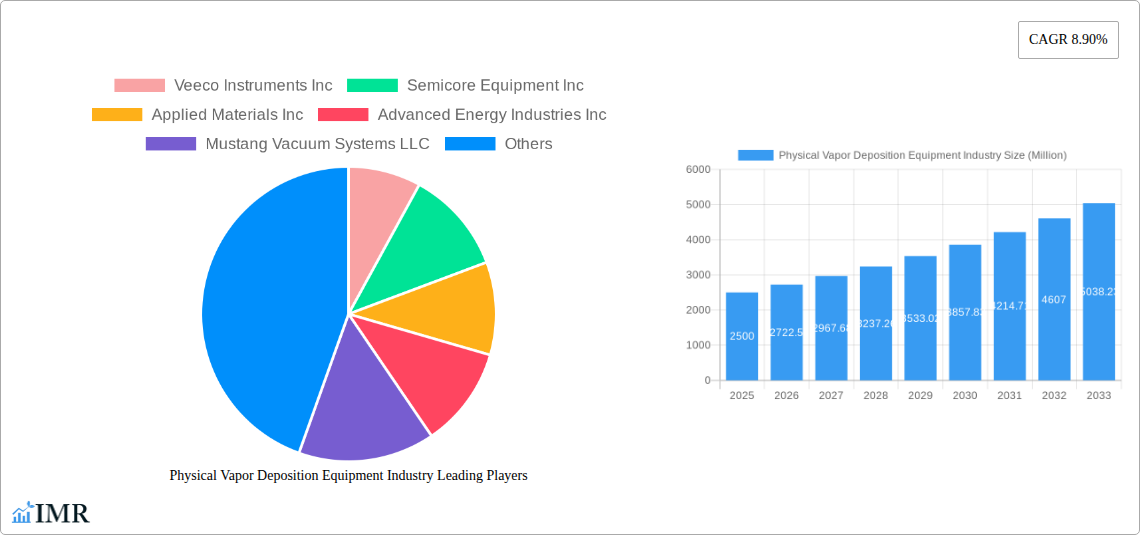
The Physical Vapor Deposition (PVD) equipment market, valued at approximately $XX million in 2025, is projected to experience robust growth, exhibiting a compound annual growth rate (CAGR) of 8.90% from 2025 to 2033. This expansion is fueled by several key drivers. The burgeoning microelectronics industry, driven by the increasing demand for advanced semiconductors and integrated circuits, is a primary catalyst. Furthermore, the medical device and equipment sector's reliance on PVD for creating biocompatible coatings and enhancing device performance contributes significantly to market growth. The rising adoption of solar energy and the consequent need for efficient solar cell production further bolster market demand. Technological advancements, such as the development of more precise and efficient PVD techniques, and the increasing adoption of automation in the manufacturing process are also propelling market expansion. While the high initial investment costs associated with PVD equipment and potential supply chain disruptions could pose challenges, the overall market outlook remains positive, driven by the aforementioned factors and strong demand across various end-user industries.
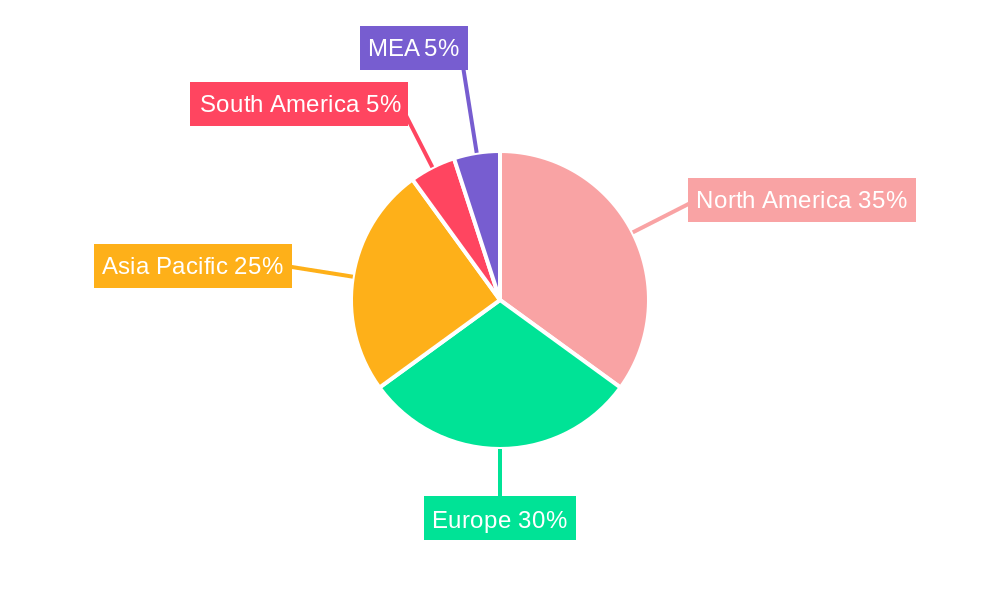
Regional growth patterns are expected to be diverse. North America and Europe, already established as major markets, will continue to witness steady growth, driven by technological advancements and strong industrial bases. However, the Asia-Pacific region is projected to exhibit the most substantial growth during the forecast period (2025-2033), fueled by rapid industrialization, significant investments in semiconductor manufacturing, and a booming solar energy sector in countries like China, India, and Japan. This regional divergence necessitates a tailored approach for market players aiming to maximize their reach and competitiveness. The segmentation by end-user (microelectronics, medical devices, solar products, and others) allows for a granular understanding of the market, allowing companies to focus their R&D and marketing strategies towards high-growth segments. The competitive landscape is characterized by a mix of established players and emerging companies, each striving to innovate and gain market share.
Physical Vapor Deposition (PVD) Equipment Market Report: 2019-2033
This comprehensive report provides an in-depth analysis of the Physical Vapor Deposition (PVD) equipment market, encompassing market dynamics, growth trends, regional landscapes, product innovations, and key players. The study period covers 2019-2033, with 2025 as the base and estimated year, and a forecast period of 2025-2033. The historical period analyzed is 2019-2024. The market is segmented by end-user, including microelectronics, medical devices and equipment, solar products, and other end-users. This report is a must-have for industry professionals, investors, and anyone seeking a thorough understanding of this dynamic market. The global market size is projected to reach xx Million units by 2033.
Physical Vapor Deposition Equipment Industry Market Dynamics & Structure
The Physical Vapor Deposition (PVD) equipment market is characterized by moderate concentration, with several key players dominating significant market share. Technological innovation, driven by advancements in materials science and thin-film deposition techniques, is a crucial growth driver. Stringent regulatory frameworks concerning emissions and workplace safety influence manufacturing processes and equipment design. Competitive pressure from alternative deposition methods, such as chemical vapor deposition (CVD), necessitates continuous innovation. The end-user demographics are diverse, with microelectronics representing a dominant segment. M&A activity has been moderate in recent years, with strategic acquisitions aimed at expanding product portfolios and technological capabilities.
- Market Concentration: Moderately concentrated, with top 5 players holding approximately xx% market share in 2024.
- Technological Innovation: Focus on improving deposition rates, film quality, and process control. Emerging technologies include sputtering, evaporation, and atomic layer deposition (ALD).
- Regulatory Framework: Compliance with environmental regulations (emissions) and safety standards (workplace hazards) is paramount.
- Competitive Substitutes: Chemical Vapor Deposition (CVD) and other thin-film deposition techniques pose competition.
- End-User Demographics: Microelectronics accounts for the largest market share, followed by medical devices, solar, and others.
- M&A Trends: Strategic acquisitions focus on broadening technology portfolios and market reach. The number of M&A deals in 2024 was estimated at xx.
Physical Vapor Deposition Equipment Industry Growth Trends & Insights
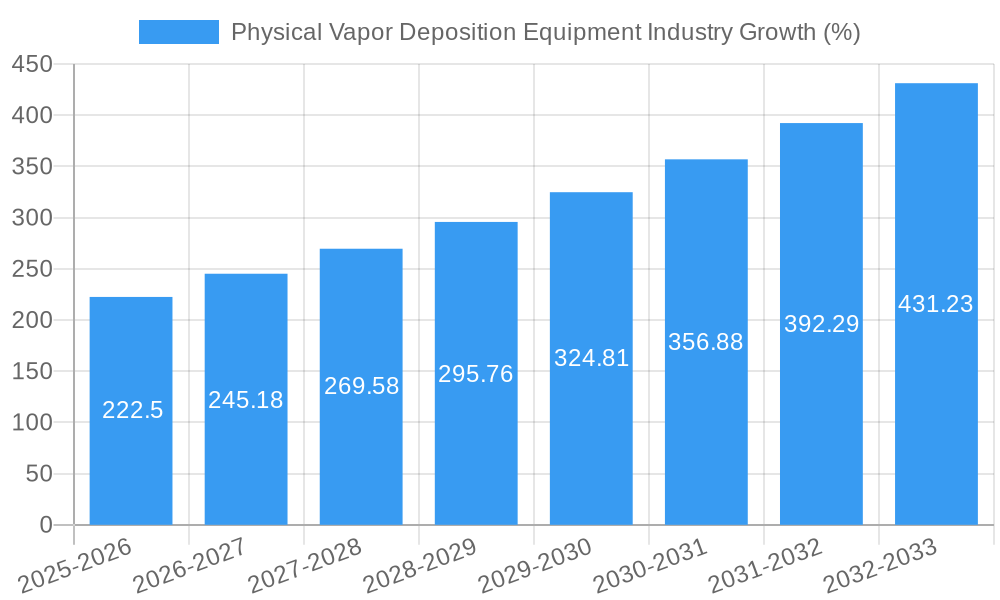
The PVD equipment market experienced significant growth during the historical period (2019-2024), driven by increasing demand from the microelectronics and solar energy sectors. The adoption rate of advanced PVD technologies is accelerating due to the need for higher-performance thin films. Technological disruptions, such as the introduction of new sputtering targets and improved vacuum systems, are transforming the market landscape. Consumer behavior shifts towards miniaturization and higher performance in electronics are fueling demand. The market is expected to witness a CAGR of xx% during the forecast period (2025-2033). Market penetration in emerging economies is expected to increase significantly, contributing to overall market expansion. This growth is largely attributed to increasing investments in semiconductor manufacturing, rising demand for advanced medical devices, and the expansion of the renewable energy sector. Specific details on CAGR and market penetration will be detailed in the full report.
Dominant Regions, Countries, or Segments in Physical Vapor Deposition Equipment Industry
The Asia-Pacific region, particularly countries like China, South Korea, and Taiwan, are leading the PVD equipment market due to the substantial presence of semiconductor manufacturing facilities and robust growth in the electronics industry. North America also holds a significant market share due to strong R&D activities and established microelectronics companies. Within the end-user segments, microelectronics commands the largest market share, followed by medical devices and equipment. The solar industry shows a steady growth trajectory, while 'other end-users' represent a growing but fragmented market.
- Key Drivers in Asia-Pacific: Large-scale semiconductor fabrication plants, government incentives for technological advancement, and a growing consumer electronics market.
- Key Drivers in North America: Strong R&D investments, presence of major technology companies, and focus on advanced materials.
- Microelectronics Dominance: Driven by rising demand for smaller, faster, and more energy-efficient electronic devices.
- Medical Devices & Equipment Growth: Increasing demand for advanced medical implants and diagnostic tools.
- Solar Product Segment: Driven by the increasing adoption of solar energy worldwide.
Physical Vapor Deposition Equipment Industry Product Landscape
The PVD equipment market offers a wide range of products, including sputtering systems, evaporation systems, and ion plating systems. Recent innovations focus on improving deposition rates, enhancing film uniformity, and enabling the deposition of complex multi-layered structures. Advanced features like in-situ monitoring and process control systems are enhancing overall performance. Unique selling propositions include enhanced throughput, superior film quality, and reduced operating costs.
Key Drivers, Barriers & Challenges in Physical Vapor Deposition Equipment Industry
Key Drivers: Technological advancements (new materials and deposition techniques), increasing demand from the electronics industry (especially microelectronics), and government support for renewable energy (solar panel manufacturing).
Challenges & Restraints: High equipment costs, intense competition from established players, fluctuations in raw material prices, and complexities in maintaining stringent process controls can limit market growth. Supply chain disruptions also represent a significant challenge. Estimates of supply chain impact during 2024 on profitability are included in the full report.
Emerging Opportunities in Physical Vapor Deposition Equipment Industry
Emerging opportunities lie in the development of novel PVD techniques for flexible electronics, advanced displays, and energy-efficient lighting. Untapped markets in developing economies present significant growth potential. The integration of AI and machine learning for process optimization offers substantial scope for innovation. The increasing demand for customized coating solutions for specific applications represents an area ripe for expansion.
Growth Accelerators in the Physical Vapor Deposition Equipment Industry Industry
Technological breakthroughs in plasma-enhanced deposition techniques and the development of advanced materials are key growth drivers. Strategic partnerships between equipment manufacturers and end-users can accelerate adoption rates and market penetration. Expansion into new geographical markets and diversification of product portfolios can further fuel market growth.
Key Players Shaping the Physical Vapor Deposition Equipment Industry Market
- Veeco Instruments Inc
- Semicore Equipment Inc
- Applied Materials Inc
- Advanced Energy Industries Inc
- Mustang Vacuum Systems LLC
- IHI Corporation
- ULVAC Inc
- Platit AG
- Angstrom Engineering Inc
- AJA International Inc
- Oerlikon Balzers Coating AG
Notable Milestones in Physical Vapor Deposition Equipment Industry Sector
- 2022 Q3: Applied Materials launched its next-generation sputtering system.
- 2023 Q1: Veeco Instruments announced a strategic partnership with a major semiconductor manufacturer.
- 2024 Q2: A significant merger occurred between two smaller PVD equipment manufacturers. Further details on the impact of this and other mergers will be covered in the full report.
In-Depth Physical Vapor Deposition Equipment Industry Market Outlook
The future of the PVD equipment market is bright, driven by ongoing technological advancements, increasing demand from diverse end-user segments, and expansion into new geographical markets. Strategic investments in R&D, strategic partnerships, and a focus on innovative applications will be crucial for companies to capitalize on the long-term growth opportunities within this dynamic sector. The full report includes detailed forecasts and strategic recommendations.
Physical Vapor Deposition Equipment Industry Segmentation
-
1. End User
- 1.1. Microelectronics
- 1.2. Medical Devices and Equipment
- 1.3. Solar Products
- 1.4. Other End Users
Physical Vapor Deposition Equipment Industry Segmentation By Geography
- 1. North America
- 2. Europe
- 3. Asia Pacific
- 4. Rest of the World
Physical Vapor Deposition Equipment Industry REPORT HIGHLIGHTS
| Aspects | Details |
|---|---|
| Study Period | 2019-2033 |
| Base Year | 2024 |
| Estimated Year | 2025 |
| Forecast Period | 2025-2033 |
| Historical Period | 2019-2024 |
| Growth Rate | CAGR of 8.90% from 2019-2033 |
| Segmentation |
|
Table of Contents
- 1. Introduction
- 1.1. Research Scope
- 1.2. Market Segmentation
- 1.3. Research Methodology
- 1.4. Definitions and Assumptions
- 2. Executive Summary
- 2.1. Introduction
- 3. Market Dynamics
- 3.1. Introduction
- 3.2. Market Drivers
- 3.2.1. ; Rise in the Demand for Medical Devices and Equipment; Growing Demand for Microelectronics in Several Applications
- 3.3. Market Restrains
- 3.3.1. ; High Capital Investment
- 3.4. Market Trends
- 3.4.1. Medical Devices and Equipment is Expected to Boost the Market Growth
- 4. Market Factor Analysis
- 4.1. Porters Five Forces
- 4.2. Supply/Value Chain
- 4.3. PESTEL analysis
- 4.4. Market Entropy
- 4.5. Patent/Trademark Analysis
- 5. Global Physical Vapor Deposition Equipment Industry Analysis, Insights and Forecast, 2019-2031
- 5.1. Market Analysis, Insights and Forecast - by End User
- 5.1.1. Microelectronics
- 5.1.2. Medical Devices and Equipment
- 5.1.3. Solar Products
- 5.1.4. Other End Users
- 5.2. Market Analysis, Insights and Forecast - by Region
- 5.2.1. North America
- 5.2.2. Europe
- 5.2.3. Asia Pacific
- 5.2.4. Rest of the World
- 5.1. Market Analysis, Insights and Forecast - by End User
- 6. North America Physical Vapor Deposition Equipment Industry Analysis, Insights and Forecast, 2019-2031
- 6.1. Market Analysis, Insights and Forecast - by End User
- 6.1.1. Microelectronics
- 6.1.2. Medical Devices and Equipment
- 6.1.3. Solar Products
- 6.1.4. Other End Users
- 6.1. Market Analysis, Insights and Forecast - by End User
- 7. Europe Physical Vapor Deposition Equipment Industry Analysis, Insights and Forecast, 2019-2031
- 7.1. Market Analysis, Insights and Forecast - by End User
- 7.1.1. Microelectronics
- 7.1.2. Medical Devices and Equipment
- 7.1.3. Solar Products
- 7.1.4. Other End Users
- 7.1. Market Analysis, Insights and Forecast - by End User
- 8. Asia Pacific Physical Vapor Deposition Equipment Industry Analysis, Insights and Forecast, 2019-2031
- 8.1. Market Analysis, Insights and Forecast - by End User
- 8.1.1. Microelectronics
- 8.1.2. Medical Devices and Equipment
- 8.1.3. Solar Products
- 8.1.4. Other End Users
- 8.1. Market Analysis, Insights and Forecast - by End User
- 9. Rest of the World Physical Vapor Deposition Equipment Industry Analysis, Insights and Forecast, 2019-2031
- 9.1. Market Analysis, Insights and Forecast - by End User
- 9.1.1. Microelectronics
- 9.1.2. Medical Devices and Equipment
- 9.1.3. Solar Products
- 9.1.4. Other End Users
- 9.1. Market Analysis, Insights and Forecast - by End User
- 10. North America Physical Vapor Deposition Equipment Industry Analysis, Insights and Forecast, 2019-2031
- 10.1. Market Analysis, Insights and Forecast - By Country/Sub-region
- 10.1.1 United States
- 10.1.2 Canada
- 10.1.3 Mexico
- 11. Europe Physical Vapor Deposition Equipment Industry Analysis, Insights and Forecast, 2019-2031
- 11.1. Market Analysis, Insights and Forecast - By Country/Sub-region
- 11.1.1 Germany
- 11.1.2 United Kingdom
- 11.1.3 France
- 11.1.4 Spain
- 11.1.5 Italy
- 11.1.6 Spain
- 11.1.7 Belgium
- 11.1.8 Netherland
- 11.1.9 Nordics
- 11.1.10 Rest of Europe
- 12. Asia Pacific Physical Vapor Deposition Equipment Industry Analysis, Insights and Forecast, 2019-2031
- 12.1. Market Analysis, Insights and Forecast - By Country/Sub-region
- 12.1.1 China
- 12.1.2 Japan
- 12.1.3 India
- 12.1.4 South Korea
- 12.1.5 Southeast Asia
- 12.1.6 Australia
- 12.1.7 Indonesia
- 12.1.8 Phillipes
- 12.1.9 Singapore
- 12.1.10 Thailandc
- 12.1.11 Rest of Asia Pacific
- 13. South America Physical Vapor Deposition Equipment Industry Analysis, Insights and Forecast, 2019-2031
- 13.1. Market Analysis, Insights and Forecast - By Country/Sub-region
- 13.1.1 Brazil
- 13.1.2 Argentina
- 13.1.3 Peru
- 13.1.4 Chile
- 13.1.5 Colombia
- 13.1.6 Ecuador
- 13.1.7 Venezuela
- 13.1.8 Rest of South America
- 14. North America Physical Vapor Deposition Equipment Industry Analysis, Insights and Forecast, 2019-2031
- 14.1. Market Analysis, Insights and Forecast - By Country/Sub-region
- 14.1.1 United States
- 14.1.2 Canada
- 14.1.3 Mexico
- 15. MEA Physical Vapor Deposition Equipment Industry Analysis, Insights and Forecast, 2019-2031
- 15.1. Market Analysis, Insights and Forecast - By Country/Sub-region
- 15.1.1 United Arab Emirates
- 15.1.2 Saudi Arabia
- 15.1.3 South Africa
- 15.1.4 Rest of Middle East and Africa
- 16. Competitive Analysis
- 16.1. Global Market Share Analysis 2024
- 16.2. Company Profiles
- 16.2.1 Veeco Instruments Inc
- 16.2.1.1. Overview
- 16.2.1.2. Products
- 16.2.1.3. SWOT Analysis
- 16.2.1.4. Recent Developments
- 16.2.1.5. Financials (Based on Availability)
- 16.2.2 Semicore Equipment Inc
- 16.2.2.1. Overview
- 16.2.2.2. Products
- 16.2.2.3. SWOT Analysis
- 16.2.2.4. Recent Developments
- 16.2.2.5. Financials (Based on Availability)
- 16.2.3 Applied Materials Inc
- 16.2.3.1. Overview
- 16.2.3.2. Products
- 16.2.3.3. SWOT Analysis
- 16.2.3.4. Recent Developments
- 16.2.3.5. Financials (Based on Availability)
- 16.2.4 Advanced Energy Industries Inc
- 16.2.4.1. Overview
- 16.2.4.2. Products
- 16.2.4.3. SWOT Analysis
- 16.2.4.4. Recent Developments
- 16.2.4.5. Financials (Based on Availability)
- 16.2.5 Mustang Vacuum Systems LLC
- 16.2.5.1. Overview
- 16.2.5.2. Products
- 16.2.5.3. SWOT Analysis
- 16.2.5.4. Recent Developments
- 16.2.5.5. Financials (Based on Availability)
- 16.2.6 IHI Corporatio
- 16.2.6.1. Overview
- 16.2.6.2. Products
- 16.2.6.3. SWOT Analysis
- 16.2.6.4. Recent Developments
- 16.2.6.5. Financials (Based on Availability)
- 16.2.7 ULVAC Inc
- 16.2.7.1. Overview
- 16.2.7.2. Products
- 16.2.7.3. SWOT Analysis
- 16.2.7.4. Recent Developments
- 16.2.7.5. Financials (Based on Availability)
- 16.2.8 Platit AG
- 16.2.8.1. Overview
- 16.2.8.2. Products
- 16.2.8.3. SWOT Analysis
- 16.2.8.4. Recent Developments
- 16.2.8.5. Financials (Based on Availability)
- 16.2.9 Angstrom Engineering Inc
- 16.2.9.1. Overview
- 16.2.9.2. Products
- 16.2.9.3. SWOT Analysis
- 16.2.9.4. Recent Developments
- 16.2.9.5. Financials (Based on Availability)
- 16.2.10 AJA International Inc
- 16.2.10.1. Overview
- 16.2.10.2. Products
- 16.2.10.3. SWOT Analysis
- 16.2.10.4. Recent Developments
- 16.2.10.5. Financials (Based on Availability)
- 16.2.11 Oerlikon Balzers Coating AG
- 16.2.11.1. Overview
- 16.2.11.2. Products
- 16.2.11.3. SWOT Analysis
- 16.2.11.4. Recent Developments
- 16.2.11.5. Financials (Based on Availability)
- 16.2.1 Veeco Instruments Inc
List of Figures
- Figure 1: Global Physical Vapor Deposition Equipment Industry Revenue Breakdown (Million, %) by Region 2024 & 2032
- Figure 2: Global Physical Vapor Deposition Equipment Industry Volume Breakdown (K Unit, %) by Region 2024 & 2032
- Figure 3: North America Physical Vapor Deposition Equipment Industry Revenue (Million), by Country 2024 & 2032
- Figure 4: North America Physical Vapor Deposition Equipment Industry Volume (K Unit), by Country 2024 & 2032
- Figure 5: North America Physical Vapor Deposition Equipment Industry Revenue Share (%), by Country 2024 & 2032
- Figure 6: North America Physical Vapor Deposition Equipment Industry Volume Share (%), by Country 2024 & 2032
- Figure 7: Europe Physical Vapor Deposition Equipment Industry Revenue (Million), by Country 2024 & 2032
- Figure 8: Europe Physical Vapor Deposition Equipment Industry Volume (K Unit), by Country 2024 & 2032
- Figure 9: Europe Physical Vapor Deposition Equipment Industry Revenue Share (%), by Country 2024 & 2032
- Figure 10: Europe Physical Vapor Deposition Equipment Industry Volume Share (%), by Country 2024 & 2032
- Figure 11: Asia Pacific Physical Vapor Deposition Equipment Industry Revenue (Million), by Country 2024 & 2032
- Figure 12: Asia Pacific Physical Vapor Deposition Equipment Industry Volume (K Unit), by Country 2024 & 2032
- Figure 13: Asia Pacific Physical Vapor Deposition Equipment Industry Revenue Share (%), by Country 2024 & 2032
- Figure 14: Asia Pacific Physical Vapor Deposition Equipment Industry Volume Share (%), by Country 2024 & 2032
- Figure 15: South America Physical Vapor Deposition Equipment Industry Revenue (Million), by Country 2024 & 2032
- Figure 16: South America Physical Vapor Deposition Equipment Industry Volume (K Unit), by Country 2024 & 2032
- Figure 17: South America Physical Vapor Deposition Equipment Industry Revenue Share (%), by Country 2024 & 2032
- Figure 18: South America Physical Vapor Deposition Equipment Industry Volume Share (%), by Country 2024 & 2032
- Figure 19: North America Physical Vapor Deposition Equipment Industry Revenue (Million), by Country 2024 & 2032
- Figure 20: North America Physical Vapor Deposition Equipment Industry Volume (K Unit), by Country 2024 & 2032
- Figure 21: North America Physical Vapor Deposition Equipment Industry Revenue Share (%), by Country 2024 & 2032
- Figure 22: North America Physical Vapor Deposition Equipment Industry Volume Share (%), by Country 2024 & 2032
- Figure 23: MEA Physical Vapor Deposition Equipment Industry Revenue (Million), by Country 2024 & 2032
- Figure 24: MEA Physical Vapor Deposition Equipment Industry Volume (K Unit), by Country 2024 & 2032
- Figure 25: MEA Physical Vapor Deposition Equipment Industry Revenue Share (%), by Country 2024 & 2032
- Figure 26: MEA Physical Vapor Deposition Equipment Industry Volume Share (%), by Country 2024 & 2032
- Figure 27: North America Physical Vapor Deposition Equipment Industry Revenue (Million), by End User 2024 & 2032
- Figure 28: North America Physical Vapor Deposition Equipment Industry Volume (K Unit), by End User 2024 & 2032
- Figure 29: North America Physical Vapor Deposition Equipment Industry Revenue Share (%), by End User 2024 & 2032
- Figure 30: North America Physical Vapor Deposition Equipment Industry Volume Share (%), by End User 2024 & 2032
- Figure 31: North America Physical Vapor Deposition Equipment Industry Revenue (Million), by Country 2024 & 2032
- Figure 32: North America Physical Vapor Deposition Equipment Industry Volume (K Unit), by Country 2024 & 2032
- Figure 33: North America Physical Vapor Deposition Equipment Industry Revenue Share (%), by Country 2024 & 2032
- Figure 34: North America Physical Vapor Deposition Equipment Industry Volume Share (%), by Country 2024 & 2032
- Figure 35: Europe Physical Vapor Deposition Equipment Industry Revenue (Million), by End User 2024 & 2032
- Figure 36: Europe Physical Vapor Deposition Equipment Industry Volume (K Unit), by End User 2024 & 2032
- Figure 37: Europe Physical Vapor Deposition Equipment Industry Revenue Share (%), by End User 2024 & 2032
- Figure 38: Europe Physical Vapor Deposition Equipment Industry Volume Share (%), by End User 2024 & 2032
- Figure 39: Europe Physical Vapor Deposition Equipment Industry Revenue (Million), by Country 2024 & 2032
- Figure 40: Europe Physical Vapor Deposition Equipment Industry Volume (K Unit), by Country 2024 & 2032
- Figure 41: Europe Physical Vapor Deposition Equipment Industry Revenue Share (%), by Country 2024 & 2032
- Figure 42: Europe Physical Vapor Deposition Equipment Industry Volume Share (%), by Country 2024 & 2032
- Figure 43: Asia Pacific Physical Vapor Deposition Equipment Industry Revenue (Million), by End User 2024 & 2032
- Figure 44: Asia Pacific Physical Vapor Deposition Equipment Industry Volume (K Unit), by End User 2024 & 2032
- Figure 45: Asia Pacific Physical Vapor Deposition Equipment Industry Revenue Share (%), by End User 2024 & 2032
- Figure 46: Asia Pacific Physical Vapor Deposition Equipment Industry Volume Share (%), by End User 2024 & 2032
- Figure 47: Asia Pacific Physical Vapor Deposition Equipment Industry Revenue (Million), by Country 2024 & 2032
- Figure 48: Asia Pacific Physical Vapor Deposition Equipment Industry Volume (K Unit), by Country 2024 & 2032
- Figure 49: Asia Pacific Physical Vapor Deposition Equipment Industry Revenue Share (%), by Country 2024 & 2032
- Figure 50: Asia Pacific Physical Vapor Deposition Equipment Industry Volume Share (%), by Country 2024 & 2032
- Figure 51: Rest of the World Physical Vapor Deposition Equipment Industry Revenue (Million), by End User 2024 & 2032
- Figure 52: Rest of the World Physical Vapor Deposition Equipment Industry Volume (K Unit), by End User 2024 & 2032
- Figure 53: Rest of the World Physical Vapor Deposition Equipment Industry Revenue Share (%), by End User 2024 & 2032
- Figure 54: Rest of the World Physical Vapor Deposition Equipment Industry Volume Share (%), by End User 2024 & 2032
- Figure 55: Rest of the World Physical Vapor Deposition Equipment Industry Revenue (Million), by Country 2024 & 2032
- Figure 56: Rest of the World Physical Vapor Deposition Equipment Industry Volume (K Unit), by Country 2024 & 2032
- Figure 57: Rest of the World Physical Vapor Deposition Equipment Industry Revenue Share (%), by Country 2024 & 2032
- Figure 58: Rest of the World Physical Vapor Deposition Equipment Industry Volume Share (%), by Country 2024 & 2032
List of Tables
- Table 1: Global Physical Vapor Deposition Equipment Industry Revenue Million Forecast, by Region 2019 & 2032
- Table 2: Global Physical Vapor Deposition Equipment Industry Volume K Unit Forecast, by Region 2019 & 2032
- Table 3: Global Physical Vapor Deposition Equipment Industry Revenue Million Forecast, by End User 2019 & 2032
- Table 4: Global Physical Vapor Deposition Equipment Industry Volume K Unit Forecast, by End User 2019 & 2032
- Table 5: Global Physical Vapor Deposition Equipment Industry Revenue Million Forecast, by Region 2019 & 2032
- Table 6: Global Physical Vapor Deposition Equipment Industry Volume K Unit Forecast, by Region 2019 & 2032
- Table 7: Global Physical Vapor Deposition Equipment Industry Revenue Million Forecast, by Country 2019 & 2032
- Table 8: Global Physical Vapor Deposition Equipment Industry Volume K Unit Forecast, by Country 2019 & 2032
- Table 9: United States Physical Vapor Deposition Equipment Industry Revenue (Million) Forecast, by Application 2019 & 2032
- Table 10: United States Physical Vapor Deposition Equipment Industry Volume (K Unit) Forecast, by Application 2019 & 2032
- Table 11: Canada Physical Vapor Deposition Equipment Industry Revenue (Million) Forecast, by Application 2019 & 2032
- Table 12: Canada Physical Vapor Deposition Equipment Industry Volume (K Unit) Forecast, by Application 2019 & 2032
- Table 13: Mexico Physical Vapor Deposition Equipment Industry Revenue (Million) Forecast, by Application 2019 & 2032
- Table 14: Mexico Physical Vapor Deposition Equipment Industry Volume (K Unit) Forecast, by Application 2019 & 2032
- Table 15: Global Physical Vapor Deposition Equipment Industry Revenue Million Forecast, by Country 2019 & 2032
- Table 16: Global Physical Vapor Deposition Equipment Industry Volume K Unit Forecast, by Country 2019 & 2032
- Table 17: Germany Physical Vapor Deposition Equipment Industry Revenue (Million) Forecast, by Application 2019 & 2032
- Table 18: Germany Physical Vapor Deposition Equipment Industry Volume (K Unit) Forecast, by Application 2019 & 2032
- Table 19: United Kingdom Physical Vapor Deposition Equipment Industry Revenue (Million) Forecast, by Application 2019 & 2032
- Table 20: United Kingdom Physical Vapor Deposition Equipment Industry Volume (K Unit) Forecast, by Application 2019 & 2032
- Table 21: France Physical Vapor Deposition Equipment Industry Revenue (Million) Forecast, by Application 2019 & 2032
- Table 22: France Physical Vapor Deposition Equipment Industry Volume (K Unit) Forecast, by Application 2019 & 2032
- Table 23: Spain Physical Vapor Deposition Equipment Industry Revenue (Million) Forecast, by Application 2019 & 2032
- Table 24: Spain Physical Vapor Deposition Equipment Industry Volume (K Unit) Forecast, by Application 2019 & 2032
- Table 25: Italy Physical Vapor Deposition Equipment Industry Revenue (Million) Forecast, by Application 2019 & 2032
- Table 26: Italy Physical Vapor Deposition Equipment Industry Volume (K Unit) Forecast, by Application 2019 & 2032
- Table 27: Spain Physical Vapor Deposition Equipment Industry Revenue (Million) Forecast, by Application 2019 & 2032
- Table 28: Spain Physical Vapor Deposition Equipment Industry Volume (K Unit) Forecast, by Application 2019 & 2032
- Table 29: Belgium Physical Vapor Deposition Equipment Industry Revenue (Million) Forecast, by Application 2019 & 2032
- Table 30: Belgium Physical Vapor Deposition Equipment Industry Volume (K Unit) Forecast, by Application 2019 & 2032
- Table 31: Netherland Physical Vapor Deposition Equipment Industry Revenue (Million) Forecast, by Application 2019 & 2032
- Table 32: Netherland Physical Vapor Deposition Equipment Industry Volume (K Unit) Forecast, by Application 2019 & 2032
- Table 33: Nordics Physical Vapor Deposition Equipment Industry Revenue (Million) Forecast, by Application 2019 & 2032
- Table 34: Nordics Physical Vapor Deposition Equipment Industry Volume (K Unit) Forecast, by Application 2019 & 2032
- Table 35: Rest of Europe Physical Vapor Deposition Equipment Industry Revenue (Million) Forecast, by Application 2019 & 2032
- Table 36: Rest of Europe Physical Vapor Deposition Equipment Industry Volume (K Unit) Forecast, by Application 2019 & 2032
- Table 37: Global Physical Vapor Deposition Equipment Industry Revenue Million Forecast, by Country 2019 & 2032
- Table 38: Global Physical Vapor Deposition Equipment Industry Volume K Unit Forecast, by Country 2019 & 2032
- Table 39: China Physical Vapor Deposition Equipment Industry Revenue (Million) Forecast, by Application 2019 & 2032
- Table 40: China Physical Vapor Deposition Equipment Industry Volume (K Unit) Forecast, by Application 2019 & 2032
- Table 41: Japan Physical Vapor Deposition Equipment Industry Revenue (Million) Forecast, by Application 2019 & 2032
- Table 42: Japan Physical Vapor Deposition Equipment Industry Volume (K Unit) Forecast, by Application 2019 & 2032
- Table 43: India Physical Vapor Deposition Equipment Industry Revenue (Million) Forecast, by Application 2019 & 2032
- Table 44: India Physical Vapor Deposition Equipment Industry Volume (K Unit) Forecast, by Application 2019 & 2032
- Table 45: South Korea Physical Vapor Deposition Equipment Industry Revenue (Million) Forecast, by Application 2019 & 2032
- Table 46: South Korea Physical Vapor Deposition Equipment Industry Volume (K Unit) Forecast, by Application 2019 & 2032
- Table 47: Southeast Asia Physical Vapor Deposition Equipment Industry Revenue (Million) Forecast, by Application 2019 & 2032
- Table 48: Southeast Asia Physical Vapor Deposition Equipment Industry Volume (K Unit) Forecast, by Application 2019 & 2032
- Table 49: Australia Physical Vapor Deposition Equipment Industry Revenue (Million) Forecast, by Application 2019 & 2032
- Table 50: Australia Physical Vapor Deposition Equipment Industry Volume (K Unit) Forecast, by Application 2019 & 2032
- Table 51: Indonesia Physical Vapor Deposition Equipment Industry Revenue (Million) Forecast, by Application 2019 & 2032
- Table 52: Indonesia Physical Vapor Deposition Equipment Industry Volume (K Unit) Forecast, by Application 2019 & 2032
- Table 53: Phillipes Physical Vapor Deposition Equipment Industry Revenue (Million) Forecast, by Application 2019 & 2032
- Table 54: Phillipes Physical Vapor Deposition Equipment Industry Volume (K Unit) Forecast, by Application 2019 & 2032
- Table 55: Singapore Physical Vapor Deposition Equipment Industry Revenue (Million) Forecast, by Application 2019 & 2032
- Table 56: Singapore Physical Vapor Deposition Equipment Industry Volume (K Unit) Forecast, by Application 2019 & 2032
- Table 57: Thailandc Physical Vapor Deposition Equipment Industry Revenue (Million) Forecast, by Application 2019 & 2032
- Table 58: Thailandc Physical Vapor Deposition Equipment Industry Volume (K Unit) Forecast, by Application 2019 & 2032
- Table 59: Rest of Asia Pacific Physical Vapor Deposition Equipment Industry Revenue (Million) Forecast, by Application 2019 & 2032
- Table 60: Rest of Asia Pacific Physical Vapor Deposition Equipment Industry Volume (K Unit) Forecast, by Application 2019 & 2032
- Table 61: Global Physical Vapor Deposition Equipment Industry Revenue Million Forecast, by Country 2019 & 2032
- Table 62: Global Physical Vapor Deposition Equipment Industry Volume K Unit Forecast, by Country 2019 & 2032
- Table 63: Brazil Physical Vapor Deposition Equipment Industry Revenue (Million) Forecast, by Application 2019 & 2032
- Table 64: Brazil Physical Vapor Deposition Equipment Industry Volume (K Unit) Forecast, by Application 2019 & 2032
- Table 65: Argentina Physical Vapor Deposition Equipment Industry Revenue (Million) Forecast, by Application 2019 & 2032
- Table 66: Argentina Physical Vapor Deposition Equipment Industry Volume (K Unit) Forecast, by Application 2019 & 2032
- Table 67: Peru Physical Vapor Deposition Equipment Industry Revenue (Million) Forecast, by Application 2019 & 2032
- Table 68: Peru Physical Vapor Deposition Equipment Industry Volume (K Unit) Forecast, by Application 2019 & 2032
- Table 69: Chile Physical Vapor Deposition Equipment Industry Revenue (Million) Forecast, by Application 2019 & 2032
- Table 70: Chile Physical Vapor Deposition Equipment Industry Volume (K Unit) Forecast, by Application 2019 & 2032
- Table 71: Colombia Physical Vapor Deposition Equipment Industry Revenue (Million) Forecast, by Application 2019 & 2032
- Table 72: Colombia Physical Vapor Deposition Equipment Industry Volume (K Unit) Forecast, by Application 2019 & 2032
- Table 73: Ecuador Physical Vapor Deposition Equipment Industry Revenue (Million) Forecast, by Application 2019 & 2032
- Table 74: Ecuador Physical Vapor Deposition Equipment Industry Volume (K Unit) Forecast, by Application 2019 & 2032
- Table 75: Venezuela Physical Vapor Deposition Equipment Industry Revenue (Million) Forecast, by Application 2019 & 2032
- Table 76: Venezuela Physical Vapor Deposition Equipment Industry Volume (K Unit) Forecast, by Application 2019 & 2032
- Table 77: Rest of South America Physical Vapor Deposition Equipment Industry Revenue (Million) Forecast, by Application 2019 & 2032
- Table 78: Rest of South America Physical Vapor Deposition Equipment Industry Volume (K Unit) Forecast, by Application 2019 & 2032
- Table 79: Global Physical Vapor Deposition Equipment Industry Revenue Million Forecast, by Country 2019 & 2032
- Table 80: Global Physical Vapor Deposition Equipment Industry Volume K Unit Forecast, by Country 2019 & 2032
- Table 81: United States Physical Vapor Deposition Equipment Industry Revenue (Million) Forecast, by Application 2019 & 2032
- Table 82: United States Physical Vapor Deposition Equipment Industry Volume (K Unit) Forecast, by Application 2019 & 2032
- Table 83: Canada Physical Vapor Deposition Equipment Industry Revenue (Million) Forecast, by Application 2019 & 2032
- Table 84: Canada Physical Vapor Deposition Equipment Industry Volume (K Unit) Forecast, by Application 2019 & 2032
- Table 85: Mexico Physical Vapor Deposition Equipment Industry Revenue (Million) Forecast, by Application 2019 & 2032
- Table 86: Mexico Physical Vapor Deposition Equipment Industry Volume (K Unit) Forecast, by Application 2019 & 2032
- Table 87: Global Physical Vapor Deposition Equipment Industry Revenue Million Forecast, by Country 2019 & 2032
- Table 88: Global Physical Vapor Deposition Equipment Industry Volume K Unit Forecast, by Country 2019 & 2032
- Table 89: United Arab Emirates Physical Vapor Deposition Equipment Industry Revenue (Million) Forecast, by Application 2019 & 2032
- Table 90: United Arab Emirates Physical Vapor Deposition Equipment Industry Volume (K Unit) Forecast, by Application 2019 & 2032
- Table 91: Saudi Arabia Physical Vapor Deposition Equipment Industry Revenue (Million) Forecast, by Application 2019 & 2032
- Table 92: Saudi Arabia Physical Vapor Deposition Equipment Industry Volume (K Unit) Forecast, by Application 2019 & 2032
- Table 93: South Africa Physical Vapor Deposition Equipment Industry Revenue (Million) Forecast, by Application 2019 & 2032
- Table 94: South Africa Physical Vapor Deposition Equipment Industry Volume (K Unit) Forecast, by Application 2019 & 2032
- Table 95: Rest of Middle East and Africa Physical Vapor Deposition Equipment Industry Revenue (Million) Forecast, by Application 2019 & 2032
- Table 96: Rest of Middle East and Africa Physical Vapor Deposition Equipment Industry Volume (K Unit) Forecast, by Application 2019 & 2032
- Table 97: Global Physical Vapor Deposition Equipment Industry Revenue Million Forecast, by End User 2019 & 2032
- Table 98: Global Physical Vapor Deposition Equipment Industry Volume K Unit Forecast, by End User 2019 & 2032
- Table 99: Global Physical Vapor Deposition Equipment Industry Revenue Million Forecast, by Country 2019 & 2032
- Table 100: Global Physical Vapor Deposition Equipment Industry Volume K Unit Forecast, by Country 2019 & 2032
- Table 101: Global Physical Vapor Deposition Equipment Industry Revenue Million Forecast, by End User 2019 & 2032
- Table 102: Global Physical Vapor Deposition Equipment Industry Volume K Unit Forecast, by End User 2019 & 2032
- Table 103: Global Physical Vapor Deposition Equipment Industry Revenue Million Forecast, by Country 2019 & 2032
- Table 104: Global Physical Vapor Deposition Equipment Industry Volume K Unit Forecast, by Country 2019 & 2032
- Table 105: Global Physical Vapor Deposition Equipment Industry Revenue Million Forecast, by End User 2019 & 2032
- Table 106: Global Physical Vapor Deposition Equipment Industry Volume K Unit Forecast, by End User 2019 & 2032
- Table 107: Global Physical Vapor Deposition Equipment Industry Revenue Million Forecast, by Country 2019 & 2032
- Table 108: Global Physical Vapor Deposition Equipment Industry Volume K Unit Forecast, by Country 2019 & 2032
- Table 109: Global Physical Vapor Deposition Equipment Industry Revenue Million Forecast, by End User 2019 & 2032
- Table 110: Global Physical Vapor Deposition Equipment Industry Volume K Unit Forecast, by End User 2019 & 2032
- Table 111: Global Physical Vapor Deposition Equipment Industry Revenue Million Forecast, by Country 2019 & 2032
- Table 112: Global Physical Vapor Deposition Equipment Industry Volume K Unit Forecast, by Country 2019 & 2032
Frequently Asked Questions
1. What is the projected Compound Annual Growth Rate (CAGR) of the Physical Vapor Deposition Equipment Industry?
The projected CAGR is approximately 8.90%.
2. Which companies are prominent players in the Physical Vapor Deposition Equipment Industry?
Key companies in the market include Veeco Instruments Inc, Semicore Equipment Inc, Applied Materials Inc, Advanced Energy Industries Inc, Mustang Vacuum Systems LLC, IHI Corporatio, ULVAC Inc, Platit AG, Angstrom Engineering Inc, AJA International Inc, Oerlikon Balzers Coating AG.
3. What are the main segments of the Physical Vapor Deposition Equipment Industry?
The market segments include End User.
4. Can you provide details about the market size?
The market size is estimated to be USD XX Million as of 2022.
5. What are some drivers contributing to market growth?
; Rise in the Demand for Medical Devices and Equipment; Growing Demand for Microelectronics in Several Applications.
6. What are the notable trends driving market growth?
Medical Devices and Equipment is Expected to Boost the Market Growth.
7. Are there any restraints impacting market growth?
; High Capital Investment.
8. Can you provide examples of recent developments in the market?
N/A
9. What pricing options are available for accessing the report?
Pricing options include single-user, multi-user, and enterprise licenses priced at USD 4750, USD 5250, and USD 8750 respectively.
10. Is the market size provided in terms of value or volume?
The market size is provided in terms of value, measured in Million and volume, measured in K Unit.
11. Are there any specific market keywords associated with the report?
Yes, the market keyword associated with the report is "Physical Vapor Deposition Equipment Industry," which aids in identifying and referencing the specific market segment covered.
12. How do I determine which pricing option suits my needs best?
The pricing options vary based on user requirements and access needs. Individual users may opt for single-user licenses, while businesses requiring broader access may choose multi-user or enterprise licenses for cost-effective access to the report.
13. Are there any additional resources or data provided in the Physical Vapor Deposition Equipment Industry report?
While the report offers comprehensive insights, it's advisable to review the specific contents or supplementary materials provided to ascertain if additional resources or data are available.
14. How can I stay updated on further developments or reports in the Physical Vapor Deposition Equipment Industry?
To stay informed about further developments, trends, and reports in the Physical Vapor Deposition Equipment Industry, consider subscribing to industry newsletters, following relevant companies and organizations, or regularly checking reputable industry news sources and publications.
Methodology
Step 1 - Identification of Relevant Samples Size from Population Database


Step 2 - Approaches for Defining Global Market Size (Value, Volume* & Price*)

Note*: In applicable scenarios
Step 3 - Data Sources
Primary Research
- Web Analytics
- Survey Reports
- Research Institute
- Latest Research Reports
- Opinion Leaders
Secondary Research
- Annual Reports
- White Paper
- Latest Press Release
- Industry Association
- Paid Database
- Investor Presentations

Step 4 - Data Triangulation
Involves using different sources of information in order to increase the validity of a study
These sources are likely to be stakeholders in a program - participants, other researchers, program staff, other community members, and so on.
Then we put all data in single framework & apply various statistical tools to find out the dynamic on the market.
During the analysis stage, feedback from the stakeholder groups would be compared to determine areas of agreement as well as areas of divergence
