

Key Insights
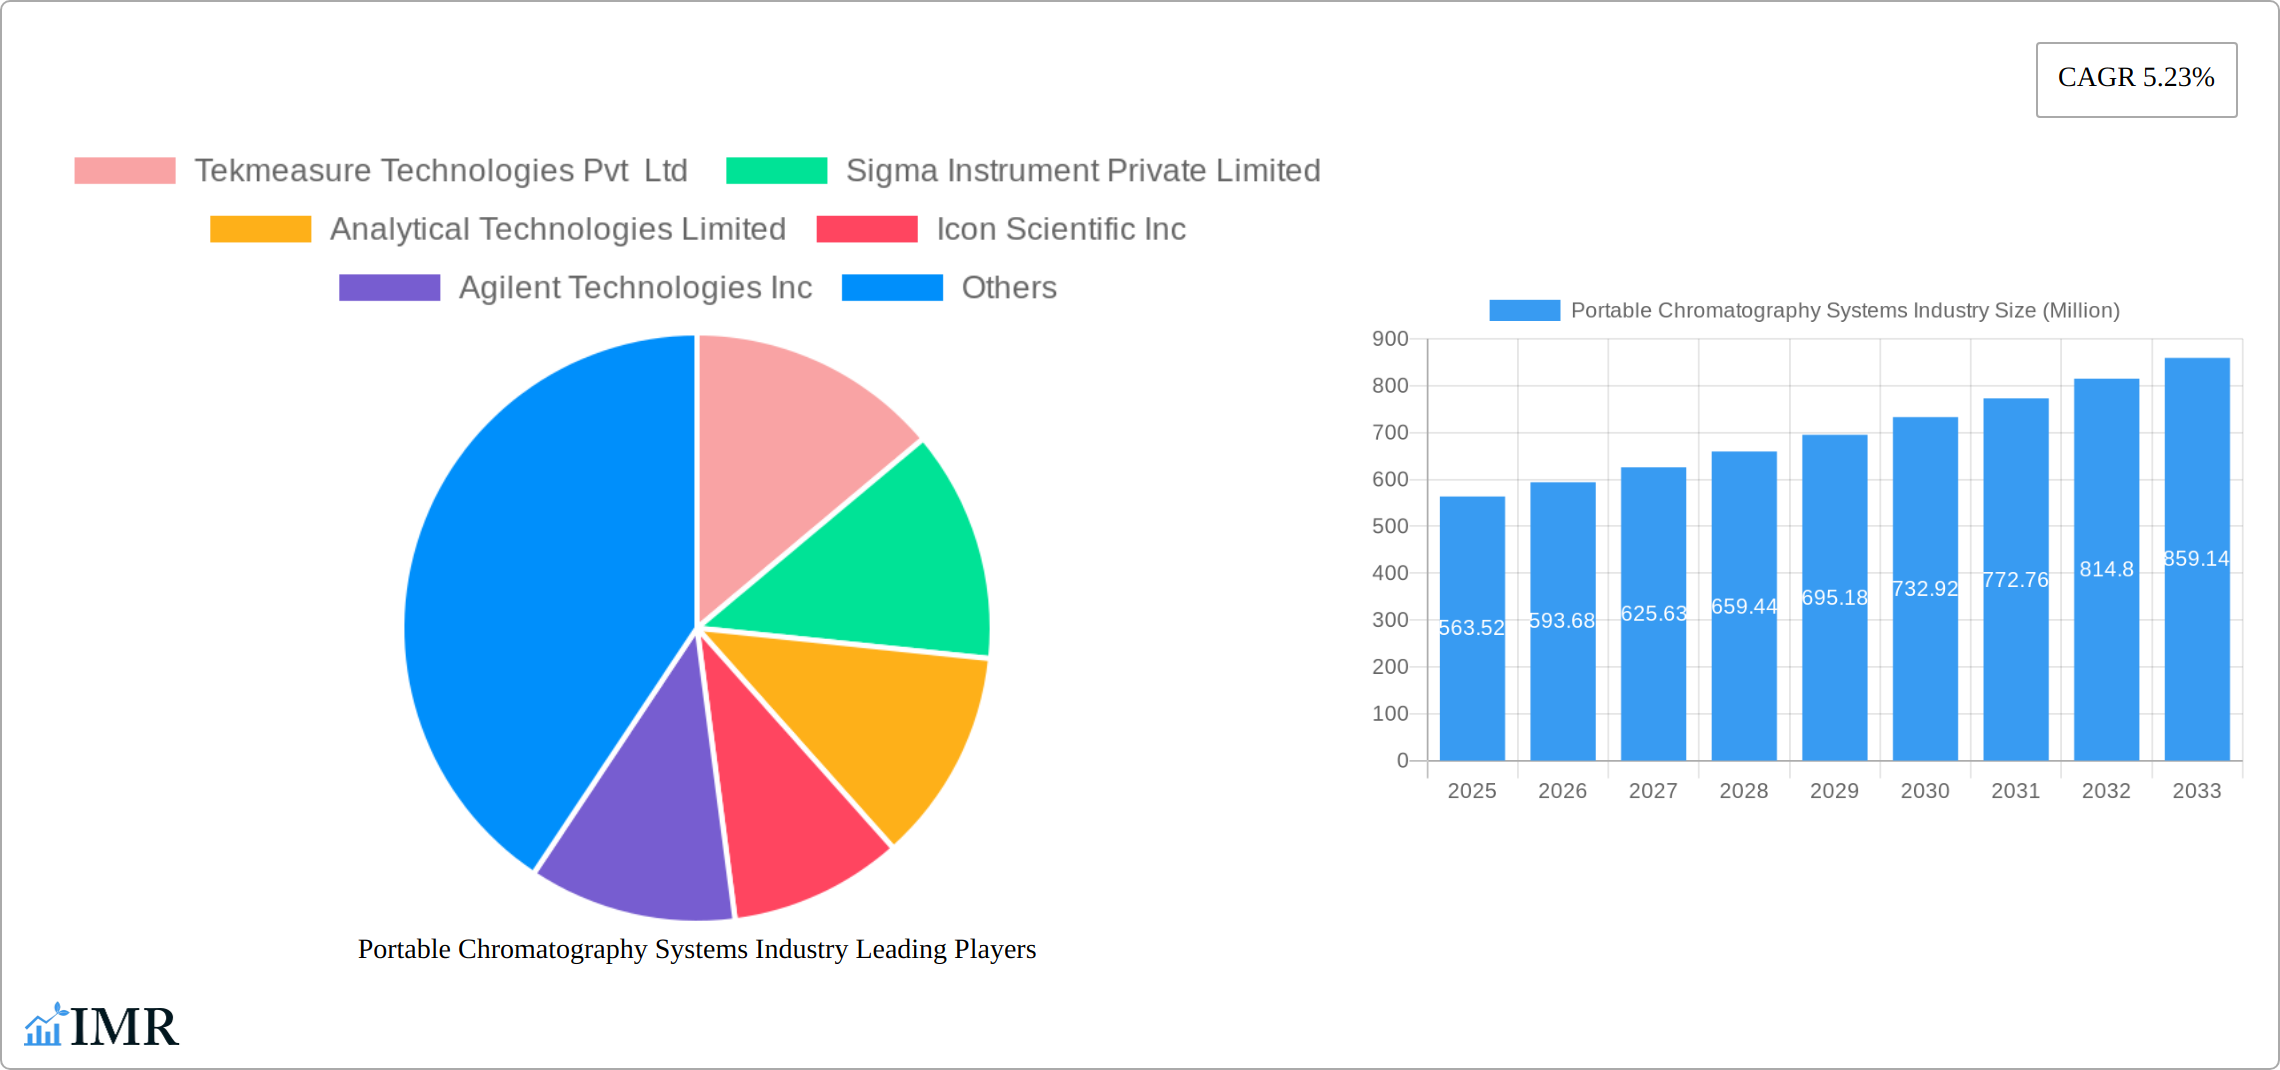
The portable chromatography systems market, valued at $563.52 million in 2025, is projected to experience robust growth, driven by increasing demand for on-site testing and analysis across various sectors. The market's Compound Annual Growth Rate (CAGR) of 5.23% from 2025 to 2033 reflects a consistent upward trajectory fueled by several key factors. The rising adoption of portable chromatography systems in the biotechnology and pharmaceutical industries for quality control and drug discovery is a significant driver. Research laboratories also contribute significantly, leveraging these systems for faster and more efficient analysis in diverse fields like environmental monitoring and food safety. Technological advancements leading to smaller, more user-friendly, and robust instruments further enhance market appeal. The increasing need for rapid, real-time analysis in remote locations or field settings, particularly within environmental monitoring and forensic science, also significantly boosts market growth. Person-portable systems are gaining traction, owing to their ease of use and portability advantages over larger, transportable systems. Within the product types, portable gas chromatography systems currently hold a larger market share than liquid chromatography systems, although the latter is anticipated to witness considerable growth driven by its applicability in broader analytical needs. Market segmentation by end-user, portability, and type provides a detailed overview of the market's multifaceted nature and growth potential. Growth is geographically diverse, with North America and Europe currently dominating the market, while the Asia-Pacific region is poised for significant expansion due to increasing research and development activities and economic growth.
Despite the positive outlook, the market faces certain restraints. High initial investment costs for sophisticated systems and the need for skilled technicians for operation and maintenance could limit adoption, particularly among smaller organizations. Furthermore, potential regulatory hurdles and evolving technological standards might pose challenges for market players. However, ongoing innovations focused on reducing costs and enhancing user-friendliness, coupled with the growing demand for point-of-care diagnostics and rapid analysis capabilities, are anticipated to outweigh these challenges and propel the market towards continued expansion throughout the forecast period. The competitive landscape includes both established players and emerging companies actively contributing to market innovation and expansion.
Portable Chromatography Systems Industry: A Comprehensive Market Report (2019-2033)
This comprehensive report provides an in-depth analysis of the portable chromatography systems market, encompassing market dynamics, growth trends, regional dominance, product landscape, key players, and future outlook. The study period covers 2019-2033, with 2025 as the base and estimated year. The forecast period spans 2025-2033, and the historical period covers 2019-2024. This report is crucial for industry professionals, investors, and researchers seeking a clear understanding of this rapidly evolving market.
Portable Chromatography Systems Industry Market Dynamics & Structure
The portable chromatography systems market, a sub-segment of the larger analytical instrumentation market, is experiencing significant growth driven by increasing demand from biotechnology and pharmaceutical companies, research laboratories, and other end-users. Market concentration is moderate, with several key players holding substantial market share, while smaller niche players cater to specific applications. Technological innovation, particularly in miniaturization and portability, is a primary driver. Regulatory frameworks, including those governing the use of analytical instruments in various industries, significantly influence market adoption. The emergence of alternative analytical techniques presents a competitive threat, though the inherent advantages of portability continue to drive demand. Mergers and acquisitions (M&A) activity has been moderate, with strategic alliances focused on expanding product portfolios and geographical reach. The overall market size in 2025 is estimated at $xx Million.
- Market Concentration: Moderate, with top 5 players holding approximately xx% market share in 2025.
- Technological Innovation: Miniaturization, improved sensitivity, wireless connectivity, and user-friendly interfaces are key drivers.
- Regulatory Framework: Compliance with international standards (e.g., FDA, ISO) influences market adoption and product development.
- Competitive Substitutes: Spectroscopy and other analytical techniques pose a competitive challenge.
- End-User Demographics: Biotechnology and pharmaceutical companies dominate the end-user segment.
- M&A Trends: A moderate level of M&A activity aimed at strategic expansion and technological acquisition.
Portable Chromatography Systems Industry Growth Trends & Insights
The portable chromatography systems market has witnessed consistent growth during the historical period (2019-2024), driven by technological advancements, increasing demand for point-of-care diagnostics, and the growing prevalence of on-site testing. The market is expected to maintain a healthy Compound Annual Growth Rate (CAGR) of xx% during the forecast period (2025-2033), reaching an estimated market size of $xx Million by 2033. This growth is fueled by rising adoption rates in emerging economies, technological disruptions leading to more robust and user-friendly devices, and changing consumer behavior favoring rapid and accessible analytical solutions. Market penetration in key regions is expected to increase significantly, particularly in developing countries with growing healthcare infrastructure. Advancements in sensor technology, artificial intelligence, and miniaturization further contribute to market expansion.

Dominant Regions, Countries, or Segments in Portable Chromatography Systems Industry
North America currently holds the largest market share in the portable chromatography systems industry, driven by strong R&D investments, the presence of major players, and well-established healthcare infrastructure. Within North America, the United States holds a significant portion of this share. Europe follows as a major market, with robust adoption across various end-user segments. Asia Pacific is demonstrating the fastest growth rate, propelled by increasing healthcare spending, expanding research activities, and the rising adoption of portable chromatography systems in emerging economies like India and China.
Dominant Region: North America (Market share xx% in 2025)
Fastest Growing Region: Asia Pacific (CAGR xx% during 2025-2033)
Dominant End-User Segment: Biotechnology and Pharmaceutical Companies (Market share xx% in 2025)
Dominant Portability Type: Transportable (Market share xx% in 2025)
Dominant Type: Portable Liquid Chromatography Systems (Market share xx% in 2025)
Key Drivers for North America: Strong R&D investments, well-established healthcare infrastructure, presence of major industry players.
Key Drivers for Asia Pacific: Rising healthcare expenditure, expanding research activities, increasing adoption in emerging economies.
Key Drivers for Europe: Robust research and development activities and increasing demand for point-of-care testing.
Portable Chromatography Systems Industry Product Landscape
Portable chromatography systems are evolving rapidly, featuring increasingly miniaturized designs, enhanced sensitivity, improved data analysis capabilities, and simplified user interfaces. Innovations include the integration of wireless connectivity for remote data access and improved portability for diverse field applications. Unique selling propositions include faster analysis times, reduced sample volumes, and lower operational costs compared to traditional laboratory-based systems. The market offers a range of portable gas chromatography (GC) and liquid chromatography (LC) systems tailored to specific analytical needs.
Key Drivers, Barriers & Challenges in Portable Chromatography Systems Industry
Key Drivers:
- Increasing demand for point-of-care diagnostics and rapid on-site analysis.
- Technological advancements in miniaturization, sensitivity, and user-friendliness.
- Growing investments in R&D by major players and emerging companies.
- Government initiatives promoting advanced analytical technologies.
Key Challenges:
- High initial investment costs associated with purchasing portable chromatography systems.
- Limited availability of trained personnel to operate and maintain these systems, especially in developing regions.
- The need for robust quality control and regulatory compliance protocols.
- Potential supply chain disruptions affecting the availability of critical components.
Emerging Opportunities in Portable Chromatography Systems Industry
- Expanding applications in environmental monitoring and food safety testing.
- Growth in point-of-care diagnostics for various medical conditions.
- Increasing demand from developing countries with growing healthcare infrastructure.
- Development of portable chromatography systems integrated with advanced data analytics and artificial intelligence.
Growth Accelerators in the Portable Chromatography Systems Industry Industry
The long-term growth of the portable chromatography systems market is further enhanced by strategic partnerships between instrument manufacturers and software developers to integrate advanced data analytics and cloud-based solutions. Technological breakthroughs in miniaturization and sensor technology are continually improving the performance and affordability of these systems. Expansion into new geographical markets, particularly in developing economies, presents significant growth opportunities.
Key Players Shaping the Portable Chromatography Systems Market
- Tekmeasure Technologies Pvt Ltd
- Sigma Instrument Private Limited
- Analytical Technologies Limited
- Icon Scientific Inc
- Agilent Technologies Inc
- PerkinElmer Inc
- INFICON
- Axcend
- FLIR Systems Inc
Notable Milestones in Portable Chromatography Systems Industry Sector
- 2020: Agilent Technologies launched a new portable GC system with improved sensitivity and user-friendliness.
- 2022: PerkinElmer acquired a smaller company specializing in portable LC technology, expanding its product portfolio.
- 2023: Several companies announced partnerships to integrate AI capabilities into their portable chromatography systems.
In-Depth Portable Chromatography Systems Industry Market Outlook
The future of the portable chromatography systems market is exceptionally promising. Continued technological advancements, expanding applications in diverse sectors, and increased adoption in emerging markets will fuel substantial growth over the next decade. Strategic partnerships, focusing on integrating advanced data analytics and AI, will create new opportunities and drive market expansion. The market is poised for significant growth, presenting attractive investment opportunities for companies and stakeholders across the value chain.
Portable Chromatography Systems Industry Segmentation
-
1. Portability
- 1.1. Person Portable
- 1.2. Transportable
-
2. Type
- 2.1. Portable Gas Chromatography Systems
- 2.2. Portable Liquid Chromatography Systems
-
3. End-User
- 3.1. Biotechnology and Pharmaceutical Companies
- 3.2. Research Laboratories
- 3.3. Others
Portable Chromatography Systems Industry Segmentation By Geography
-
1. North America
- 1.1. United States
- 1.2. Canada
- 1.3. Mexico
-
2. Europe
- 2.1. Germany
- 2.2. United Kingdom
- 2.3. France
- 2.4. Italy
- 2.5. Spain
- 2.6. Rest of Europe
-
3. Asia Pacific
- 3.1. China
- 3.2. Japan
- 3.3. India
- 3.4. Australia
- 3.5. South Korea
- 3.6. Rest of Asia Pacific
-
4. Middle East and Africa
- 4.1. GCC
- 4.2. South Africa
- 4.3. Rest of Middle East and Africa
-
5. South America
- 5.1. Brazil
- 5.2. Argentina
- 5.3. Rest of South America

Portable Chromatography Systems Industry REPORT HIGHLIGHTS
| Aspects | Details |
|---|---|
| Study Period | 2019-2033 |
| Base Year | 2024 |
| Estimated Year | 2025 |
| Forecast Period | 2025-2033 |
| Historical Period | 2019-2024 |
| Growth Rate | CAGR of 5.23% from 2019-2033 |
| Segmentation |
|
Table of Contents
- 1. Introduction
- 1.1. Research Scope
- 1.2. Market Segmentation
- 1.3. Research Methodology
- 1.4. Definitions and Assumptions
- 2. Executive Summary
- 2.1. Introduction
- 3. Market Dynamics
- 3.1. Introduction
- 3.2. Market Drivers
- 3.2.1. ; Advancements in Device Technologies; Growing Applications of Portable Chromatography Systems
- 3.3. Market Restrains
- 3.3.1. ; High Cost of Portable Chromatography Techniques
- 3.4. Market Trends
- 3.4.1. Transportable Chromatography Systems to Grow at a Significant Rate
- 4. Market Factor Analysis
- 4.1. Porters Five Forces
- 4.2. Supply/Value Chain
- 4.3. PESTEL analysis
- 4.4. Market Entropy
- 4.5. Patent/Trademark Analysis
- 5. Global Portable Chromatography Systems Industry Analysis, Insights and Forecast, 2019-2031
- 5.1. Market Analysis, Insights and Forecast - by Portability
- 5.1.1. Person Portable
- 5.1.2. Transportable
- 5.2. Market Analysis, Insights and Forecast - by Type
- 5.2.1. Portable Gas Chromatography Systems
- 5.2.2. Portable Liquid Chromatography Systems
- 5.3. Market Analysis, Insights and Forecast - by End-User
- 5.3.1. Biotechnology and Pharmaceutical Companies
- 5.3.2. Research Laboratories
- 5.3.3. Others
- 5.4. Market Analysis, Insights and Forecast - by Region
- 5.4.1. North America
- 5.4.2. Europe
- 5.4.3. Asia Pacific
- 5.4.4. Middle East and Africa
- 5.4.5. South America
- 5.1. Market Analysis, Insights and Forecast - by Portability
- 6. North America Portable Chromatography Systems Industry Analysis, Insights and Forecast, 2019-2031
- 6.1. Market Analysis, Insights and Forecast - by Portability
- 6.1.1. Person Portable
- 6.1.2. Transportable
- 6.2. Market Analysis, Insights and Forecast - by Type
- 6.2.1. Portable Gas Chromatography Systems
- 6.2.2. Portable Liquid Chromatography Systems
- 6.3. Market Analysis, Insights and Forecast - by End-User
- 6.3.1. Biotechnology and Pharmaceutical Companies
- 6.3.2. Research Laboratories
- 6.3.3. Others
- 6.1. Market Analysis, Insights and Forecast - by Portability
- 7. Europe Portable Chromatography Systems Industry Analysis, Insights and Forecast, 2019-2031
- 7.1. Market Analysis, Insights and Forecast - by Portability
- 7.1.1. Person Portable
- 7.1.2. Transportable
- 7.2. Market Analysis, Insights and Forecast - by Type
- 7.2.1. Portable Gas Chromatography Systems
- 7.2.2. Portable Liquid Chromatography Systems
- 7.3. Market Analysis, Insights and Forecast - by End-User
- 7.3.1. Biotechnology and Pharmaceutical Companies
- 7.3.2. Research Laboratories
- 7.3.3. Others
- 7.1. Market Analysis, Insights and Forecast - by Portability
- 8. Asia Pacific Portable Chromatography Systems Industry Analysis, Insights and Forecast, 2019-2031
- 8.1. Market Analysis, Insights and Forecast - by Portability
- 8.1.1. Person Portable
- 8.1.2. Transportable
- 8.2. Market Analysis, Insights and Forecast - by Type
- 8.2.1. Portable Gas Chromatography Systems
- 8.2.2. Portable Liquid Chromatography Systems
- 8.3. Market Analysis, Insights and Forecast - by End-User
- 8.3.1. Biotechnology and Pharmaceutical Companies
- 8.3.2. Research Laboratories
- 8.3.3. Others
- 8.1. Market Analysis, Insights and Forecast - by Portability
- 9. Middle East and Africa Portable Chromatography Systems Industry Analysis, Insights and Forecast, 2019-2031
- 9.1. Market Analysis, Insights and Forecast - by Portability
- 9.1.1. Person Portable
- 9.1.2. Transportable
- 9.2. Market Analysis, Insights and Forecast - by Type
- 9.2.1. Portable Gas Chromatography Systems
- 9.2.2. Portable Liquid Chromatography Systems
- 9.3. Market Analysis, Insights and Forecast - by End-User
- 9.3.1. Biotechnology and Pharmaceutical Companies
- 9.3.2. Research Laboratories
- 9.3.3. Others
- 9.1. Market Analysis, Insights and Forecast - by Portability
- 10. South America Portable Chromatography Systems Industry Analysis, Insights and Forecast, 2019-2031
- 10.1. Market Analysis, Insights and Forecast - by Portability
- 10.1.1. Person Portable
- 10.1.2. Transportable
- 10.2. Market Analysis, Insights and Forecast - by Type
- 10.2.1. Portable Gas Chromatography Systems
- 10.2.2. Portable Liquid Chromatography Systems
- 10.3. Market Analysis, Insights and Forecast - by End-User
- 10.3.1. Biotechnology and Pharmaceutical Companies
- 10.3.2. Research Laboratories
- 10.3.3. Others
- 10.1. Market Analysis, Insights and Forecast - by Portability
- 11. North America Portable Chromatography Systems Industry Analysis, Insights and Forecast, 2019-2031
- 11.1. Market Analysis, Insights and Forecast - By Country/Sub-region
- 11.1.1 United States
- 11.1.2 Canada
- 11.1.3 Mexico
- 12. Europe Portable Chromatography Systems Industry Analysis, Insights and Forecast, 2019-2031
- 12.1. Market Analysis, Insights and Forecast - By Country/Sub-region
- 12.1.1 Germany
- 12.1.2 United Kingdom
- 12.1.3 France
- 12.1.4 Italy
- 12.1.5 Spain
- 12.1.6 Rest of Europe
- 13. Asia Pacific Portable Chromatography Systems Industry Analysis, Insights and Forecast, 2019-2031
- 13.1. Market Analysis, Insights and Forecast - By Country/Sub-region
- 13.1.1 China
- 13.1.2 Japan
- 13.1.3 India
- 13.1.4 Australia
- 13.1.5 South Korea
- 13.1.6 Rest of Asia Pacific
- 14. Middle East and Africa Portable Chromatography Systems Industry Analysis, Insights and Forecast, 2019-2031
- 14.1. Market Analysis, Insights and Forecast - By Country/Sub-region
- 14.1.1 GCC
- 14.1.2 South Africa
- 14.1.3 Rest of Middle East and Africa
- 15. South America Portable Chromatography Systems Industry Analysis, Insights and Forecast, 2019-2031
- 15.1. Market Analysis, Insights and Forecast - By Country/Sub-region
- 15.1.1 Brazil
- 15.1.2 Argentina
- 15.1.3 Rest of South America
- 16. Competitive Analysis
- 16.1. Global Market Share Analysis 2024
- 16.2. Company Profiles
- 16.2.1 Tekmeasure Technologies Pvt Ltd
- 16.2.1.1. Overview
- 16.2.1.2. Products
- 16.2.1.3. SWOT Analysis
- 16.2.1.4. Recent Developments
- 16.2.1.5. Financials (Based on Availability)
- 16.2.2 Sigma Instrument Private Limited
- 16.2.2.1. Overview
- 16.2.2.2. Products
- 16.2.2.3. SWOT Analysis
- 16.2.2.4. Recent Developments
- 16.2.2.5. Financials (Based on Availability)
- 16.2.3 Analytical Technologies Limited
- 16.2.3.1. Overview
- 16.2.3.2. Products
- 16.2.3.3. SWOT Analysis
- 16.2.3.4. Recent Developments
- 16.2.3.5. Financials (Based on Availability)
- 16.2.4 Icon Scientific Inc
- 16.2.4.1. Overview
- 16.2.4.2. Products
- 16.2.4.3. SWOT Analysis
- 16.2.4.4. Recent Developments
- 16.2.4.5. Financials (Based on Availability)
- 16.2.5 Agilent Technologies Inc
- 16.2.5.1. Overview
- 16.2.5.2. Products
- 16.2.5.3. SWOT Analysis
- 16.2.5.4. Recent Developments
- 16.2.5.5. Financials (Based on Availability)
- 16.2.6 PerkinElmer Inc
- 16.2.6.1. Overview
- 16.2.6.2. Products
- 16.2.6.3. SWOT Analysis
- 16.2.6.4. Recent Developments
- 16.2.6.5. Financials (Based on Availability)
- 16.2.7 INFICON
- 16.2.7.1. Overview
- 16.2.7.2. Products
- 16.2.7.3. SWOT Analysis
- 16.2.7.4. Recent Developments
- 16.2.7.5. Financials (Based on Availability)
- 16.2.8 Axcend
- 16.2.8.1. Overview
- 16.2.8.2. Products
- 16.2.8.3. SWOT Analysis
- 16.2.8.4. Recent Developments
- 16.2.8.5. Financials (Based on Availability)
- 16.2.9 FLIR Systems Inc
- 16.2.9.1. Overview
- 16.2.9.2. Products
- 16.2.9.3. SWOT Analysis
- 16.2.9.4. Recent Developments
- 16.2.9.5. Financials (Based on Availability)
- 16.2.1 Tekmeasure Technologies Pvt Ltd
List of Figures
- Figure 1: Global Portable Chromatography Systems Industry Revenue Breakdown (Million, %) by Region 2024 & 2032
- Figure 2: Global Portable Chromatography Systems Industry Volume Breakdown (K Unit, %) by Region 2024 & 2032
- Figure 3: North America Portable Chromatography Systems Industry Revenue (Million), by Country 2024 & 2032
- Figure 4: North America Portable Chromatography Systems Industry Volume (K Unit), by Country 2024 & 2032
- Figure 5: North America Portable Chromatography Systems Industry Revenue Share (%), by Country 2024 & 2032
- Figure 6: North America Portable Chromatography Systems Industry Volume Share (%), by Country 2024 & 2032
- Figure 7: Europe Portable Chromatography Systems Industry Revenue (Million), by Country 2024 & 2032
- Figure 8: Europe Portable Chromatography Systems Industry Volume (K Unit), by Country 2024 & 2032
- Figure 9: Europe Portable Chromatography Systems Industry Revenue Share (%), by Country 2024 & 2032
- Figure 10: Europe Portable Chromatography Systems Industry Volume Share (%), by Country 2024 & 2032
- Figure 11: Asia Pacific Portable Chromatography Systems Industry Revenue (Million), by Country 2024 & 2032
- Figure 12: Asia Pacific Portable Chromatography Systems Industry Volume (K Unit), by Country 2024 & 2032
- Figure 13: Asia Pacific Portable Chromatography Systems Industry Revenue Share (%), by Country 2024 & 2032
- Figure 14: Asia Pacific Portable Chromatography Systems Industry Volume Share (%), by Country 2024 & 2032
- Figure 15: Middle East and Africa Portable Chromatography Systems Industry Revenue (Million), by Country 2024 & 2032
- Figure 16: Middle East and Africa Portable Chromatography Systems Industry Volume (K Unit), by Country 2024 & 2032
- Figure 17: Middle East and Africa Portable Chromatography Systems Industry Revenue Share (%), by Country 2024 & 2032
- Figure 18: Middle East and Africa Portable Chromatography Systems Industry Volume Share (%), by Country 2024 & 2032
- Figure 19: South America Portable Chromatography Systems Industry Revenue (Million), by Country 2024 & 2032
- Figure 20: South America Portable Chromatography Systems Industry Volume (K Unit), by Country 2024 & 2032
- Figure 21: South America Portable Chromatography Systems Industry Revenue Share (%), by Country 2024 & 2032
- Figure 22: South America Portable Chromatography Systems Industry Volume Share (%), by Country 2024 & 2032
- Figure 23: North America Portable Chromatography Systems Industry Revenue (Million), by Portability 2024 & 2032
- Figure 24: North America Portable Chromatography Systems Industry Volume (K Unit), by Portability 2024 & 2032
- Figure 25: North America Portable Chromatography Systems Industry Revenue Share (%), by Portability 2024 & 2032
- Figure 26: North America Portable Chromatography Systems Industry Volume Share (%), by Portability 2024 & 2032
- Figure 27: North America Portable Chromatography Systems Industry Revenue (Million), by Type 2024 & 2032
- Figure 28: North America Portable Chromatography Systems Industry Volume (K Unit), by Type 2024 & 2032
- Figure 29: North America Portable Chromatography Systems Industry Revenue Share (%), by Type 2024 & 2032
- Figure 30: North America Portable Chromatography Systems Industry Volume Share (%), by Type 2024 & 2032
- Figure 31: North America Portable Chromatography Systems Industry Revenue (Million), by End-User 2024 & 2032
- Figure 32: North America Portable Chromatography Systems Industry Volume (K Unit), by End-User 2024 & 2032
- Figure 33: North America Portable Chromatography Systems Industry Revenue Share (%), by End-User 2024 & 2032
- Figure 34: North America Portable Chromatography Systems Industry Volume Share (%), by End-User 2024 & 2032
- Figure 35: North America Portable Chromatography Systems Industry Revenue (Million), by Country 2024 & 2032
- Figure 36: North America Portable Chromatography Systems Industry Volume (K Unit), by Country 2024 & 2032
- Figure 37: North America Portable Chromatography Systems Industry Revenue Share (%), by Country 2024 & 2032
- Figure 38: North America Portable Chromatography Systems Industry Volume Share (%), by Country 2024 & 2032
- Figure 39: Europe Portable Chromatography Systems Industry Revenue (Million), by Portability 2024 & 2032
- Figure 40: Europe Portable Chromatography Systems Industry Volume (K Unit), by Portability 2024 & 2032
- Figure 41: Europe Portable Chromatography Systems Industry Revenue Share (%), by Portability 2024 & 2032
- Figure 42: Europe Portable Chromatography Systems Industry Volume Share (%), by Portability 2024 & 2032
- Figure 43: Europe Portable Chromatography Systems Industry Revenue (Million), by Type 2024 & 2032
- Figure 44: Europe Portable Chromatography Systems Industry Volume (K Unit), by Type 2024 & 2032
- Figure 45: Europe Portable Chromatography Systems Industry Revenue Share (%), by Type 2024 & 2032
- Figure 46: Europe Portable Chromatography Systems Industry Volume Share (%), by Type 2024 & 2032
- Figure 47: Europe Portable Chromatography Systems Industry Revenue (Million), by End-User 2024 & 2032
- Figure 48: Europe Portable Chromatography Systems Industry Volume (K Unit), by End-User 2024 & 2032
- Figure 49: Europe Portable Chromatography Systems Industry Revenue Share (%), by End-User 2024 & 2032
- Figure 50: Europe Portable Chromatography Systems Industry Volume Share (%), by End-User 2024 & 2032
- Figure 51: Europe Portable Chromatography Systems Industry Revenue (Million), by Country 2024 & 2032
- Figure 52: Europe Portable Chromatography Systems Industry Volume (K Unit), by Country 2024 & 2032
- Figure 53: Europe Portable Chromatography Systems Industry Revenue Share (%), by Country 2024 & 2032
- Figure 54: Europe Portable Chromatography Systems Industry Volume Share (%), by Country 2024 & 2032
- Figure 55: Asia Pacific Portable Chromatography Systems Industry Revenue (Million), by Portability 2024 & 2032
- Figure 56: Asia Pacific Portable Chromatography Systems Industry Volume (K Unit), by Portability 2024 & 2032
- Figure 57: Asia Pacific Portable Chromatography Systems Industry Revenue Share (%), by Portability 2024 & 2032
- Figure 58: Asia Pacific Portable Chromatography Systems Industry Volume Share (%), by Portability 2024 & 2032
- Figure 59: Asia Pacific Portable Chromatography Systems Industry Revenue (Million), by Type 2024 & 2032
- Figure 60: Asia Pacific Portable Chromatography Systems Industry Volume (K Unit), by Type 2024 & 2032
- Figure 61: Asia Pacific Portable Chromatography Systems Industry Revenue Share (%), by Type 2024 & 2032
- Figure 62: Asia Pacific Portable Chromatography Systems Industry Volume Share (%), by Type 2024 & 2032
- Figure 63: Asia Pacific Portable Chromatography Systems Industry Revenue (Million), by End-User 2024 & 2032
- Figure 64: Asia Pacific Portable Chromatography Systems Industry Volume (K Unit), by End-User 2024 & 2032
- Figure 65: Asia Pacific Portable Chromatography Systems Industry Revenue Share (%), by End-User 2024 & 2032
- Figure 66: Asia Pacific Portable Chromatography Systems Industry Volume Share (%), by End-User 2024 & 2032
- Figure 67: Asia Pacific Portable Chromatography Systems Industry Revenue (Million), by Country 2024 & 2032
- Figure 68: Asia Pacific Portable Chromatography Systems Industry Volume (K Unit), by Country 2024 & 2032
- Figure 69: Asia Pacific Portable Chromatography Systems Industry Revenue Share (%), by Country 2024 & 2032
- Figure 70: Asia Pacific Portable Chromatography Systems Industry Volume Share (%), by Country 2024 & 2032
- Figure 71: Middle East and Africa Portable Chromatography Systems Industry Revenue (Million), by Portability 2024 & 2032
- Figure 72: Middle East and Africa Portable Chromatography Systems Industry Volume (K Unit), by Portability 2024 & 2032
- Figure 73: Middle East and Africa Portable Chromatography Systems Industry Revenue Share (%), by Portability 2024 & 2032
- Figure 74: Middle East and Africa Portable Chromatography Systems Industry Volume Share (%), by Portability 2024 & 2032
- Figure 75: Middle East and Africa Portable Chromatography Systems Industry Revenue (Million), by Type 2024 & 2032
- Figure 76: Middle East and Africa Portable Chromatography Systems Industry Volume (K Unit), by Type 2024 & 2032
- Figure 77: Middle East and Africa Portable Chromatography Systems Industry Revenue Share (%), by Type 2024 & 2032
- Figure 78: Middle East and Africa Portable Chromatography Systems Industry Volume Share (%), by Type 2024 & 2032
- Figure 79: Middle East and Africa Portable Chromatography Systems Industry Revenue (Million), by End-User 2024 & 2032
- Figure 80: Middle East and Africa Portable Chromatography Systems Industry Volume (K Unit), by End-User 2024 & 2032
- Figure 81: Middle East and Africa Portable Chromatography Systems Industry Revenue Share (%), by End-User 2024 & 2032
- Figure 82: Middle East and Africa Portable Chromatography Systems Industry Volume Share (%), by End-User 2024 & 2032
- Figure 83: Middle East and Africa Portable Chromatography Systems Industry Revenue (Million), by Country 2024 & 2032
- Figure 84: Middle East and Africa Portable Chromatography Systems Industry Volume (K Unit), by Country 2024 & 2032
- Figure 85: Middle East and Africa Portable Chromatography Systems Industry Revenue Share (%), by Country 2024 & 2032
- Figure 86: Middle East and Africa Portable Chromatography Systems Industry Volume Share (%), by Country 2024 & 2032
- Figure 87: South America Portable Chromatography Systems Industry Revenue (Million), by Portability 2024 & 2032
- Figure 88: South America Portable Chromatography Systems Industry Volume (K Unit), by Portability 2024 & 2032
- Figure 89: South America Portable Chromatography Systems Industry Revenue Share (%), by Portability 2024 & 2032
- Figure 90: South America Portable Chromatography Systems Industry Volume Share (%), by Portability 2024 & 2032
- Figure 91: South America Portable Chromatography Systems Industry Revenue (Million), by Type 2024 & 2032
- Figure 92: South America Portable Chromatography Systems Industry Volume (K Unit), by Type 2024 & 2032
- Figure 93: South America Portable Chromatography Systems Industry Revenue Share (%), by Type 2024 & 2032
- Figure 94: South America Portable Chromatography Systems Industry Volume Share (%), by Type 2024 & 2032
- Figure 95: South America Portable Chromatography Systems Industry Revenue (Million), by End-User 2024 & 2032
- Figure 96: South America Portable Chromatography Systems Industry Volume (K Unit), by End-User 2024 & 2032
- Figure 97: South America Portable Chromatography Systems Industry Revenue Share (%), by End-User 2024 & 2032
- Figure 98: South America Portable Chromatography Systems Industry Volume Share (%), by End-User 2024 & 2032
- Figure 99: South America Portable Chromatography Systems Industry Revenue (Million), by Country 2024 & 2032
- Figure 100: South America Portable Chromatography Systems Industry Volume (K Unit), by Country 2024 & 2032
- Figure 101: South America Portable Chromatography Systems Industry Revenue Share (%), by Country 2024 & 2032
- Figure 102: South America Portable Chromatography Systems Industry Volume Share (%), by Country 2024 & 2032
List of Tables
- Table 1: Global Portable Chromatography Systems Industry Revenue Million Forecast, by Region 2019 & 2032
- Table 2: Global Portable Chromatography Systems Industry Volume K Unit Forecast, by Region 2019 & 2032
- Table 3: Global Portable Chromatography Systems Industry Revenue Million Forecast, by Portability 2019 & 2032
- Table 4: Global Portable Chromatography Systems Industry Volume K Unit Forecast, by Portability 2019 & 2032
- Table 5: Global Portable Chromatography Systems Industry Revenue Million Forecast, by Type 2019 & 2032
- Table 6: Global Portable Chromatography Systems Industry Volume K Unit Forecast, by Type 2019 & 2032
- Table 7: Global Portable Chromatography Systems Industry Revenue Million Forecast, by End-User 2019 & 2032
- Table 8: Global Portable Chromatography Systems Industry Volume K Unit Forecast, by End-User 2019 & 2032
- Table 9: Global Portable Chromatography Systems Industry Revenue Million Forecast, by Region 2019 & 2032
- Table 10: Global Portable Chromatography Systems Industry Volume K Unit Forecast, by Region 2019 & 2032
- Table 11: Global Portable Chromatography Systems Industry Revenue Million Forecast, by Country 2019 & 2032
- Table 12: Global Portable Chromatography Systems Industry Volume K Unit Forecast, by Country 2019 & 2032
- Table 13: United States Portable Chromatography Systems Industry Revenue (Million) Forecast, by Application 2019 & 2032
- Table 14: United States Portable Chromatography Systems Industry Volume (K Unit) Forecast, by Application 2019 & 2032
- Table 15: Canada Portable Chromatography Systems Industry Revenue (Million) Forecast, by Application 2019 & 2032
- Table 16: Canada Portable Chromatography Systems Industry Volume (K Unit) Forecast, by Application 2019 & 2032
- Table 17: Mexico Portable Chromatography Systems Industry Revenue (Million) Forecast, by Application 2019 & 2032
- Table 18: Mexico Portable Chromatography Systems Industry Volume (K Unit) Forecast, by Application 2019 & 2032
- Table 19: Global Portable Chromatography Systems Industry Revenue Million Forecast, by Country 2019 & 2032
- Table 20: Global Portable Chromatography Systems Industry Volume K Unit Forecast, by Country 2019 & 2032
- Table 21: Germany Portable Chromatography Systems Industry Revenue (Million) Forecast, by Application 2019 & 2032
- Table 22: Germany Portable Chromatography Systems Industry Volume (K Unit) Forecast, by Application 2019 & 2032
- Table 23: United Kingdom Portable Chromatography Systems Industry Revenue (Million) Forecast, by Application 2019 & 2032
- Table 24: United Kingdom Portable Chromatography Systems Industry Volume (K Unit) Forecast, by Application 2019 & 2032
- Table 25: France Portable Chromatography Systems Industry Revenue (Million) Forecast, by Application 2019 & 2032
- Table 26: France Portable Chromatography Systems Industry Volume (K Unit) Forecast, by Application 2019 & 2032
- Table 27: Italy Portable Chromatography Systems Industry Revenue (Million) Forecast, by Application 2019 & 2032
- Table 28: Italy Portable Chromatography Systems Industry Volume (K Unit) Forecast, by Application 2019 & 2032
- Table 29: Spain Portable Chromatography Systems Industry Revenue (Million) Forecast, by Application 2019 & 2032
- Table 30: Spain Portable Chromatography Systems Industry Volume (K Unit) Forecast, by Application 2019 & 2032
- Table 31: Rest of Europe Portable Chromatography Systems Industry Revenue (Million) Forecast, by Application 2019 & 2032
- Table 32: Rest of Europe Portable Chromatography Systems Industry Volume (K Unit) Forecast, by Application 2019 & 2032
- Table 33: Global Portable Chromatography Systems Industry Revenue Million Forecast, by Country 2019 & 2032
- Table 34: Global Portable Chromatography Systems Industry Volume K Unit Forecast, by Country 2019 & 2032
- Table 35: China Portable Chromatography Systems Industry Revenue (Million) Forecast, by Application 2019 & 2032
- Table 36: China Portable Chromatography Systems Industry Volume (K Unit) Forecast, by Application 2019 & 2032
- Table 37: Japan Portable Chromatography Systems Industry Revenue (Million) Forecast, by Application 2019 & 2032
- Table 38: Japan Portable Chromatography Systems Industry Volume (K Unit) Forecast, by Application 2019 & 2032
- Table 39: India Portable Chromatography Systems Industry Revenue (Million) Forecast, by Application 2019 & 2032
- Table 40: India Portable Chromatography Systems Industry Volume (K Unit) Forecast, by Application 2019 & 2032
- Table 41: Australia Portable Chromatography Systems Industry Revenue (Million) Forecast, by Application 2019 & 2032
- Table 42: Australia Portable Chromatography Systems Industry Volume (K Unit) Forecast, by Application 2019 & 2032
- Table 43: South Korea Portable Chromatography Systems Industry Revenue (Million) Forecast, by Application 2019 & 2032
- Table 44: South Korea Portable Chromatography Systems Industry Volume (K Unit) Forecast, by Application 2019 & 2032
- Table 45: Rest of Asia Pacific Portable Chromatography Systems Industry Revenue (Million) Forecast, by Application 2019 & 2032
- Table 46: Rest of Asia Pacific Portable Chromatography Systems Industry Volume (K Unit) Forecast, by Application 2019 & 2032
- Table 47: Global Portable Chromatography Systems Industry Revenue Million Forecast, by Country 2019 & 2032
- Table 48: Global Portable Chromatography Systems Industry Volume K Unit Forecast, by Country 2019 & 2032
- Table 49: GCC Portable Chromatography Systems Industry Revenue (Million) Forecast, by Application 2019 & 2032
- Table 50: GCC Portable Chromatography Systems Industry Volume (K Unit) Forecast, by Application 2019 & 2032
- Table 51: South Africa Portable Chromatography Systems Industry Revenue (Million) Forecast, by Application 2019 & 2032
- Table 52: South Africa Portable Chromatography Systems Industry Volume (K Unit) Forecast, by Application 2019 & 2032
- Table 53: Rest of Middle East and Africa Portable Chromatography Systems Industry Revenue (Million) Forecast, by Application 2019 & 2032
- Table 54: Rest of Middle East and Africa Portable Chromatography Systems Industry Volume (K Unit) Forecast, by Application 2019 & 2032
- Table 55: Global Portable Chromatography Systems Industry Revenue Million Forecast, by Country 2019 & 2032
- Table 56: Global Portable Chromatography Systems Industry Volume K Unit Forecast, by Country 2019 & 2032
- Table 57: Brazil Portable Chromatography Systems Industry Revenue (Million) Forecast, by Application 2019 & 2032
- Table 58: Brazil Portable Chromatography Systems Industry Volume (K Unit) Forecast, by Application 2019 & 2032
- Table 59: Argentina Portable Chromatography Systems Industry Revenue (Million) Forecast, by Application 2019 & 2032
- Table 60: Argentina Portable Chromatography Systems Industry Volume (K Unit) Forecast, by Application 2019 & 2032
- Table 61: Rest of South America Portable Chromatography Systems Industry Revenue (Million) Forecast, by Application 2019 & 2032
- Table 62: Rest of South America Portable Chromatography Systems Industry Volume (K Unit) Forecast, by Application 2019 & 2032
- Table 63: Global Portable Chromatography Systems Industry Revenue Million Forecast, by Portability 2019 & 2032
- Table 64: Global Portable Chromatography Systems Industry Volume K Unit Forecast, by Portability 2019 & 2032
- Table 65: Global Portable Chromatography Systems Industry Revenue Million Forecast, by Type 2019 & 2032
- Table 66: Global Portable Chromatography Systems Industry Volume K Unit Forecast, by Type 2019 & 2032
- Table 67: Global Portable Chromatography Systems Industry Revenue Million Forecast, by End-User 2019 & 2032
- Table 68: Global Portable Chromatography Systems Industry Volume K Unit Forecast, by End-User 2019 & 2032
- Table 69: Global Portable Chromatography Systems Industry Revenue Million Forecast, by Country 2019 & 2032
- Table 70: Global Portable Chromatography Systems Industry Volume K Unit Forecast, by Country 2019 & 2032
- Table 71: United States Portable Chromatography Systems Industry Revenue (Million) Forecast, by Application 2019 & 2032
- Table 72: United States Portable Chromatography Systems Industry Volume (K Unit) Forecast, by Application 2019 & 2032
- Table 73: Canada Portable Chromatography Systems Industry Revenue (Million) Forecast, by Application 2019 & 2032
- Table 74: Canada Portable Chromatography Systems Industry Volume (K Unit) Forecast, by Application 2019 & 2032
- Table 75: Mexico Portable Chromatography Systems Industry Revenue (Million) Forecast, by Application 2019 & 2032
- Table 76: Mexico Portable Chromatography Systems Industry Volume (K Unit) Forecast, by Application 2019 & 2032
- Table 77: Global Portable Chromatography Systems Industry Revenue Million Forecast, by Portability 2019 & 2032
- Table 78: Global Portable Chromatography Systems Industry Volume K Unit Forecast, by Portability 2019 & 2032
- Table 79: Global Portable Chromatography Systems Industry Revenue Million Forecast, by Type 2019 & 2032
- Table 80: Global Portable Chromatography Systems Industry Volume K Unit Forecast, by Type 2019 & 2032
- Table 81: Global Portable Chromatography Systems Industry Revenue Million Forecast, by End-User 2019 & 2032
- Table 82: Global Portable Chromatography Systems Industry Volume K Unit Forecast, by End-User 2019 & 2032
- Table 83: Global Portable Chromatography Systems Industry Revenue Million Forecast, by Country 2019 & 2032
- Table 84: Global Portable Chromatography Systems Industry Volume K Unit Forecast, by Country 2019 & 2032
- Table 85: Germany Portable Chromatography Systems Industry Revenue (Million) Forecast, by Application 2019 & 2032
- Table 86: Germany Portable Chromatography Systems Industry Volume (K Unit) Forecast, by Application 2019 & 2032
- Table 87: United Kingdom Portable Chromatography Systems Industry Revenue (Million) Forecast, by Application 2019 & 2032
- Table 88: United Kingdom Portable Chromatography Systems Industry Volume (K Unit) Forecast, by Application 2019 & 2032
- Table 89: France Portable Chromatography Systems Industry Revenue (Million) Forecast, by Application 2019 & 2032
- Table 90: France Portable Chromatography Systems Industry Volume (K Unit) Forecast, by Application 2019 & 2032
- Table 91: Italy Portable Chromatography Systems Industry Revenue (Million) Forecast, by Application 2019 & 2032
- Table 92: Italy Portable Chromatography Systems Industry Volume (K Unit) Forecast, by Application 2019 & 2032
- Table 93: Spain Portable Chromatography Systems Industry Revenue (Million) Forecast, by Application 2019 & 2032
- Table 94: Spain Portable Chromatography Systems Industry Volume (K Unit) Forecast, by Application 2019 & 2032
- Table 95: Rest of Europe Portable Chromatography Systems Industry Revenue (Million) Forecast, by Application 2019 & 2032
- Table 96: Rest of Europe Portable Chromatography Systems Industry Volume (K Unit) Forecast, by Application 2019 & 2032
- Table 97: Global Portable Chromatography Systems Industry Revenue Million Forecast, by Portability 2019 & 2032
- Table 98: Global Portable Chromatography Systems Industry Volume K Unit Forecast, by Portability 2019 & 2032
- Table 99: Global Portable Chromatography Systems Industry Revenue Million Forecast, by Type 2019 & 2032
- Table 100: Global Portable Chromatography Systems Industry Volume K Unit Forecast, by Type 2019 & 2032
- Table 101: Global Portable Chromatography Systems Industry Revenue Million Forecast, by End-User 2019 & 2032
- Table 102: Global Portable Chromatography Systems Industry Volume K Unit Forecast, by End-User 2019 & 2032
- Table 103: Global Portable Chromatography Systems Industry Revenue Million Forecast, by Country 2019 & 2032
- Table 104: Global Portable Chromatography Systems Industry Volume K Unit Forecast, by Country 2019 & 2032
- Table 105: China Portable Chromatography Systems Industry Revenue (Million) Forecast, by Application 2019 & 2032
- Table 106: China Portable Chromatography Systems Industry Volume (K Unit) Forecast, by Application 2019 & 2032
- Table 107: Japan Portable Chromatography Systems Industry Revenue (Million) Forecast, by Application 2019 & 2032
- Table 108: Japan Portable Chromatography Systems Industry Volume (K Unit) Forecast, by Application 2019 & 2032
- Table 109: India Portable Chromatography Systems Industry Revenue (Million) Forecast, by Application 2019 & 2032
- Table 110: India Portable Chromatography Systems Industry Volume (K Unit) Forecast, by Application 2019 & 2032
- Table 111: Australia Portable Chromatography Systems Industry Revenue (Million) Forecast, by Application 2019 & 2032
- Table 112: Australia Portable Chromatography Systems Industry Volume (K Unit) Forecast, by Application 2019 & 2032
- Table 113: South Korea Portable Chromatography Systems Industry Revenue (Million) Forecast, by Application 2019 & 2032
- Table 114: South Korea Portable Chromatography Systems Industry Volume (K Unit) Forecast, by Application 2019 & 2032
- Table 115: Rest of Asia Pacific Portable Chromatography Systems Industry Revenue (Million) Forecast, by Application 2019 & 2032
- Table 116: Rest of Asia Pacific Portable Chromatography Systems Industry Volume (K Unit) Forecast, by Application 2019 & 2032
- Table 117: Global Portable Chromatography Systems Industry Revenue Million Forecast, by Portability 2019 & 2032
- Table 118: Global Portable Chromatography Systems Industry Volume K Unit Forecast, by Portability 2019 & 2032
- Table 119: Global Portable Chromatography Systems Industry Revenue Million Forecast, by Type 2019 & 2032
- Table 120: Global Portable Chromatography Systems Industry Volume K Unit Forecast, by Type 2019 & 2032
- Table 121: Global Portable Chromatography Systems Industry Revenue Million Forecast, by End-User 2019 & 2032
- Table 122: Global Portable Chromatography Systems Industry Volume K Unit Forecast, by End-User 2019 & 2032
- Table 123: Global Portable Chromatography Systems Industry Revenue Million Forecast, by Country 2019 & 2032
- Table 124: Global Portable Chromatography Systems Industry Volume K Unit Forecast, by Country 2019 & 2032
- Table 125: GCC Portable Chromatography Systems Industry Revenue (Million) Forecast, by Application 2019 & 2032
- Table 126: GCC Portable Chromatography Systems Industry Volume (K Unit) Forecast, by Application 2019 & 2032
- Table 127: South Africa Portable Chromatography Systems Industry Revenue (Million) Forecast, by Application 2019 & 2032
- Table 128: South Africa Portable Chromatography Systems Industry Volume (K Unit) Forecast, by Application 2019 & 2032
- Table 129: Rest of Middle East and Africa Portable Chromatography Systems Industry Revenue (Million) Forecast, by Application 2019 & 2032
- Table 130: Rest of Middle East and Africa Portable Chromatography Systems Industry Volume (K Unit) Forecast, by Application 2019 & 2032
- Table 131: Global Portable Chromatography Systems Industry Revenue Million Forecast, by Portability 2019 & 2032
- Table 132: Global Portable Chromatography Systems Industry Volume K Unit Forecast, by Portability 2019 & 2032
- Table 133: Global Portable Chromatography Systems Industry Revenue Million Forecast, by Type 2019 & 2032
- Table 134: Global Portable Chromatography Systems Industry Volume K Unit Forecast, by Type 2019 & 2032
- Table 135: Global Portable Chromatography Systems Industry Revenue Million Forecast, by End-User 2019 & 2032
- Table 136: Global Portable Chromatography Systems Industry Volume K Unit Forecast, by End-User 2019 & 2032
- Table 137: Global Portable Chromatography Systems Industry Revenue Million Forecast, by Country 2019 & 2032
- Table 138: Global Portable Chromatography Systems Industry Volume K Unit Forecast, by Country 2019 & 2032
- Table 139: Brazil Portable Chromatography Systems Industry Revenue (Million) Forecast, by Application 2019 & 2032
- Table 140: Brazil Portable Chromatography Systems Industry Volume (K Unit) Forecast, by Application 2019 & 2032
- Table 141: Argentina Portable Chromatography Systems Industry Revenue (Million) Forecast, by Application 2019 & 2032
- Table 142: Argentina Portable Chromatography Systems Industry Volume (K Unit) Forecast, by Application 2019 & 2032
- Table 143: Rest of South America Portable Chromatography Systems Industry Revenue (Million) Forecast, by Application 2019 & 2032
- Table 144: Rest of South America Portable Chromatography Systems Industry Volume (K Unit) Forecast, by Application 2019 & 2032
Frequently Asked Questions
1. What is the projected Compound Annual Growth Rate (CAGR) of the Portable Chromatography Systems Industry?
The projected CAGR is approximately 5.23%.
2. Which companies are prominent players in the Portable Chromatography Systems Industry?
Key companies in the market include Tekmeasure Technologies Pvt Ltd , Sigma Instrument Private Limited, Analytical Technologies Limited, Icon Scientific Inc, Agilent Technologies Inc, PerkinElmer Inc, INFICON, Axcend, FLIR Systems Inc.
3. What are the main segments of the Portable Chromatography Systems Industry?
The market segments include Portability, Type, End-User.
4. Can you provide details about the market size?
The market size is estimated to be USD 563.52 Million as of 2022.
5. What are some drivers contributing to market growth?
; Advancements in Device Technologies; Growing Applications of Portable Chromatography Systems.
6. What are the notable trends driving market growth?
Transportable Chromatography Systems to Grow at a Significant Rate.
7. Are there any restraints impacting market growth?
; High Cost of Portable Chromatography Techniques.
8. Can you provide examples of recent developments in the market?
N/A
9. What pricing options are available for accessing the report?
Pricing options include single-user, multi-user, and enterprise licenses priced at USD 4750, USD 5250, and USD 8750 respectively.
10. Is the market size provided in terms of value or volume?
The market size is provided in terms of value, measured in Million and volume, measured in K Unit.
11. Are there any specific market keywords associated with the report?
Yes, the market keyword associated with the report is "Portable Chromatography Systems Industry," which aids in identifying and referencing the specific market segment covered.
12. How do I determine which pricing option suits my needs best?
The pricing options vary based on user requirements and access needs. Individual users may opt for single-user licenses, while businesses requiring broader access may choose multi-user or enterprise licenses for cost-effective access to the report.
13. Are there any additional resources or data provided in the Portable Chromatography Systems Industry report?
While the report offers comprehensive insights, it's advisable to review the specific contents or supplementary materials provided to ascertain if additional resources or data are available.
14. How can I stay updated on further developments or reports in the Portable Chromatography Systems Industry?
To stay informed about further developments, trends, and reports in the Portable Chromatography Systems Industry, consider subscribing to industry newsletters, following relevant companies and organizations, or regularly checking reputable industry news sources and publications.
Methodology
Step 1 - Identification of Relevant Samples Size from Population Database


Step 2 - Approaches for Defining Global Market Size (Value, Volume* & Price*)

Note*: In applicable scenarios
Step 3 - Data Sources
Primary Research
- Web Analytics
- Survey Reports
- Research Institute
- Latest Research Reports
- Opinion Leaders
Secondary Research
- Annual Reports
- White Paper
- Latest Press Release
- Industry Association
- Paid Database
- Investor Presentations

Step 4 - Data Triangulation
Involves using different sources of information in order to increase the validity of a study
These sources are likely to be stakeholders in a program - participants, other researchers, program staff, other community members, and so on.
Then we put all data in single framework & apply various statistical tools to find out the dynamic on the market.
During the analysis stage, feedback from the stakeholder groups would be compared to determine areas of agreement as well as areas of divergence
