

Key Insights
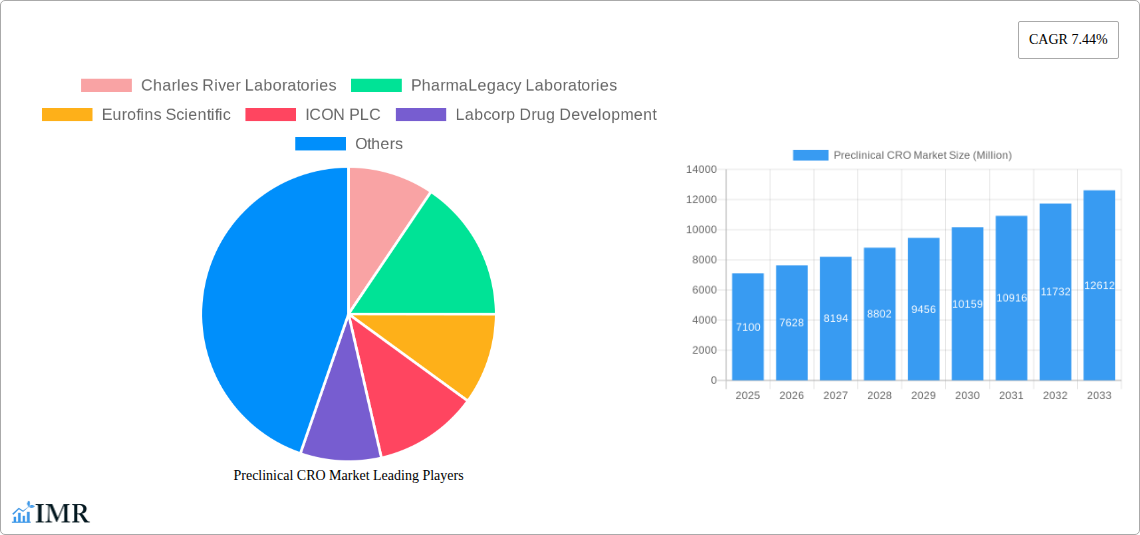
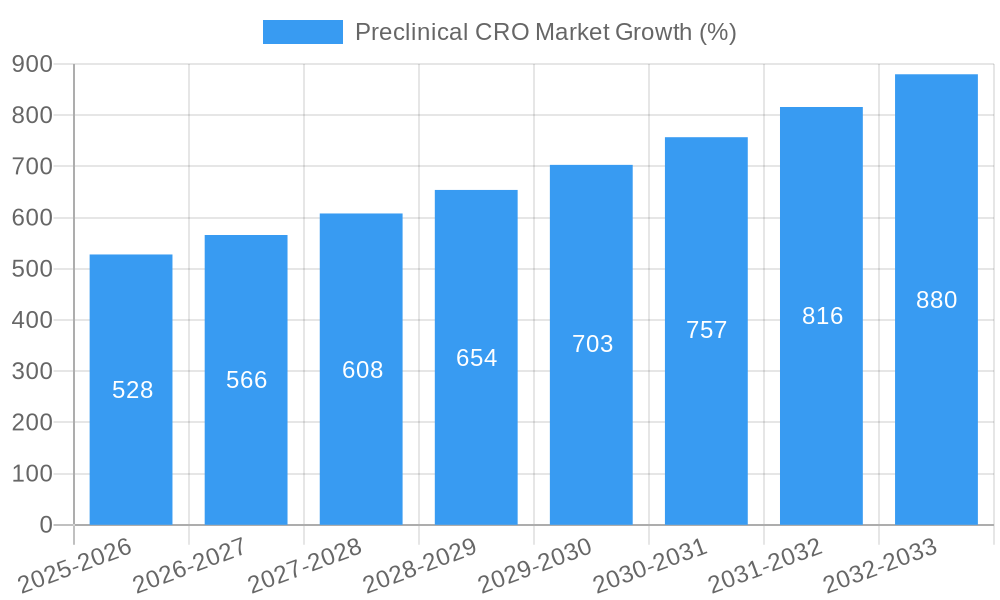
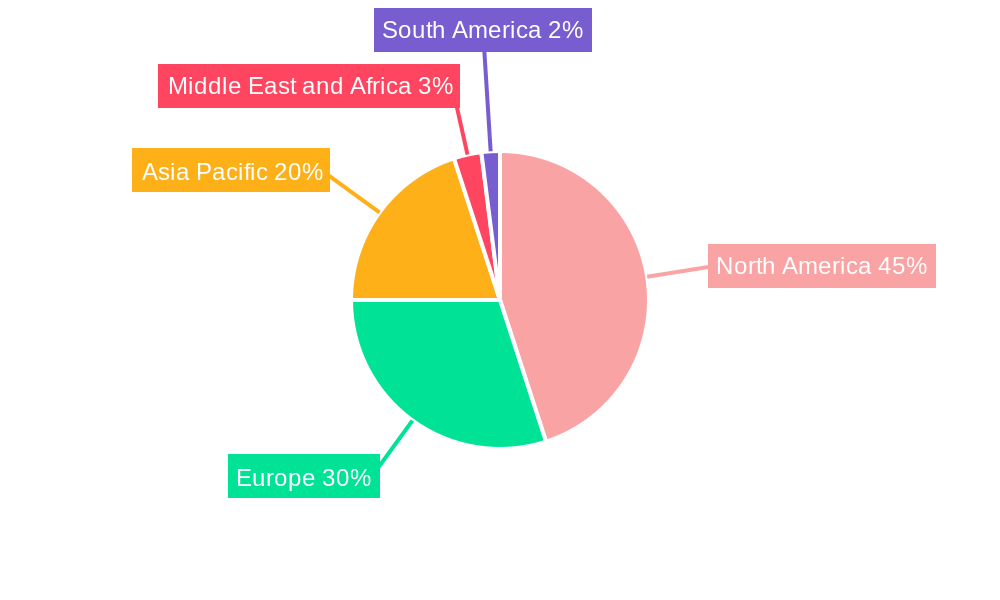
The Preclinical Contract Research Organization (CRO) market, valued at $7.10 billion in 2025, is poised for robust growth, exhibiting a Compound Annual Growth Rate (CAGR) of 7.44% from 2025 to 2033. This expansion is driven by several key factors. The increasing complexity of drug development necessitates outsourcing of preclinical services, leading to higher demand for CROs. Advancements in technologies like Patient Derived Organoid (PDO) and Patient Derived Xenograft (PDX) models offer more accurate and predictive preclinical data, fueling market growth. The rising prevalence of chronic diseases globally also contributes, as pharmaceutical companies increasingly rely on CROs to accelerate drug discovery and development timelines. Biopharmaceutical companies are the primary end-users, representing a significant portion of the market share. The North American region, particularly the United States, currently holds a dominant market position due to the presence of established CROs and robust regulatory frameworks. However, growth in Asia-Pacific, driven by emerging economies and increasing research investments, is expected to significantly impact the market landscape in the coming years.
The market segmentation reveals that toxicology testing and bioanalysis services comprise a large segment, reflecting the critical role of these services in evaluating drug safety and efficacy. Growth within the PDO and PDX model segments is particularly noteworthy, reflecting the shift towards personalized medicine and more relevant preclinical testing. While competitive intensity among established players like Charles River Laboratories, Eurofins Scientific, and Labcorp is high, opportunities for smaller, specialized CROs exist, especially those offering innovative technologies or focusing on niche therapeutic areas. Regulatory hurdles and associated costs pose some challenges, but the overall market outlook remains positive, with substantial growth anticipated across all major regions, particularly fueled by the growing need for efficient and cost-effective preclinical drug development.
Preclinical CRO Market: A Comprehensive Report (2019-2033)
This in-depth report provides a comprehensive analysis of the Preclinical Contract Research Organization (CRO) market, encompassing market dynamics, growth trends, regional dominance, product landscapes, key players, and future outlook. The study period covers 2019-2033, with 2025 as the base year and a forecast period of 2025-2033. The report segments the market by service (Toxicology Testing, Bioanalysis & Drug Metabolism and Pharmacokinetics Studies, Safety Pharmacology, Other Services), model type (Patient Derived Organoid (PDO) Models, Patient Derived Xenograft (PDX) Models), and end-user (Biopharmaceutical Companies, Research Institutes and Universities, Other End Users). The global preclinical CRO market is projected to reach xx Million by 2033, exhibiting a CAGR of xx% during the forecast period.
Preclinical CRO Market Dynamics & Structure
The Preclinical CRO market is characterized by moderate concentration, with several large players holding significant market share. The market structure is influenced by technological advancements, stringent regulatory frameworks, and the emergence of competitive substitute technologies. The end-user demographics are primarily driven by the growth of the biopharmaceutical industry and increasing research and development (R&D) spending. Mergers and acquisitions (M&A) activity has been significant, shaping market consolidation and driving innovation.
- Market Concentration: The top 5 players hold approximately xx% of the market share in 2025.
- Technological Innovation: Advancements in genomics, proteomics, and AI/ML are driving innovation, particularly in model development (PDO, PDX).
- Regulatory Landscape: Stringent regulatory requirements for preclinical studies influence market growth and operational costs. Compliance costs represent approximately xx% of average operating expenses for CROs.
- Competitive Substitutes: Internal R&D capabilities and alternative testing methods pose competitive challenges.
- M&A Activity: An average of xx M&A deals were recorded annually between 2019-2024. This trend is expected to continue, fueling consolidation.
- End-User Demographics: The biopharmaceutical segment accounts for approximately xx% of the total market in 2025.
Preclinical CRO Market Growth Trends & Insights
The Preclinical CRO market exhibits robust growth, fueled by several factors. The increasing outsourcing of preclinical studies by biopharmaceutical companies to focus on core competencies is a primary driver. Technological disruptions, particularly in model development and data analytics, are accelerating adoption rates. Furthermore, a shift toward personalized medicine and advanced therapeutic modalities is creating new opportunities.
The market size experienced substantial growth from xx Million in 2019 to xx Million in 2024. This trajectory is expected to continue, driven by increasing R&D spending and the demand for efficient and reliable preclinical services. The market penetration rate in the biopharmaceutical sector is approximately xx% in 2025, with projected growth to xx% by 2033. Technological advancements like AI-powered drug discovery are expected to boost the CAGR to xx% in the next decade. Changes in consumer behavior, such as the preference for faster turnaround times and data-driven decision making, are also influencing market trends.
Dominant Regions, Countries, or Segments in Preclinical CRO Market
North America currently dominates the Preclinical CRO market, driven by high R&D spending, a robust regulatory environment, and the presence of major CRO players. However, the Asia-Pacific region is experiencing rapid growth, fueled by increasing pharmaceutical manufacturing and a burgeoning biopharmaceutical industry. Within segments, Toxicology Testing and Bioanalysis & Drug Metabolism and Pharmacokinetics Studies represent the largest revenue streams, each holding around xx% market share. Patient-derived models (PDO and PDX) are exhibiting rapid growth.
- North America: High R&D spending and established CRO infrastructure.
- Europe: Stringent regulations and a strong presence of established CROs.
- Asia-Pacific: Rapid growth driven by increasing R&D investments.
- Toxicology Testing: Large market share due to regulatory requirements.
- Bioanalysis & DMPK: High demand for efficient and accurate pharmacokinetic and pharmacodynamic studies.
- Patient-Derived Models: Rapid adoption due to their enhanced predictive power compared to traditional models.
Preclinical CRO Market Product Landscape
The Preclinical CRO market offers a wide range of services, from basic toxicology testing to advanced pharmacodynamic studies using sophisticated models. Recent innovations focus on improving the predictive validity of preclinical models, reducing reliance on animal testing, and leveraging AI/ML for data analysis and interpretation. Key selling propositions include faster turnaround times, reduced costs, and improved data quality. Technological advancements include the integration of advanced imaging techniques, high-throughput screening, and sophisticated data analytics platforms.
Key Drivers, Barriers & Challenges in Preclinical CRO Market
Key Drivers:
- Increasing outsourcing of preclinical activities by pharmaceutical companies.
- Growing demand for personalized medicine and advanced therapeutic modalities.
- Technological advancements in preclinical models and data analytics.
- Rising R&D investments across the globe.
Challenges & Restraints:
- Stringent regulatory compliance requirements increasing operational costs. Compliance adds an estimated xx% to average project costs.
- High competition and price pressures within the CRO industry.
- Supply chain disruptions affecting the availability of reagents and testing materials.
- Ethical concerns related to animal testing limiting the use of some models.
Emerging Opportunities in Preclinical CRO Market
- Expansion into emerging markets like Latin America and Africa.
- Development of advanced preclinical models that better predict clinical outcomes.
- Increased use of AI/ML for data analysis and interpretation to improve efficiency and reduce costs.
- Focus on providing integrated services that encompass the entire drug development process.
Growth Accelerators in the Preclinical CRO Market Industry
The long-term growth of the Preclinical CRO market will be propelled by several factors, including continuous technological innovations leading to improved preclinical models and enhanced data analytics capabilities. Strategic partnerships between CROs and pharmaceutical companies will also drive market growth by ensuring better integration of preclinical data into drug development strategies. Market expansion into emerging economies will also contribute significantly to long-term growth.
Key Players Shaping the Preclinical CRO Market Market
- Charles River Laboratories
- PharmaLegacy Laboratories
- Eurofins Scientific
- ICON PLC
- Labcorp Drug Development
- NorthEast BioAnalytical Laboratories LLC
- SGS SA
- Altasciences Company Inc
- Parexel International Corporation
- WuXi AppTec
- Thermo Fisher Scientific Inc (Pharmaceutical Product Development (PPD))
- Medpace
Notable Milestones in Preclinical CRO Market Sector
- March 2023: GTP Bioways and Texcell partnered to offer comprehensive preclinical to clinical services. This expands service offerings and potentially increases market share for both companies.
- November 2023: CEBIS International expanded its preclinical and clinical trials services into North America and India, increasing its geographic reach and potential client base.
In-Depth Preclinical CRO Market Market Outlook
The Preclinical CRO market is poised for sustained growth, driven by technological advancements, strategic partnerships, and expanding global demand for preclinical services. The focus on personalized medicine, advanced therapeutic modalities, and the integration of AI/ML will create new opportunities for innovation and market expansion. CROs that can effectively adapt to evolving regulatory landscapes, embrace technological advancements, and offer integrated services will be well-positioned to capture significant market share in the coming years.
Preclinical CRO Market Segmentation
-
1. Service
- 1.1. Toxicology Testing
- 1.2. Bioanaly
- 1.3. Safety Pharmacology
- 1.4. Other Services
-
2. Mode Type
- 2.1. Patient Derived Organoid (PDO) Models
- 2.2. Patient Derived Xenograft (PDX) Models
-
3. End Users
- 3.1. Biopharmaceutical Companies
- 3.2. Research Institutes and Universities
- 3.3. Other End Users
Preclinical CRO Market Segmentation By Geography
-
1. North America
- 1.1. United States
- 1.2. Canada
- 1.3. Mexico
-
2. Europe
- 2.1. Germany
- 2.2. United Kingdom
- 2.3. France
- 2.4. Italy
- 2.5. Spain
- 2.6. Rest of Europe
-
3. Asia Pacific
- 3.1. China
- 3.2. Japan
- 3.3. India
- 3.4. Australia
- 3.5. South Korea
- 3.6. Rest of Asia Pacific
-
4. Middle East and Africa
- 4.1. GCC
- 4.2. South Africa
- 4.3. Rest of Middle East and Africa
-
5. South America
- 5.1. Brazil
- 5.2. Argentina
- 5.3. Rest of South America
Preclinical CRO Market REPORT HIGHLIGHTS
| Aspects | Details |
|---|---|
| Study Period | 2019-2033 |
| Base Year | 2024 |
| Estimated Year | 2025 |
| Forecast Period | 2025-2033 |
| Historical Period | 2019-2024 |
| Growth Rate | CAGR of 7.44% from 2019-2033 |
| Segmentation |
|
Table of Contents
- 1. Introduction
- 1.1. Research Scope
- 1.2. Market Segmentation
- 1.3. Research Methodology
- 1.4. Definitions and Assumptions
- 2. Executive Summary
- 2.1. Introduction
- 3. Market Dynamics
- 3.1. Introduction
- 3.2. Market Drivers
- 3.2.1. Increasing Research and Development (R&D) Expenditure Worldwide; Increase in Number of Drugs in Preclinical Trials; High Demand for Medicines Uptake by Chronically Ill Patients
- 3.3. Market Restrains
- 3.3.1. Lack of Standardization and Monitoring Issue; Stringent Regulatory Policies
- 3.4. Market Trends
- 3.4.1. The Toxicology Testing Segment is Predicted to Witness Significant Growth Between 2024 and 2029
- 4. Market Factor Analysis
- 4.1. Porters Five Forces
- 4.2. Supply/Value Chain
- 4.3. PESTEL analysis
- 4.4. Market Entropy
- 4.5. Patent/Trademark Analysis
- 5. Global Preclinical CRO Market Analysis, Insights and Forecast, 2019-2031
- 5.1. Market Analysis, Insights and Forecast - by Service
- 5.1.1. Toxicology Testing
- 5.1.2. Bioanaly
- 5.1.3. Safety Pharmacology
- 5.1.4. Other Services
- 5.2. Market Analysis, Insights and Forecast - by Mode Type
- 5.2.1. Patient Derived Organoid (PDO) Models
- 5.2.2. Patient Derived Xenograft (PDX) Models
- 5.3. Market Analysis, Insights and Forecast - by End Users
- 5.3.1. Biopharmaceutical Companies
- 5.3.2. Research Institutes and Universities
- 5.3.3. Other End Users
- 5.4. Market Analysis, Insights and Forecast - by Region
- 5.4.1. North America
- 5.4.2. Europe
- 5.4.3. Asia Pacific
- 5.4.4. Middle East and Africa
- 5.4.5. South America
- 5.1. Market Analysis, Insights and Forecast - by Service
- 6. North America Preclinical CRO Market Analysis, Insights and Forecast, 2019-2031
- 6.1. Market Analysis, Insights and Forecast - by Service
- 6.1.1. Toxicology Testing
- 6.1.2. Bioanaly
- 6.1.3. Safety Pharmacology
- 6.1.4. Other Services
- 6.2. Market Analysis, Insights and Forecast - by Mode Type
- 6.2.1. Patient Derived Organoid (PDO) Models
- 6.2.2. Patient Derived Xenograft (PDX) Models
- 6.3. Market Analysis, Insights and Forecast - by End Users
- 6.3.1. Biopharmaceutical Companies
- 6.3.2. Research Institutes and Universities
- 6.3.3. Other End Users
- 6.1. Market Analysis, Insights and Forecast - by Service
- 7. Europe Preclinical CRO Market Analysis, Insights and Forecast, 2019-2031
- 7.1. Market Analysis, Insights and Forecast - by Service
- 7.1.1. Toxicology Testing
- 7.1.2. Bioanaly
- 7.1.3. Safety Pharmacology
- 7.1.4. Other Services
- 7.2. Market Analysis, Insights and Forecast - by Mode Type
- 7.2.1. Patient Derived Organoid (PDO) Models
- 7.2.2. Patient Derived Xenograft (PDX) Models
- 7.3. Market Analysis, Insights and Forecast - by End Users
- 7.3.1. Biopharmaceutical Companies
- 7.3.2. Research Institutes and Universities
- 7.3.3. Other End Users
- 7.1. Market Analysis, Insights and Forecast - by Service
- 8. Asia Pacific Preclinical CRO Market Analysis, Insights and Forecast, 2019-2031
- 8.1. Market Analysis, Insights and Forecast - by Service
- 8.1.1. Toxicology Testing
- 8.1.2. Bioanaly
- 8.1.3. Safety Pharmacology
- 8.1.4. Other Services
- 8.2. Market Analysis, Insights and Forecast - by Mode Type
- 8.2.1. Patient Derived Organoid (PDO) Models
- 8.2.2. Patient Derived Xenograft (PDX) Models
- 8.3. Market Analysis, Insights and Forecast - by End Users
- 8.3.1. Biopharmaceutical Companies
- 8.3.2. Research Institutes and Universities
- 8.3.3. Other End Users
- 8.1. Market Analysis, Insights and Forecast - by Service
- 9. Middle East and Africa Preclinical CRO Market Analysis, Insights and Forecast, 2019-2031
- 9.1. Market Analysis, Insights and Forecast - by Service
- 9.1.1. Toxicology Testing
- 9.1.2. Bioanaly
- 9.1.3. Safety Pharmacology
- 9.1.4. Other Services
- 9.2. Market Analysis, Insights and Forecast - by Mode Type
- 9.2.1. Patient Derived Organoid (PDO) Models
- 9.2.2. Patient Derived Xenograft (PDX) Models
- 9.3. Market Analysis, Insights and Forecast - by End Users
- 9.3.1. Biopharmaceutical Companies
- 9.3.2. Research Institutes and Universities
- 9.3.3. Other End Users
- 9.1. Market Analysis, Insights and Forecast - by Service
- 10. South America Preclinical CRO Market Analysis, Insights and Forecast, 2019-2031
- 10.1. Market Analysis, Insights and Forecast - by Service
- 10.1.1. Toxicology Testing
- 10.1.2. Bioanaly
- 10.1.3. Safety Pharmacology
- 10.1.4. Other Services
- 10.2. Market Analysis, Insights and Forecast - by Mode Type
- 10.2.1. Patient Derived Organoid (PDO) Models
- 10.2.2. Patient Derived Xenograft (PDX) Models
- 10.3. Market Analysis, Insights and Forecast - by End Users
- 10.3.1. Biopharmaceutical Companies
- 10.3.2. Research Institutes and Universities
- 10.3.3. Other End Users
- 10.1. Market Analysis, Insights and Forecast - by Service
- 11. North America Preclinical CRO Market Analysis, Insights and Forecast, 2019-2031
- 11.1. Market Analysis, Insights and Forecast - By Country/Sub-region
- 11.1.1 United States
- 11.1.2 Canada
- 11.1.3 Mexico
- 12. Europe Preclinical CRO Market Analysis, Insights and Forecast, 2019-2031
- 12.1. Market Analysis, Insights and Forecast - By Country/Sub-region
- 12.1.1 Germany
- 12.1.2 United Kingdom
- 12.1.3 France
- 12.1.4 Italy
- 12.1.5 Spain
- 12.1.6 Rest of Europe
- 13. Asia Pacific Preclinical CRO Market Analysis, Insights and Forecast, 2019-2031
- 13.1. Market Analysis, Insights and Forecast - By Country/Sub-region
- 13.1.1 China
- 13.1.2 Japan
- 13.1.3 India
- 13.1.4 Australia
- 13.1.5 South Korea
- 13.1.6 Rest of Asia Pacific
- 14. Middle East and Africa Preclinical CRO Market Analysis, Insights and Forecast, 2019-2031
- 14.1. Market Analysis, Insights and Forecast - By Country/Sub-region
- 14.1.1 GCC
- 14.1.2 South Africa
- 14.1.3 Rest of Middle East and Africa
- 15. South America Preclinical CRO Market Analysis, Insights and Forecast, 2019-2031
- 15.1. Market Analysis, Insights and Forecast - By Country/Sub-region
- 15.1.1 Brazil
- 15.1.2 Argentina
- 15.1.3 Rest of South America
- 16. Competitive Analysis
- 16.1. Global Market Share Analysis 2024
- 16.2. Company Profiles
- 16.2.1 Charles River Laboratories
- 16.2.1.1. Overview
- 16.2.1.2. Products
- 16.2.1.3. SWOT Analysis
- 16.2.1.4. Recent Developments
- 16.2.1.5. Financials (Based on Availability)
- 16.2.2 PharmaLegacy Laboratories
- 16.2.2.1. Overview
- 16.2.2.2. Products
- 16.2.2.3. SWOT Analysis
- 16.2.2.4. Recent Developments
- 16.2.2.5. Financials (Based on Availability)
- 16.2.3 Eurofins Scientific
- 16.2.3.1. Overview
- 16.2.3.2. Products
- 16.2.3.3. SWOT Analysis
- 16.2.3.4. Recent Developments
- 16.2.3.5. Financials (Based on Availability)
- 16.2.4 ICON PLC
- 16.2.4.1. Overview
- 16.2.4.2. Products
- 16.2.4.3. SWOT Analysis
- 16.2.4.4. Recent Developments
- 16.2.4.5. Financials (Based on Availability)
- 16.2.5 Labcorp Drug Development
- 16.2.5.1. Overview
- 16.2.5.2. Products
- 16.2.5.3. SWOT Analysis
- 16.2.5.4. Recent Developments
- 16.2.5.5. Financials (Based on Availability)
- 16.2.6 NorthEast BioAnalytical Laboratories LLC
- 16.2.6.1. Overview
- 16.2.6.2. Products
- 16.2.6.3. SWOT Analysis
- 16.2.6.4. Recent Developments
- 16.2.6.5. Financials (Based on Availability)
- 16.2.7 SGS SA
- 16.2.7.1. Overview
- 16.2.7.2. Products
- 16.2.7.3. SWOT Analysis
- 16.2.7.4. Recent Developments
- 16.2.7.5. Financials (Based on Availability)
- 16.2.8 Altasciences Company Inc
- 16.2.8.1. Overview
- 16.2.8.2. Products
- 16.2.8.3. SWOT Analysis
- 16.2.8.4. Recent Developments
- 16.2.8.5. Financials (Based on Availability)
- 16.2.9 Parexel International Corporation
- 16.2.9.1. Overview
- 16.2.9.2. Products
- 16.2.9.3. SWOT Analysis
- 16.2.9.4. Recent Developments
- 16.2.9.5. Financials (Based on Availability)
- 16.2.10 WuXi App Tec
- 16.2.10.1. Overview
- 16.2.10.2. Products
- 16.2.10.3. SWOT Analysis
- 16.2.10.4. Recent Developments
- 16.2.10.5. Financials (Based on Availability)
- 16.2.11 Thermo Fisher Scientific Inc (Pharmaceutical Product Development (PPD))
- 16.2.11.1. Overview
- 16.2.11.2. Products
- 16.2.11.3. SWOT Analysis
- 16.2.11.4. Recent Developments
- 16.2.11.5. Financials (Based on Availability)
- 16.2.12 Medpace
- 16.2.12.1. Overview
- 16.2.12.2. Products
- 16.2.12.3. SWOT Analysis
- 16.2.12.4. Recent Developments
- 16.2.12.5. Financials (Based on Availability)
- 16.2.1 Charles River Laboratories
List of Figures
- Figure 1: Global Preclinical CRO Market Revenue Breakdown (Million, %) by Region 2024 & 2032
- Figure 2: North America Preclinical CRO Market Revenue (Million), by Country 2024 & 2032
- Figure 3: North America Preclinical CRO Market Revenue Share (%), by Country 2024 & 2032
- Figure 4: Europe Preclinical CRO Market Revenue (Million), by Country 2024 & 2032
- Figure 5: Europe Preclinical CRO Market Revenue Share (%), by Country 2024 & 2032
- Figure 6: Asia Pacific Preclinical CRO Market Revenue (Million), by Country 2024 & 2032
- Figure 7: Asia Pacific Preclinical CRO Market Revenue Share (%), by Country 2024 & 2032
- Figure 8: Middle East and Africa Preclinical CRO Market Revenue (Million), by Country 2024 & 2032
- Figure 9: Middle East and Africa Preclinical CRO Market Revenue Share (%), by Country 2024 & 2032
- Figure 10: South America Preclinical CRO Market Revenue (Million), by Country 2024 & 2032
- Figure 11: South America Preclinical CRO Market Revenue Share (%), by Country 2024 & 2032
- Figure 12: North America Preclinical CRO Market Revenue (Million), by Service 2024 & 2032
- Figure 13: North America Preclinical CRO Market Revenue Share (%), by Service 2024 & 2032
- Figure 14: North America Preclinical CRO Market Revenue (Million), by Mode Type 2024 & 2032
- Figure 15: North America Preclinical CRO Market Revenue Share (%), by Mode Type 2024 & 2032
- Figure 16: North America Preclinical CRO Market Revenue (Million), by End Users 2024 & 2032
- Figure 17: North America Preclinical CRO Market Revenue Share (%), by End Users 2024 & 2032
- Figure 18: North America Preclinical CRO Market Revenue (Million), by Country 2024 & 2032
- Figure 19: North America Preclinical CRO Market Revenue Share (%), by Country 2024 & 2032
- Figure 20: Europe Preclinical CRO Market Revenue (Million), by Service 2024 & 2032
- Figure 21: Europe Preclinical CRO Market Revenue Share (%), by Service 2024 & 2032
- Figure 22: Europe Preclinical CRO Market Revenue (Million), by Mode Type 2024 & 2032
- Figure 23: Europe Preclinical CRO Market Revenue Share (%), by Mode Type 2024 & 2032
- Figure 24: Europe Preclinical CRO Market Revenue (Million), by End Users 2024 & 2032
- Figure 25: Europe Preclinical CRO Market Revenue Share (%), by End Users 2024 & 2032
- Figure 26: Europe Preclinical CRO Market Revenue (Million), by Country 2024 & 2032
- Figure 27: Europe Preclinical CRO Market Revenue Share (%), by Country 2024 & 2032
- Figure 28: Asia Pacific Preclinical CRO Market Revenue (Million), by Service 2024 & 2032
- Figure 29: Asia Pacific Preclinical CRO Market Revenue Share (%), by Service 2024 & 2032
- Figure 30: Asia Pacific Preclinical CRO Market Revenue (Million), by Mode Type 2024 & 2032
- Figure 31: Asia Pacific Preclinical CRO Market Revenue Share (%), by Mode Type 2024 & 2032
- Figure 32: Asia Pacific Preclinical CRO Market Revenue (Million), by End Users 2024 & 2032
- Figure 33: Asia Pacific Preclinical CRO Market Revenue Share (%), by End Users 2024 & 2032
- Figure 34: Asia Pacific Preclinical CRO Market Revenue (Million), by Country 2024 & 2032
- Figure 35: Asia Pacific Preclinical CRO Market Revenue Share (%), by Country 2024 & 2032
- Figure 36: Middle East and Africa Preclinical CRO Market Revenue (Million), by Service 2024 & 2032
- Figure 37: Middle East and Africa Preclinical CRO Market Revenue Share (%), by Service 2024 & 2032
- Figure 38: Middle East and Africa Preclinical CRO Market Revenue (Million), by Mode Type 2024 & 2032
- Figure 39: Middle East and Africa Preclinical CRO Market Revenue Share (%), by Mode Type 2024 & 2032
- Figure 40: Middle East and Africa Preclinical CRO Market Revenue (Million), by End Users 2024 & 2032
- Figure 41: Middle East and Africa Preclinical CRO Market Revenue Share (%), by End Users 2024 & 2032
- Figure 42: Middle East and Africa Preclinical CRO Market Revenue (Million), by Country 2024 & 2032
- Figure 43: Middle East and Africa Preclinical CRO Market Revenue Share (%), by Country 2024 & 2032
- Figure 44: South America Preclinical CRO Market Revenue (Million), by Service 2024 & 2032
- Figure 45: South America Preclinical CRO Market Revenue Share (%), by Service 2024 & 2032
- Figure 46: South America Preclinical CRO Market Revenue (Million), by Mode Type 2024 & 2032
- Figure 47: South America Preclinical CRO Market Revenue Share (%), by Mode Type 2024 & 2032
- Figure 48: South America Preclinical CRO Market Revenue (Million), by End Users 2024 & 2032
- Figure 49: South America Preclinical CRO Market Revenue Share (%), by End Users 2024 & 2032
- Figure 50: South America Preclinical CRO Market Revenue (Million), by Country 2024 & 2032
- Figure 51: South America Preclinical CRO Market Revenue Share (%), by Country 2024 & 2032
List of Tables
- Table 1: Global Preclinical CRO Market Revenue Million Forecast, by Region 2019 & 2032
- Table 2: Global Preclinical CRO Market Revenue Million Forecast, by Service 2019 & 2032
- Table 3: Global Preclinical CRO Market Revenue Million Forecast, by Mode Type 2019 & 2032
- Table 4: Global Preclinical CRO Market Revenue Million Forecast, by End Users 2019 & 2032
- Table 5: Global Preclinical CRO Market Revenue Million Forecast, by Region 2019 & 2032
- Table 6: Global Preclinical CRO Market Revenue Million Forecast, by Country 2019 & 2032
- Table 7: United States Preclinical CRO Market Revenue (Million) Forecast, by Application 2019 & 2032
- Table 8: Canada Preclinical CRO Market Revenue (Million) Forecast, by Application 2019 & 2032
- Table 9: Mexico Preclinical CRO Market Revenue (Million) Forecast, by Application 2019 & 2032
- Table 10: Global Preclinical CRO Market Revenue Million Forecast, by Country 2019 & 2032
- Table 11: Germany Preclinical CRO Market Revenue (Million) Forecast, by Application 2019 & 2032
- Table 12: United Kingdom Preclinical CRO Market Revenue (Million) Forecast, by Application 2019 & 2032
- Table 13: France Preclinical CRO Market Revenue (Million) Forecast, by Application 2019 & 2032
- Table 14: Italy Preclinical CRO Market Revenue (Million) Forecast, by Application 2019 & 2032
- Table 15: Spain Preclinical CRO Market Revenue (Million) Forecast, by Application 2019 & 2032
- Table 16: Rest of Europe Preclinical CRO Market Revenue (Million) Forecast, by Application 2019 & 2032
- Table 17: Global Preclinical CRO Market Revenue Million Forecast, by Country 2019 & 2032
- Table 18: China Preclinical CRO Market Revenue (Million) Forecast, by Application 2019 & 2032
- Table 19: Japan Preclinical CRO Market Revenue (Million) Forecast, by Application 2019 & 2032
- Table 20: India Preclinical CRO Market Revenue (Million) Forecast, by Application 2019 & 2032
- Table 21: Australia Preclinical CRO Market Revenue (Million) Forecast, by Application 2019 & 2032
- Table 22: South Korea Preclinical CRO Market Revenue (Million) Forecast, by Application 2019 & 2032
- Table 23: Rest of Asia Pacific Preclinical CRO Market Revenue (Million) Forecast, by Application 2019 & 2032
- Table 24: Global Preclinical CRO Market Revenue Million Forecast, by Country 2019 & 2032
- Table 25: GCC Preclinical CRO Market Revenue (Million) Forecast, by Application 2019 & 2032
- Table 26: South Africa Preclinical CRO Market Revenue (Million) Forecast, by Application 2019 & 2032
- Table 27: Rest of Middle East and Africa Preclinical CRO Market Revenue (Million) Forecast, by Application 2019 & 2032
- Table 28: Global Preclinical CRO Market Revenue Million Forecast, by Country 2019 & 2032
- Table 29: Brazil Preclinical CRO Market Revenue (Million) Forecast, by Application 2019 & 2032
- Table 30: Argentina Preclinical CRO Market Revenue (Million) Forecast, by Application 2019 & 2032
- Table 31: Rest of South America Preclinical CRO Market Revenue (Million) Forecast, by Application 2019 & 2032
- Table 32: Global Preclinical CRO Market Revenue Million Forecast, by Service 2019 & 2032
- Table 33: Global Preclinical CRO Market Revenue Million Forecast, by Mode Type 2019 & 2032
- Table 34: Global Preclinical CRO Market Revenue Million Forecast, by End Users 2019 & 2032
- Table 35: Global Preclinical CRO Market Revenue Million Forecast, by Country 2019 & 2032
- Table 36: United States Preclinical CRO Market Revenue (Million) Forecast, by Application 2019 & 2032
- Table 37: Canada Preclinical CRO Market Revenue (Million) Forecast, by Application 2019 & 2032
- Table 38: Mexico Preclinical CRO Market Revenue (Million) Forecast, by Application 2019 & 2032
- Table 39: Global Preclinical CRO Market Revenue Million Forecast, by Service 2019 & 2032
- Table 40: Global Preclinical CRO Market Revenue Million Forecast, by Mode Type 2019 & 2032
- Table 41: Global Preclinical CRO Market Revenue Million Forecast, by End Users 2019 & 2032
- Table 42: Global Preclinical CRO Market Revenue Million Forecast, by Country 2019 & 2032
- Table 43: Germany Preclinical CRO Market Revenue (Million) Forecast, by Application 2019 & 2032
- Table 44: United Kingdom Preclinical CRO Market Revenue (Million) Forecast, by Application 2019 & 2032
- Table 45: France Preclinical CRO Market Revenue (Million) Forecast, by Application 2019 & 2032
- Table 46: Italy Preclinical CRO Market Revenue (Million) Forecast, by Application 2019 & 2032
- Table 47: Spain Preclinical CRO Market Revenue (Million) Forecast, by Application 2019 & 2032
- Table 48: Rest of Europe Preclinical CRO Market Revenue (Million) Forecast, by Application 2019 & 2032
- Table 49: Global Preclinical CRO Market Revenue Million Forecast, by Service 2019 & 2032
- Table 50: Global Preclinical CRO Market Revenue Million Forecast, by Mode Type 2019 & 2032
- Table 51: Global Preclinical CRO Market Revenue Million Forecast, by End Users 2019 & 2032
- Table 52: Global Preclinical CRO Market Revenue Million Forecast, by Country 2019 & 2032
- Table 53: China Preclinical CRO Market Revenue (Million) Forecast, by Application 2019 & 2032
- Table 54: Japan Preclinical CRO Market Revenue (Million) Forecast, by Application 2019 & 2032
- Table 55: India Preclinical CRO Market Revenue (Million) Forecast, by Application 2019 & 2032
- Table 56: Australia Preclinical CRO Market Revenue (Million) Forecast, by Application 2019 & 2032
- Table 57: South Korea Preclinical CRO Market Revenue (Million) Forecast, by Application 2019 & 2032
- Table 58: Rest of Asia Pacific Preclinical CRO Market Revenue (Million) Forecast, by Application 2019 & 2032
- Table 59: Global Preclinical CRO Market Revenue Million Forecast, by Service 2019 & 2032
- Table 60: Global Preclinical CRO Market Revenue Million Forecast, by Mode Type 2019 & 2032
- Table 61: Global Preclinical CRO Market Revenue Million Forecast, by End Users 2019 & 2032
- Table 62: Global Preclinical CRO Market Revenue Million Forecast, by Country 2019 & 2032
- Table 63: GCC Preclinical CRO Market Revenue (Million) Forecast, by Application 2019 & 2032
- Table 64: South Africa Preclinical CRO Market Revenue (Million) Forecast, by Application 2019 & 2032
- Table 65: Rest of Middle East and Africa Preclinical CRO Market Revenue (Million) Forecast, by Application 2019 & 2032
- Table 66: Global Preclinical CRO Market Revenue Million Forecast, by Service 2019 & 2032
- Table 67: Global Preclinical CRO Market Revenue Million Forecast, by Mode Type 2019 & 2032
- Table 68: Global Preclinical CRO Market Revenue Million Forecast, by End Users 2019 & 2032
- Table 69: Global Preclinical CRO Market Revenue Million Forecast, by Country 2019 & 2032
- Table 70: Brazil Preclinical CRO Market Revenue (Million) Forecast, by Application 2019 & 2032
- Table 71: Argentina Preclinical CRO Market Revenue (Million) Forecast, by Application 2019 & 2032
- Table 72: Rest of South America Preclinical CRO Market Revenue (Million) Forecast, by Application 2019 & 2032
Frequently Asked Questions
1. What is the projected Compound Annual Growth Rate (CAGR) of the Preclinical CRO Market?
The projected CAGR is approximately 7.44%.
2. Which companies are prominent players in the Preclinical CRO Market?
Key companies in the market include Charles River Laboratories, PharmaLegacy Laboratories, Eurofins Scientific, ICON PLC, Labcorp Drug Development, NorthEast BioAnalytical Laboratories LLC, SGS SA, Altasciences Company Inc, Parexel International Corporation, WuXi App Tec, Thermo Fisher Scientific Inc (Pharmaceutical Product Development (PPD)), Medpace.
3. What are the main segments of the Preclinical CRO Market?
The market segments include Service, Mode Type, End Users.
4. Can you provide details about the market size?
The market size is estimated to be USD 7.10 Million as of 2022.
5. What are some drivers contributing to market growth?
Increasing Research and Development (R&D) Expenditure Worldwide; Increase in Number of Drugs in Preclinical Trials; High Demand for Medicines Uptake by Chronically Ill Patients.
6. What are the notable trends driving market growth?
The Toxicology Testing Segment is Predicted to Witness Significant Growth Between 2024 and 2029.
7. Are there any restraints impacting market growth?
Lack of Standardization and Monitoring Issue; Stringent Regulatory Policies.
8. Can you provide examples of recent developments in the market?
March 2023: GTP Bioways, a contract development and manufacturing organization (CDMO) dedicated to biotherapeutics manufacturing, and Texcell, a contract research organization (CRO) specialized in viral safety, assay development, and GMP banking, partnered to provide comprehensive pre-clinical to clinal phases services to biopharmaceutical companies.
9. What pricing options are available for accessing the report?
Pricing options include single-user, multi-user, and enterprise licenses priced at USD 4750, USD 5250, and USD 8750 respectively.
10. Is the market size provided in terms of value or volume?
The market size is provided in terms of value, measured in Million.
11. Are there any specific market keywords associated with the report?
Yes, the market keyword associated with the report is "Preclinical CRO Market," which aids in identifying and referencing the specific market segment covered.
12. How do I determine which pricing option suits my needs best?
The pricing options vary based on user requirements and access needs. Individual users may opt for single-user licenses, while businesses requiring broader access may choose multi-user or enterprise licenses for cost-effective access to the report.
13. Are there any additional resources or data provided in the Preclinical CRO Market report?
While the report offers comprehensive insights, it's advisable to review the specific contents or supplementary materials provided to ascertain if additional resources or data are available.
14. How can I stay updated on further developments or reports in the Preclinical CRO Market?
To stay informed about further developments, trends, and reports in the Preclinical CRO Market, consider subscribing to industry newsletters, following relevant companies and organizations, or regularly checking reputable industry news sources and publications.
Methodology
Step 1 - Identification of Relevant Samples Size from Population Database


Step 2 - Approaches for Defining Global Market Size (Value, Volume* & Price*)

Note*: In applicable scenarios
Step 3 - Data Sources
Primary Research
- Web Analytics
- Survey Reports
- Research Institute
- Latest Research Reports
- Opinion Leaders
Secondary Research
- Annual Reports
- White Paper
- Latest Press Release
- Industry Association
- Paid Database
- Investor Presentations

Step 4 - Data Triangulation
Involves using different sources of information in order to increase the validity of a study
These sources are likely to be stakeholders in a program - participants, other researchers, program staff, other community members, and so on.
Then we put all data in single framework & apply various statistical tools to find out the dynamic on the market.
During the analysis stage, feedback from the stakeholder groups would be compared to determine areas of agreement as well as areas of divergence
