

Key Insights
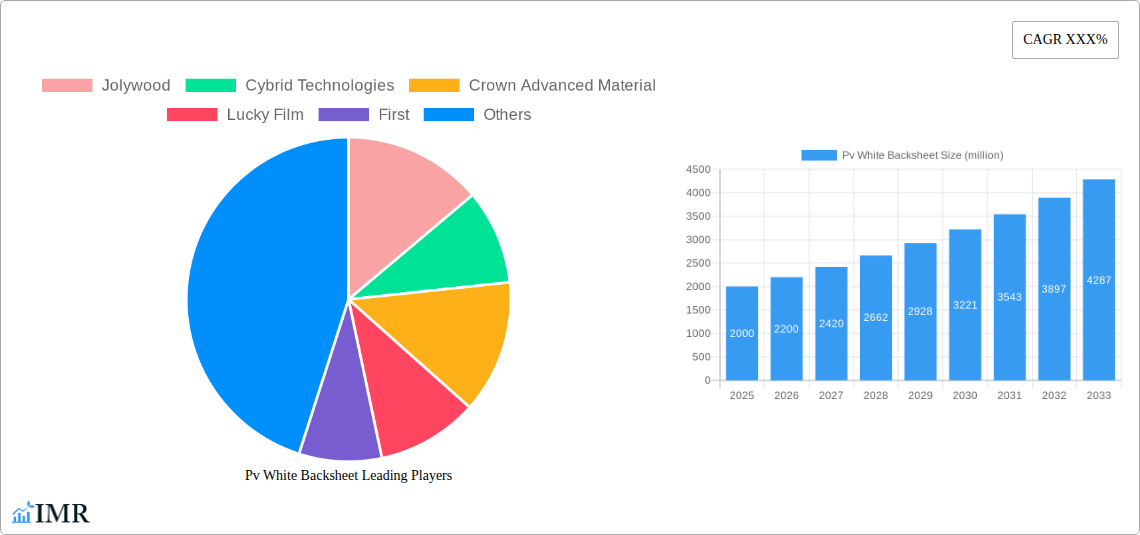
The PV white backsheet market is experiencing robust growth, driven by the increasing demand for high-efficiency photovoltaic (PV) modules. The market's expansion is fueled by several key factors, including the global push towards renewable energy sources, government incentives promoting solar energy adoption, and continuous technological advancements leading to improved backsheet performance and durability. The market is segmented by material type (e.g., fluoropolymer, thermoplastic), application (e.g., crystalline silicon, thin-film), and region. Leading players like Jolywood, Cybrid Technologies, and Crown Advanced Material are actively investing in research and development to enhance product features such as UV resistance, moisture protection, and overall longevity, leading to a competitive landscape characterized by innovation and strategic partnerships. The market is expected to witness significant growth in the forecast period, primarily driven by the increasing adoption of solar energy in emerging economies. While challenges remain such as raw material price fluctuations and potential supply chain disruptions, the long-term outlook for the PV white backsheet market remains exceptionally positive, projected to maintain a healthy compound annual growth rate (CAGR). We estimate the market size in 2025 to be approximately $2 billion, based on industry reports and market analysis.
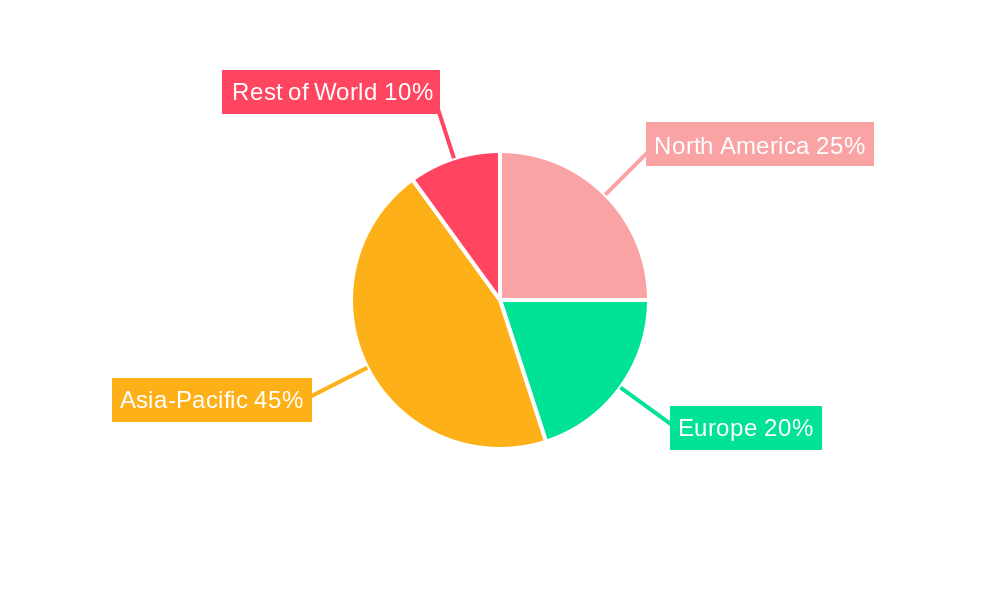
The significant growth trajectory is primarily attributed to the rising global energy demand and the increasing focus on sustainable energy solutions. Technological advancements in backsheet materials are also contributing to this expansion, enhancing module efficiency and durability. Furthermore, government policies and supportive regulations worldwide are significantly impacting market growth, encouraging solar panel deployment across various sectors. The regional distribution of the market is likely to be diverse, with significant contributions from regions like Asia-Pacific (driven by strong solar energy adoption in China and India), North America, and Europe. Competition among key players is fostering innovation and the development of more cost-effective and high-performance backsheets. While potential supply chain constraints and fluctuating material costs pose challenges, the overall market outlook for PV white backsheets remains positive, with substantial potential for future growth through 2033.
PV White Backsheet Market Report: 2019-2033
This comprehensive report provides an in-depth analysis of the global PV White Backsheet market, encompassing market dynamics, growth trends, regional segmentation, product landscape, key players, and future outlook. The study period covers 2019-2033, with 2025 as the base and estimated year. The forecast period extends from 2025 to 2033, and the historical period analyzed is 2019-2024. This report is crucial for industry professionals, investors, and stakeholders seeking to understand and capitalize on opportunities within the rapidly evolving PV White Backsheet sector, spanning the parent market of solar energy and the child market of photovoltaic materials.
PV White Backsheet Market Dynamics & Structure
The global PV White Backsheet market, valued at xx million units in 2024, is characterized by moderate concentration, with key players such as Jolywood, Cybrid Technologies, Crown Advanced Material, and others holding significant market share. Technological innovation, driven by the need for improved backsheet performance and durability, is a primary growth driver. Stringent regulatory frameworks regarding material safety and environmental impact also significantly influence market dynamics. The market faces competition from alternative backsheet materials, but PV White Backsheets maintain a competitive edge due to their superior reflectivity and thermal properties. End-user demographics are primarily driven by the expanding solar energy sector, including residential, commercial, and utility-scale installations. M&A activity has been relatively low in recent years (xx deals in the last 5 years), but is predicted to increase as larger players seek to consolidate market share and expand their product portfolios.
- Market Concentration: Moderately concentrated, with top 5 players holding approximately xx% market share in 2024.
- Technological Innovation: Focus on enhanced reflectivity, UV resistance, and lifespan extension.
- Regulatory Framework: Increasingly stringent environmental regulations driving material innovation.
- Competitive Substitutes: Competition from other backsheet materials, including black and transparent backsheets, but white backsheets maintain a strong position due to their benefits.
- End-User Demographics: Primarily driven by growth in the solar energy sector across various segments.
- M&A Trends: Relatively low activity in recent years, but increasing potential for future consolidation.
PV White Backsheet Growth Trends & Insights
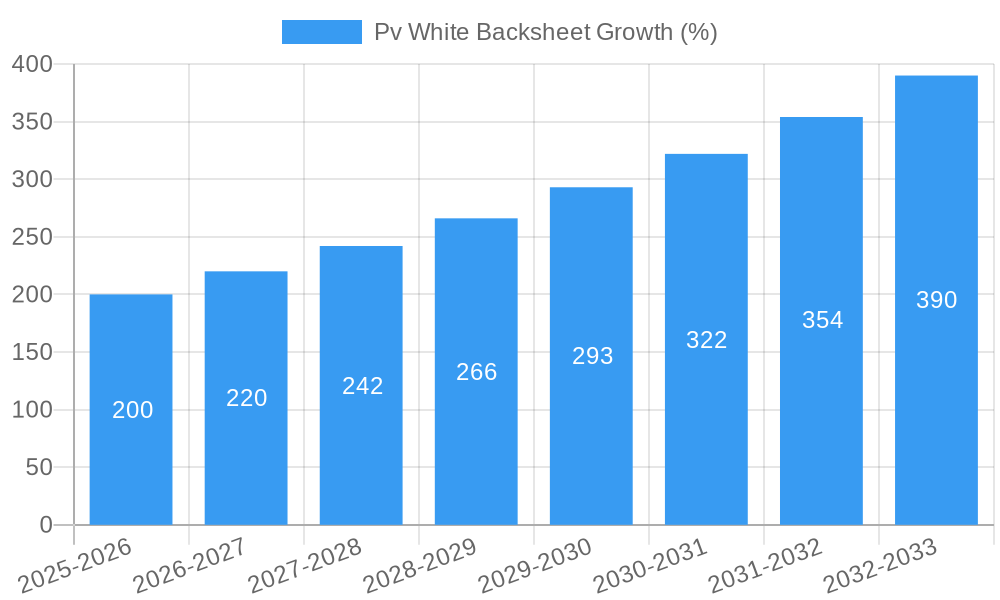
The global PV White Backsheet market experienced a CAGR of xx% during the historical period (2019-2024), driven by factors such as increasing solar energy adoption, favorable government policies, and declining backsheet costs. Market size is projected to reach xx million units by 2025 and xx million units by 2033, exhibiting a robust CAGR of xx% during the forecast period (2025-2033). This growth is fueled by technological advancements leading to improved backsheet efficiency and durability. Consumer behavior shifts towards environmentally friendly energy solutions further boost demand. Market penetration is expected to increase from xx% in 2024 to xx% by 2033, particularly in emerging economies. Technological disruptions, such as the development of advanced materials and manufacturing processes, are key drivers of market evolution.
Dominant Regions, Countries, or Segments in PV White Backsheet
The Asia-Pacific region is currently the dominant market for PV White Backsheets, accounting for approximately xx% of the global market share in 2024. This dominance is driven by the region's robust solar energy sector growth, supportive government policies promoting renewable energy adoption, and the presence of key manufacturing hubs. China, in particular, is a major market driver due to its significant installed solar capacity and extensive manufacturing capabilities. Other regions such as North America and Europe are also showing considerable growth, fueled by increasing environmental concerns and policy support.
- Key Drivers in Asia-Pacific: Rapid growth of the solar energy sector, supportive government policies, and cost-competitive manufacturing.
- China's Dominance: Significant installed solar capacity and thriving domestic manufacturing base.
- Growth Potential in other regions: North America and Europe are experiencing increased demand driven by environmental concerns and policy support.
PV White Backsheet Product Landscape
PV White Backsheets are primarily differentiated by material composition (e.g., fluoropolymer, thermoplastic), thickness, and UV resistance. Recent innovations focus on enhancing reflectivity, durability, and resistance to degradation under harsh environmental conditions. These advancements translate into improved PV module efficiency and extended lifespan. Unique selling propositions often include superior light reflection, enhanced thermal properties, and improved resistance to moisture and UV radiation. Technological advancements are consistently pushing the boundaries of PV White Backsheet performance, ensuring longer operational life and greater cost-effectiveness.
Key Drivers, Barriers & Challenges in PV White Backsheet
Key Drivers: Growing demand for solar energy, increasing government incentives for renewable energy adoption, technological advancements leading to improved backsheet performance, and declining manufacturing costs. Furthermore, a strong focus on improving solar panel efficiency and longevity is increasing the demand for high-quality white backsheets.
Key Barriers & Challenges: Fluctuations in raw material prices, potential supply chain disruptions, stringent environmental regulations, and competition from alternative backsheet materials. These challenges can lead to price volatility and impact the overall market growth. The industry also faces increasing pressure to reduce manufacturing costs and improve sustainability.
Emerging Opportunities in PV White Backsheet
Emerging opportunities include the growing adoption of bifacial solar panels, increasing demand for higher-efficiency PV modules, and the expansion into untapped markets in developing economies. Innovative applications of PV White Backsheets in building-integrated photovoltaics (BIPV) are also creating new avenues for growth. Furthermore, advancements in materials science and manufacturing technologies will continue to provide opportunities for innovation and product differentiation.
Growth Accelerators in the PV White Backsheet Industry
Technological breakthroughs in material science, resulting in enhanced backsheet performance and durability, are key growth accelerators. Strategic partnerships between backsheet manufacturers and solar panel producers are streamlining supply chains and fostering innovation. Expansion into emerging markets, particularly in regions with high solar irradiance and supportive government policies, is also a significant growth catalyst.
Key Players Shaping the PV White Backsheet Market
- Jolywood
- Cybrid Technologies
- Crown Advanced Material
- Lucky Film
- First Solar
- Huitian
- Coveme
- Zhongtian Technology
- SFC Energy
- Toyo Aluminium
- Krempel Solar
- Vishakha
- Endurans Solar
- Dunmore
Notable Milestones in PV White Backsheet Sector
- 2020: Introduction of a new fluoropolymer-based backsheet with enhanced UV resistance by Jolywood.
- 2022: Crown Advanced Material announces a significant expansion of its PV backsheet manufacturing capacity.
- 2023: Cybrid Technologies partners with a major solar panel manufacturer to develop a next-generation PV White Backsheet. (Specific months are not available for all milestones; further detailed information requires access to industry-specific news and publications.)
In-Depth PV White Backsheet Market Outlook
The PV White Backsheet market is poised for continued growth, driven by the global shift towards renewable energy, technological advancements, and expanding solar energy deployment. Strategic opportunities exist for manufacturers to focus on innovation, cost optimization, and market diversification. Expanding into emerging markets and developing sustainable manufacturing processes are critical for long-term success in this dynamic and promising sector.
Pv White Backsheet Segmentation
-
1. Application
- 1.1. Monofacial Module
- 1.2. Bifacial Module
-
2. Type
- 2.1. PET
- 2.2. PVF
- 2.3. PVDF
- 2.4. PA
Pv White Backsheet Segmentation By Geography
-
1. North America
- 1.1. United States
- 1.2. Canada
- 1.3. Mexico
-
2. South America
- 2.1. Brazil
- 2.2. Argentina
- 2.3. Rest of South America
-
3. Europe
- 3.1. United Kingdom
- 3.2. Germany
- 3.3. France
- 3.4. Italy
- 3.5. Spain
- 3.6. Russia
- 3.7. Benelux
- 3.8. Nordics
- 3.9. Rest of Europe
-
4. Middle East & Africa
- 4.1. Turkey
- 4.2. Israel
- 4.3. GCC
- 4.4. North Africa
- 4.5. South Africa
- 4.6. Rest of Middle East & Africa
-
5. Asia Pacific
- 5.1. China
- 5.2. India
- 5.3. Japan
- 5.4. South Korea
- 5.5. ASEAN
- 5.6. Oceania
- 5.7. Rest of Asia Pacific
Pv White Backsheet REPORT HIGHLIGHTS
| Aspects | Details |
|---|---|
| Study Period | 2019-2033 |
| Base Year | 2024 |
| Estimated Year | 2025 |
| Forecast Period | 2025-2033 |
| Historical Period | 2019-2024 |
| Growth Rate | CAGR of XXX% from 2019-2033 |
| Segmentation |
|
Table of Contents
- 1. Introduction
- 1.1. Research Scope
- 1.2. Market Segmentation
- 1.3. Research Methodology
- 1.4. Definitions and Assumptions
- 2. Executive Summary
- 2.1. Introduction
- 3. Market Dynamics
- 3.1. Introduction
- 3.2. Market Drivers
- 3.3. Market Restrains
- 3.4. Market Trends
- 4. Market Factor Analysis
- 4.1. Porters Five Forces
- 4.2. Supply/Value Chain
- 4.3. PESTEL analysis
- 4.4. Market Entropy
- 4.5. Patent/Trademark Analysis
- 5. Global Pv White Backsheet Analysis, Insights and Forecast, 2019-2031
- 5.1. Market Analysis, Insights and Forecast - by Application
- 5.1.1. Monofacial Module
- 5.1.2. Bifacial Module
- 5.2. Market Analysis, Insights and Forecast - by Type
- 5.2.1. PET
- 5.2.2. PVF
- 5.2.3. PVDF
- 5.2.4. PA
- 5.3. Market Analysis, Insights and Forecast - by Region
- 5.3.1. North America
- 5.3.2. South America
- 5.3.3. Europe
- 5.3.4. Middle East & Africa
- 5.3.5. Asia Pacific
- 5.1. Market Analysis, Insights and Forecast - by Application
- 6. North America Pv White Backsheet Analysis, Insights and Forecast, 2019-2031
- 6.1. Market Analysis, Insights and Forecast - by Application
- 6.1.1. Monofacial Module
- 6.1.2. Bifacial Module
- 6.2. Market Analysis, Insights and Forecast - by Type
- 6.2.1. PET
- 6.2.2. PVF
- 6.2.3. PVDF
- 6.2.4. PA
- 6.1. Market Analysis, Insights and Forecast - by Application
- 7. South America Pv White Backsheet Analysis, Insights and Forecast, 2019-2031
- 7.1. Market Analysis, Insights and Forecast - by Application
- 7.1.1. Monofacial Module
- 7.1.2. Bifacial Module
- 7.2. Market Analysis, Insights and Forecast - by Type
- 7.2.1. PET
- 7.2.2. PVF
- 7.2.3. PVDF
- 7.2.4. PA
- 7.1. Market Analysis, Insights and Forecast - by Application
- 8. Europe Pv White Backsheet Analysis, Insights and Forecast, 2019-2031
- 8.1. Market Analysis, Insights and Forecast - by Application
- 8.1.1. Monofacial Module
- 8.1.2. Bifacial Module
- 8.2. Market Analysis, Insights and Forecast - by Type
- 8.2.1. PET
- 8.2.2. PVF
- 8.2.3. PVDF
- 8.2.4. PA
- 8.1. Market Analysis, Insights and Forecast - by Application
- 9. Middle East & Africa Pv White Backsheet Analysis, Insights and Forecast, 2019-2031
- 9.1. Market Analysis, Insights and Forecast - by Application
- 9.1.1. Monofacial Module
- 9.1.2. Bifacial Module
- 9.2. Market Analysis, Insights and Forecast - by Type
- 9.2.1. PET
- 9.2.2. PVF
- 9.2.3. PVDF
- 9.2.4. PA
- 9.1. Market Analysis, Insights and Forecast - by Application
- 10. Asia Pacific Pv White Backsheet Analysis, Insights and Forecast, 2019-2031
- 10.1. Market Analysis, Insights and Forecast - by Application
- 10.1.1. Monofacial Module
- 10.1.2. Bifacial Module
- 10.2. Market Analysis, Insights and Forecast - by Type
- 10.2.1. PET
- 10.2.2. PVF
- 10.2.3. PVDF
- 10.2.4. PA
- 10.1. Market Analysis, Insights and Forecast - by Application
- 11. Competitive Analysis
- 11.1. Global Market Share Analysis 2024
- 11.2. Company Profiles
- 11.2.1 Jolywood
- 11.2.1.1. Overview
- 11.2.1.2. Products
- 11.2.1.3. SWOT Analysis
- 11.2.1.4. Recent Developments
- 11.2.1.5. Financials (Based on Availability)
- 11.2.2 Cybrid Technologies
- 11.2.2.1. Overview
- 11.2.2.2. Products
- 11.2.2.3. SWOT Analysis
- 11.2.2.4. Recent Developments
- 11.2.2.5. Financials (Based on Availability)
- 11.2.3 Crown Advanced Material
- 11.2.3.1. Overview
- 11.2.3.2. Products
- 11.2.3.3. SWOT Analysis
- 11.2.3.4. Recent Developments
- 11.2.3.5. Financials (Based on Availability)
- 11.2.4 Lucky Film
- 11.2.4.1. Overview
- 11.2.4.2. Products
- 11.2.4.3. SWOT Analysis
- 11.2.4.4. Recent Developments
- 11.2.4.5. Financials (Based on Availability)
- 11.2.5 First
- 11.2.5.1. Overview
- 11.2.5.2. Products
- 11.2.5.3. SWOT Analysis
- 11.2.5.4. Recent Developments
- 11.2.5.5. Financials (Based on Availability)
- 11.2.6 Huitian
- 11.2.6.1. Overview
- 11.2.6.2. Products
- 11.2.6.3. SWOT Analysis
- 11.2.6.4. Recent Developments
- 11.2.6.5. Financials (Based on Availability)
- 11.2.7 Coveme
- 11.2.7.1. Overview
- 11.2.7.2. Products
- 11.2.7.3. SWOT Analysis
- 11.2.7.4. Recent Developments
- 11.2.7.5. Financials (Based on Availability)
- 11.2.8 Zhongtian Technology
- 11.2.8.1. Overview
- 11.2.8.2. Products
- 11.2.8.3. SWOT Analysis
- 11.2.8.4. Recent Developments
- 11.2.8.5. Financials (Based on Availability)
- 11.2.9 SFC
- 11.2.9.1. Overview
- 11.2.9.2. Products
- 11.2.9.3. SWOT Analysis
- 11.2.9.4. Recent Developments
- 11.2.9.5. Financials (Based on Availability)
- 11.2.10 Toyo Aluminium
- 11.2.10.1. Overview
- 11.2.10.2. Products
- 11.2.10.3. SWOT Analysis
- 11.2.10.4. Recent Developments
- 11.2.10.5. Financials (Based on Availability)
- 11.2.11 Krempel
- 11.2.11.1. Overview
- 11.2.11.2. Products
- 11.2.11.3. SWOT Analysis
- 11.2.11.4. Recent Developments
- 11.2.11.5. Financials (Based on Availability)
- 11.2.12 Vishakha
- 11.2.12.1. Overview
- 11.2.12.2. Products
- 11.2.12.3. SWOT Analysis
- 11.2.12.4. Recent Developments
- 11.2.12.5. Financials (Based on Availability)
- 11.2.13 Endurans Solar
- 11.2.13.1. Overview
- 11.2.13.2. Products
- 11.2.13.3. SWOT Analysis
- 11.2.13.4. Recent Developments
- 11.2.13.5. Financials (Based on Availability)
- 11.2.14 Dunmore
- 11.2.14.1. Overview
- 11.2.14.2. Products
- 11.2.14.3. SWOT Analysis
- 11.2.14.4. Recent Developments
- 11.2.14.5. Financials (Based on Availability)
- 11.2.1 Jolywood
List of Figures
- Figure 1: Global Pv White Backsheet Revenue Breakdown (million, %) by Region 2024 & 2032
- Figure 2: North America Pv White Backsheet Revenue (million), by Application 2024 & 2032
- Figure 3: North America Pv White Backsheet Revenue Share (%), by Application 2024 & 2032
- Figure 4: North America Pv White Backsheet Revenue (million), by Type 2024 & 2032
- Figure 5: North America Pv White Backsheet Revenue Share (%), by Type 2024 & 2032
- Figure 6: North America Pv White Backsheet Revenue (million), by Country 2024 & 2032
- Figure 7: North America Pv White Backsheet Revenue Share (%), by Country 2024 & 2032
- Figure 8: South America Pv White Backsheet Revenue (million), by Application 2024 & 2032
- Figure 9: South America Pv White Backsheet Revenue Share (%), by Application 2024 & 2032
- Figure 10: South America Pv White Backsheet Revenue (million), by Type 2024 & 2032
- Figure 11: South America Pv White Backsheet Revenue Share (%), by Type 2024 & 2032
- Figure 12: South America Pv White Backsheet Revenue (million), by Country 2024 & 2032
- Figure 13: South America Pv White Backsheet Revenue Share (%), by Country 2024 & 2032
- Figure 14: Europe Pv White Backsheet Revenue (million), by Application 2024 & 2032
- Figure 15: Europe Pv White Backsheet Revenue Share (%), by Application 2024 & 2032
- Figure 16: Europe Pv White Backsheet Revenue (million), by Type 2024 & 2032
- Figure 17: Europe Pv White Backsheet Revenue Share (%), by Type 2024 & 2032
- Figure 18: Europe Pv White Backsheet Revenue (million), by Country 2024 & 2032
- Figure 19: Europe Pv White Backsheet Revenue Share (%), by Country 2024 & 2032
- Figure 20: Middle East & Africa Pv White Backsheet Revenue (million), by Application 2024 & 2032
- Figure 21: Middle East & Africa Pv White Backsheet Revenue Share (%), by Application 2024 & 2032
- Figure 22: Middle East & Africa Pv White Backsheet Revenue (million), by Type 2024 & 2032
- Figure 23: Middle East & Africa Pv White Backsheet Revenue Share (%), by Type 2024 & 2032
- Figure 24: Middle East & Africa Pv White Backsheet Revenue (million), by Country 2024 & 2032
- Figure 25: Middle East & Africa Pv White Backsheet Revenue Share (%), by Country 2024 & 2032
- Figure 26: Asia Pacific Pv White Backsheet Revenue (million), by Application 2024 & 2032
- Figure 27: Asia Pacific Pv White Backsheet Revenue Share (%), by Application 2024 & 2032
- Figure 28: Asia Pacific Pv White Backsheet Revenue (million), by Type 2024 & 2032
- Figure 29: Asia Pacific Pv White Backsheet Revenue Share (%), by Type 2024 & 2032
- Figure 30: Asia Pacific Pv White Backsheet Revenue (million), by Country 2024 & 2032
- Figure 31: Asia Pacific Pv White Backsheet Revenue Share (%), by Country 2024 & 2032
List of Tables
- Table 1: Global Pv White Backsheet Revenue million Forecast, by Region 2019 & 2032
- Table 2: Global Pv White Backsheet Revenue million Forecast, by Application 2019 & 2032
- Table 3: Global Pv White Backsheet Revenue million Forecast, by Type 2019 & 2032
- Table 4: Global Pv White Backsheet Revenue million Forecast, by Region 2019 & 2032
- Table 5: Global Pv White Backsheet Revenue million Forecast, by Application 2019 & 2032
- Table 6: Global Pv White Backsheet Revenue million Forecast, by Type 2019 & 2032
- Table 7: Global Pv White Backsheet Revenue million Forecast, by Country 2019 & 2032
- Table 8: United States Pv White Backsheet Revenue (million) Forecast, by Application 2019 & 2032
- Table 9: Canada Pv White Backsheet Revenue (million) Forecast, by Application 2019 & 2032
- Table 10: Mexico Pv White Backsheet Revenue (million) Forecast, by Application 2019 & 2032
- Table 11: Global Pv White Backsheet Revenue million Forecast, by Application 2019 & 2032
- Table 12: Global Pv White Backsheet Revenue million Forecast, by Type 2019 & 2032
- Table 13: Global Pv White Backsheet Revenue million Forecast, by Country 2019 & 2032
- Table 14: Brazil Pv White Backsheet Revenue (million) Forecast, by Application 2019 & 2032
- Table 15: Argentina Pv White Backsheet Revenue (million) Forecast, by Application 2019 & 2032
- Table 16: Rest of South America Pv White Backsheet Revenue (million) Forecast, by Application 2019 & 2032
- Table 17: Global Pv White Backsheet Revenue million Forecast, by Application 2019 & 2032
- Table 18: Global Pv White Backsheet Revenue million Forecast, by Type 2019 & 2032
- Table 19: Global Pv White Backsheet Revenue million Forecast, by Country 2019 & 2032
- Table 20: United Kingdom Pv White Backsheet Revenue (million) Forecast, by Application 2019 & 2032
- Table 21: Germany Pv White Backsheet Revenue (million) Forecast, by Application 2019 & 2032
- Table 22: France Pv White Backsheet Revenue (million) Forecast, by Application 2019 & 2032
- Table 23: Italy Pv White Backsheet Revenue (million) Forecast, by Application 2019 & 2032
- Table 24: Spain Pv White Backsheet Revenue (million) Forecast, by Application 2019 & 2032
- Table 25: Russia Pv White Backsheet Revenue (million) Forecast, by Application 2019 & 2032
- Table 26: Benelux Pv White Backsheet Revenue (million) Forecast, by Application 2019 & 2032
- Table 27: Nordics Pv White Backsheet Revenue (million) Forecast, by Application 2019 & 2032
- Table 28: Rest of Europe Pv White Backsheet Revenue (million) Forecast, by Application 2019 & 2032
- Table 29: Global Pv White Backsheet Revenue million Forecast, by Application 2019 & 2032
- Table 30: Global Pv White Backsheet Revenue million Forecast, by Type 2019 & 2032
- Table 31: Global Pv White Backsheet Revenue million Forecast, by Country 2019 & 2032
- Table 32: Turkey Pv White Backsheet Revenue (million) Forecast, by Application 2019 & 2032
- Table 33: Israel Pv White Backsheet Revenue (million) Forecast, by Application 2019 & 2032
- Table 34: GCC Pv White Backsheet Revenue (million) Forecast, by Application 2019 & 2032
- Table 35: North Africa Pv White Backsheet Revenue (million) Forecast, by Application 2019 & 2032
- Table 36: South Africa Pv White Backsheet Revenue (million) Forecast, by Application 2019 & 2032
- Table 37: Rest of Middle East & Africa Pv White Backsheet Revenue (million) Forecast, by Application 2019 & 2032
- Table 38: Global Pv White Backsheet Revenue million Forecast, by Application 2019 & 2032
- Table 39: Global Pv White Backsheet Revenue million Forecast, by Type 2019 & 2032
- Table 40: Global Pv White Backsheet Revenue million Forecast, by Country 2019 & 2032
- Table 41: China Pv White Backsheet Revenue (million) Forecast, by Application 2019 & 2032
- Table 42: India Pv White Backsheet Revenue (million) Forecast, by Application 2019 & 2032
- Table 43: Japan Pv White Backsheet Revenue (million) Forecast, by Application 2019 & 2032
- Table 44: South Korea Pv White Backsheet Revenue (million) Forecast, by Application 2019 & 2032
- Table 45: ASEAN Pv White Backsheet Revenue (million) Forecast, by Application 2019 & 2032
- Table 46: Oceania Pv White Backsheet Revenue (million) Forecast, by Application 2019 & 2032
- Table 47: Rest of Asia Pacific Pv White Backsheet Revenue (million) Forecast, by Application 2019 & 2032
Frequently Asked Questions
1. What is the projected Compound Annual Growth Rate (CAGR) of the Pv White Backsheet?
The projected CAGR is approximately XXX%.
2. Which companies are prominent players in the Pv White Backsheet?
Key companies in the market include Jolywood, Cybrid Technologies, Crown Advanced Material, Lucky Film, First, Huitian, Coveme, Zhongtian Technology, SFC, Toyo Aluminium, Krempel, Vishakha, Endurans Solar, Dunmore.
3. What are the main segments of the Pv White Backsheet?
The market segments include Application, Type.
4. Can you provide details about the market size?
The market size is estimated to be USD XXX million as of 2022.
5. What are some drivers contributing to market growth?
N/A
6. What are the notable trends driving market growth?
N/A
7. Are there any restraints impacting market growth?
N/A
8. Can you provide examples of recent developments in the market?
N/A
9. What pricing options are available for accessing the report?
Pricing options include single-user, multi-user, and enterprise licenses priced at USD 4250.00, USD 6375.00, and USD 8500.00 respectively.
10. Is the market size provided in terms of value or volume?
The market size is provided in terms of value, measured in million.
11. Are there any specific market keywords associated with the report?
Yes, the market keyword associated with the report is "Pv White Backsheet," which aids in identifying and referencing the specific market segment covered.
12. How do I determine which pricing option suits my needs best?
The pricing options vary based on user requirements and access needs. Individual users may opt for single-user licenses, while businesses requiring broader access may choose multi-user or enterprise licenses for cost-effective access to the report.
13. Are there any additional resources or data provided in the Pv White Backsheet report?
While the report offers comprehensive insights, it's advisable to review the specific contents or supplementary materials provided to ascertain if additional resources or data are available.
14. How can I stay updated on further developments or reports in the Pv White Backsheet?
To stay informed about further developments, trends, and reports in the Pv White Backsheet, consider subscribing to industry newsletters, following relevant companies and organizations, or regularly checking reputable industry news sources and publications.
Methodology
Step 1 - Identification of Relevant Samples Size from Population Database


Step 2 - Approaches for Defining Global Market Size (Value, Volume* & Price*)

Note*: In applicable scenarios
Step 3 - Data Sources
Primary Research
- Web Analytics
- Survey Reports
- Research Institute
- Latest Research Reports
- Opinion Leaders
Secondary Research
- Annual Reports
- White Paper
- Latest Press Release
- Industry Association
- Paid Database
- Investor Presentations

Step 4 - Data Triangulation
Involves using different sources of information in order to increase the validity of a study
These sources are likely to be stakeholders in a program - participants, other researchers, program staff, other community members, and so on.
Then we put all data in single framework & apply various statistical tools to find out the dynamic on the market.
During the analysis stage, feedback from the stakeholder groups would be compared to determine areas of agreement as well as areas of divergence
