

Key Insights
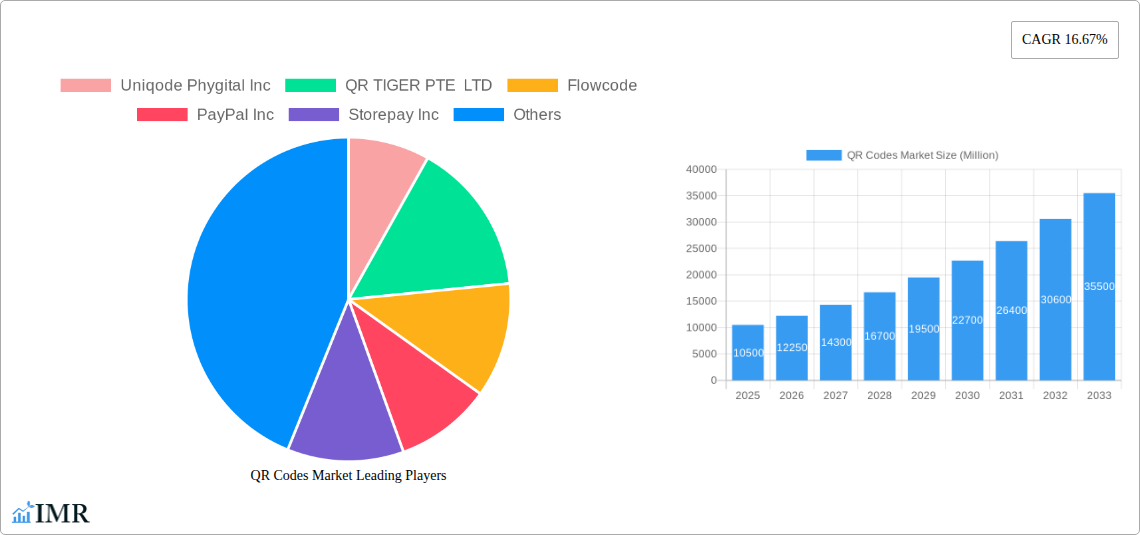
The global QR code market is experiencing robust growth, projected to reach a market size of $10.5 billion in 2025, expanding at a compound annual growth rate (CAGR) of 16.67% from 2025 to 2033. This surge is fueled by several key drivers. The increasing adoption of mobile payment systems globally, particularly in emerging economies, is significantly boosting QR code usage for transactions. The ease and cost-effectiveness of QR code integration compared to traditional payment methods make it an attractive option for businesses of all sizes. Furthermore, the integration of QR codes with marketing and loyalty programs enhances customer engagement and brand building, creating a strong incentive for widespread adoption. Growing smartphone penetration and improved internet infrastructure are further contributing factors to this market expansion. Competition among various QR code solution providers, like Uniqode Phygital Inc, QR TIGER PTE LTD, and Flowcode, is driving innovation and improving the functionalities of QR codes, including features like dynamic content updates and advanced analytics. This competitive landscape is beneficial to market growth as it ensures a constant stream of new applications and improvements to the technology. While potential restraints such as security concerns and the need for robust digital literacy remain, the overall market trajectory indicates a bright future for QR code technology.
The forecast period from 2025 to 2033 suggests continued significant growth, driven by the ongoing digital transformation across various sectors. Expansion into new applications beyond payments, such as accessing information, marketing campaigns, and supply chain management, will broaden the market's reach. Regional variations will likely exist, with markets in Asia-Pacific and other developing regions experiencing potentially higher growth rates due to increasing smartphone penetration and the rapid expansion of e-commerce. The ongoing refinement of QR code technology, incorporating advanced security measures and enhanced user experience, will likely address current restraints and further accelerate market expansion in the coming years. Strategic partnerships and collaborations between technology providers and businesses across different sectors will be crucial in unlocking the full potential of QR code technology and shaping its future landscape.
QR Codes Market: A Comprehensive Report (2019-2033)
This in-depth report provides a comprehensive analysis of the QR Codes Market, encompassing market dynamics, growth trends, regional dominance, product landscape, key players, and future outlook. The study period covers 2019-2033, with 2025 as the base and estimated year. The report delves into the parent market of digital payment systems and the child market of mobile marketing solutions, offering granular insights for industry professionals and investors. The market size is projected to reach xx Million units by 2033.
QR Codes Market Dynamics & Structure
The QR Codes Market exhibits a moderately concentrated structure with a few dominant players and numerous niche players. Technological innovation, particularly in dynamic QR codes and integration with mobile payment systems, significantly fuels market growth. Regulatory frameworks vary across geographies, impacting adoption rates and market penetration. Competitive substitutes include NFC technology and traditional barcode systems, but QR codes maintain a leading position due to their versatility and ease of implementation. End-user demographics are expanding beyond early adopters, encompassing businesses of all sizes, and individual consumers. M&A activity is moderate, driven by strategic acquisitions to expand product offerings and geographical reach.
- Market Concentration: Moderately concentrated, with top 5 players holding xx% market share (2025).
- Technological Innovation: Dynamic QR codes, improved analytics, and integration with payment gateways are key drivers.
- Regulatory Frameworks: Vary across regions, impacting adoption and creating opportunities for compliance-focused solutions.
- Competitive Substitutes: NFC technology and traditional barcodes pose some competition.
- End-User Demographics: Expanding rapidly to include SMEs, enterprises, and individual consumers.
- M&A Trends: Moderate activity, focused on strategic expansions and technology integration. xx M&A deals estimated in the last 5 years.
QR Codes Market Growth Trends & Insights
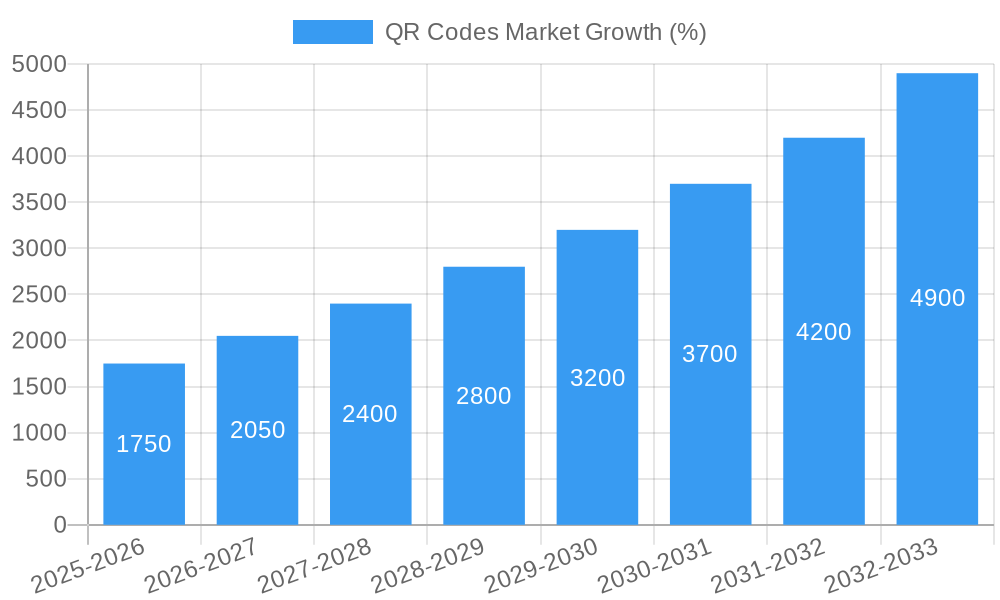
The QR Codes Market has experienced significant growth from 2019 to 2024, driven by increased smartphone penetration, the rise of mobile payments, and the growing adoption of digital marketing strategies. The market size witnessed a CAGR of xx% during the historical period (2019-2024) and is projected to maintain a CAGR of xx% during the forecast period (2025-2033). This growth is fueled by technological disruptions, such as the integration of QR codes with augmented reality (AR) and artificial intelligence (AI), enhancing user experience and data analytics. Consumer behavior shifts toward contactless transactions and digital engagement significantly contribute to market expansion. Market penetration is expected to reach xx% by 2033.
Dominant Regions, Countries, or Segments in QR Codes Market
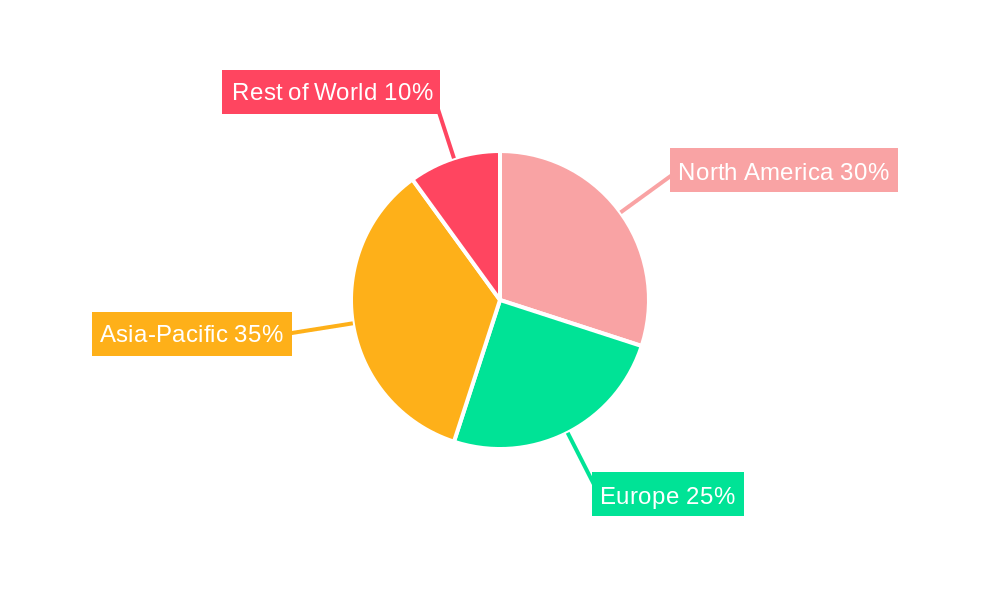
Asia-Pacific dominates the QR Codes Market due to high smartphone penetration, thriving mobile payment ecosystems (particularly in China and India), and government initiatives promoting digital transactions. North America and Europe follow as significant markets, driven by the increasing adoption of QR codes in marketing, retail, and supply chain management. The rapid adoption of digital payment methods and favorable regulatory environments further fuel the growth.
- Asia-Pacific: High smartphone penetration, mature mobile payment infrastructure, government support.
- North America: Strong adoption in retail and marketing, advanced technological infrastructure.
- Europe: Growing acceptance in various sectors, supportive regulatory frameworks in certain regions.
QR Codes Market Product Landscape
The QR Codes Market offers a range of products, from static to dynamic QR codes, each with unique features and applications. Dynamic QR codes allow for modifications post-creation, offering greater flexibility and improved tracking capabilities. Advanced features include analytics dashboards, integrated payment gateways, and personalized user journeys, enhancing the effectiveness of QR code implementations. Performance metrics include scan rates, conversion rates, and return on investment (ROI).
Key Drivers, Barriers & Challenges in QR Codes Market
Key Drivers:
- Increasing smartphone penetration globally.
- The rise of contactless payments and digital transactions.
- Growing adoption of digital marketing and advertising strategies.
- Technological advancements in QR code functionalities.
Key Challenges:
- Security concerns regarding data privacy and fraud.
- Interoperability issues across different QR code platforms.
- The need for widespread consumer awareness and education.
- Competition from alternative technologies (e.g., NFC). xx% of businesses still primarily use traditional methods.
Emerging Opportunities in QR Codes Market
- Integration with IoT devices and smart home technologies.
- Expanding applications in supply chain management and logistics.
- Personalized user experiences through dynamic QR code functionalities.
- Growth in the use of QR codes for interactive advertising and gamification.
Growth Accelerators in the QR Codes Market Industry
Technological advancements, such as the integration of AI and AR into QR code technology, are major growth catalysts. Strategic partnerships between QR code providers and payment gateways, marketing platforms, and other technology companies are also driving market expansion. Expanding into new industries, such as healthcare and education, will further fuel long-term growth.
Key Players Shaping the QR Codes Market Market
- Uniqode Phygital Inc
- QR TIGER PTE LTD
- Flowcode
- PayPal Inc
- Storepay Inc
- UnionPay International Co Ltd
- Block Inc (Square)
- Nearex Technologies Pvt Ltd
- LINE Pay Corporation
- Revolut Technologies Inc
- Ecentric Payment Systems
- Clover Network LLC *List Not Exhaustive
Notable Milestones in QR Codes Market Sector
- July 2024: Bandhan Bank launched a payment solution using Bharat QR Code for current and savings account customers, enhancing payment convenience for self-employed individuals.
- June 2024: Flowcode launched a reimagined product focusing on measuring and maximizing offline conversions for large enterprises, improving data integration and personalized user experiences.
In-Depth QR Codes Market Market Outlook
The QR Codes Market is poised for significant growth over the next decade, fueled by continuous technological innovation, increasing adoption across various sectors, and expanding consumer awareness. Strategic partnerships and market expansion into untapped regions and industries will further enhance market potential. Opportunities abound for companies offering innovative solutions, robust analytics, and seamless integration with existing technologies.
QR Codes Market Segmentation
-
1. Type
- 1.1. Website QR Code
- 1.2. Menu QR Code
- 1.3. File Download QR Code
- 1.4. Social Media QR Code
- 1.5. App Store
- 1.6. Others
-
2. Format
- 2.1. Static QR Code
- 2.2. Dynamic QR Code
-
3. End-User Application
- 3.1. Marketing and advertising
- 3.2. Payments and Transactions
- 3.3. Information Sharing
- 3.4. Customer engagement
- 3.5. Others
QR Codes Market Segmentation By Geography
- 1. North America
- 2. Europe
- 3. Asia
- 4. Australia and New Zealand
- 5. Latin America
- 6. Middle East and Africa
QR Codes Market REPORT HIGHLIGHTS
| Aspects | Details |
|---|---|
| Study Period | 2019-2033 |
| Base Year | 2024 |
| Estimated Year | 2025 |
| Forecast Period | 2025-2033 |
| Historical Period | 2019-2024 |
| Growth Rate | CAGR of 16.67% from 2019-2033 |
| Segmentation |
|
Table of Contents
- 1. Introduction
- 1.1. Research Scope
- 1.2. Market Segmentation
- 1.3. Research Methodology
- 1.4. Definitions and Assumptions
- 2. Executive Summary
- 2.1. Introduction
- 3. Market Dynamics
- 3.1. Introduction
- 3.2. Market Drivers
- 3.2.1. Increased Smartphone Penetration; Growing Demand for Contactless Solutions; Increasing need for Security and Fraud Prevention
- 3.3. Market Restrains
- 3.3.1. Increased Smartphone Penetration; Growing Demand for Contactless Solutions; Increasing need for Security and Fraud Prevention
- 3.4. Market Trends
- 3.4.1. The Payments and Transactions Segment is Anticipated to Witness a Significant Growth
- 4. Market Factor Analysis
- 4.1. Porters Five Forces
- 4.2. Supply/Value Chain
- 4.3. PESTEL analysis
- 4.4. Market Entropy
- 4.5. Patent/Trademark Analysis
- 5. Global QR Codes Market Analysis, Insights and Forecast, 2019-2031
- 5.1. Market Analysis, Insights and Forecast - by Type
- 5.1.1. Website QR Code
- 5.1.2. Menu QR Code
- 5.1.3. File Download QR Code
- 5.1.4. Social Media QR Code
- 5.1.5. App Store
- 5.1.6. Others
- 5.2. Market Analysis, Insights and Forecast - by Format
- 5.2.1. Static QR Code
- 5.2.2. Dynamic QR Code
- 5.3. Market Analysis, Insights and Forecast - by End-User Application
- 5.3.1. Marketing and advertising
- 5.3.2. Payments and Transactions
- 5.3.3. Information Sharing
- 5.3.4. Customer engagement
- 5.3.5. Others
- 5.4. Market Analysis, Insights and Forecast - by Region
- 5.4.1. North America
- 5.4.2. Europe
- 5.4.3. Asia
- 5.4.4. Australia and New Zealand
- 5.4.5. Latin America
- 5.4.6. Middle East and Africa
- 5.1. Market Analysis, Insights and Forecast - by Type
- 6. North America QR Codes Market Analysis, Insights and Forecast, 2019-2031
- 6.1. Market Analysis, Insights and Forecast - by Type
- 6.1.1. Website QR Code
- 6.1.2. Menu QR Code
- 6.1.3. File Download QR Code
- 6.1.4. Social Media QR Code
- 6.1.5. App Store
- 6.1.6. Others
- 6.2. Market Analysis, Insights and Forecast - by Format
- 6.2.1. Static QR Code
- 6.2.2. Dynamic QR Code
- 6.3. Market Analysis, Insights and Forecast - by End-User Application
- 6.3.1. Marketing and advertising
- 6.3.2. Payments and Transactions
- 6.3.3. Information Sharing
- 6.3.4. Customer engagement
- 6.3.5. Others
- 6.1. Market Analysis, Insights and Forecast - by Type
- 7. Europe QR Codes Market Analysis, Insights and Forecast, 2019-2031
- 7.1. Market Analysis, Insights and Forecast - by Type
- 7.1.1. Website QR Code
- 7.1.2. Menu QR Code
- 7.1.3. File Download QR Code
- 7.1.4. Social Media QR Code
- 7.1.5. App Store
- 7.1.6. Others
- 7.2. Market Analysis, Insights and Forecast - by Format
- 7.2.1. Static QR Code
- 7.2.2. Dynamic QR Code
- 7.3. Market Analysis, Insights and Forecast - by End-User Application
- 7.3.1. Marketing and advertising
- 7.3.2. Payments and Transactions
- 7.3.3. Information Sharing
- 7.3.4. Customer engagement
- 7.3.5. Others
- 7.1. Market Analysis, Insights and Forecast - by Type
- 8. Asia QR Codes Market Analysis, Insights and Forecast, 2019-2031
- 8.1. Market Analysis, Insights and Forecast - by Type
- 8.1.1. Website QR Code
- 8.1.2. Menu QR Code
- 8.1.3. File Download QR Code
- 8.1.4. Social Media QR Code
- 8.1.5. App Store
- 8.1.6. Others
- 8.2. Market Analysis, Insights and Forecast - by Format
- 8.2.1. Static QR Code
- 8.2.2. Dynamic QR Code
- 8.3. Market Analysis, Insights and Forecast - by End-User Application
- 8.3.1. Marketing and advertising
- 8.3.2. Payments and Transactions
- 8.3.3. Information Sharing
- 8.3.4. Customer engagement
- 8.3.5. Others
- 8.1. Market Analysis, Insights and Forecast - by Type
- 9. Australia and New Zealand QR Codes Market Analysis, Insights and Forecast, 2019-2031
- 9.1. Market Analysis, Insights and Forecast - by Type
- 9.1.1. Website QR Code
- 9.1.2. Menu QR Code
- 9.1.3. File Download QR Code
- 9.1.4. Social Media QR Code
- 9.1.5. App Store
- 9.1.6. Others
- 9.2. Market Analysis, Insights and Forecast - by Format
- 9.2.1. Static QR Code
- 9.2.2. Dynamic QR Code
- 9.3. Market Analysis, Insights and Forecast - by End-User Application
- 9.3.1. Marketing and advertising
- 9.3.2. Payments and Transactions
- 9.3.3. Information Sharing
- 9.3.4. Customer engagement
- 9.3.5. Others
- 9.1. Market Analysis, Insights and Forecast - by Type
- 10. Latin America QR Codes Market Analysis, Insights and Forecast, 2019-2031
- 10.1. Market Analysis, Insights and Forecast - by Type
- 10.1.1. Website QR Code
- 10.1.2. Menu QR Code
- 10.1.3. File Download QR Code
- 10.1.4. Social Media QR Code
- 10.1.5. App Store
- 10.1.6. Others
- 10.2. Market Analysis, Insights and Forecast - by Format
- 10.2.1. Static QR Code
- 10.2.2. Dynamic QR Code
- 10.3. Market Analysis, Insights and Forecast - by End-User Application
- 10.3.1. Marketing and advertising
- 10.3.2. Payments and Transactions
- 10.3.3. Information Sharing
- 10.3.4. Customer engagement
- 10.3.5. Others
- 10.1. Market Analysis, Insights and Forecast - by Type
- 11. Middle East and Africa QR Codes Market Analysis, Insights and Forecast, 2019-2031
- 11.1. Market Analysis, Insights and Forecast - by Type
- 11.1.1. Website QR Code
- 11.1.2. Menu QR Code
- 11.1.3. File Download QR Code
- 11.1.4. Social Media QR Code
- 11.1.5. App Store
- 11.1.6. Others
- 11.2. Market Analysis, Insights and Forecast - by Format
- 11.2.1. Static QR Code
- 11.2.2. Dynamic QR Code
- 11.3. Market Analysis, Insights and Forecast - by End-User Application
- 11.3.1. Marketing and advertising
- 11.3.2. Payments and Transactions
- 11.3.3. Information Sharing
- 11.3.4. Customer engagement
- 11.3.5. Others
- 11.1. Market Analysis, Insights and Forecast - by Type
- 12. Competitive Analysis
- 12.1. Global Market Share Analysis 2024
- 12.2. Company Profiles
- 12.2.1 Uniqode Phygital Inc
- 12.2.1.1. Overview
- 12.2.1.2. Products
- 12.2.1.3. SWOT Analysis
- 12.2.1.4. Recent Developments
- 12.2.1.5. Financials (Based on Availability)
- 12.2.2 QR TIGER PTE LTD
- 12.2.2.1. Overview
- 12.2.2.2. Products
- 12.2.2.3. SWOT Analysis
- 12.2.2.4. Recent Developments
- 12.2.2.5. Financials (Based on Availability)
- 12.2.3 Flowcode
- 12.2.3.1. Overview
- 12.2.3.2. Products
- 12.2.3.3. SWOT Analysis
- 12.2.3.4. Recent Developments
- 12.2.3.5. Financials (Based on Availability)
- 12.2.4 PayPal Inc
- 12.2.4.1. Overview
- 12.2.4.2. Products
- 12.2.4.3. SWOT Analysis
- 12.2.4.4. Recent Developments
- 12.2.4.5. Financials (Based on Availability)
- 12.2.5 Storepay Inc
- 12.2.5.1. Overview
- 12.2.5.2. Products
- 12.2.5.3. SWOT Analysis
- 12.2.5.4. Recent Developments
- 12.2.5.5. Financials (Based on Availability)
- 12.2.6 UnionPay International Co Ltd
- 12.2.6.1. Overview
- 12.2.6.2. Products
- 12.2.6.3. SWOT Analysis
- 12.2.6.4. Recent Developments
- 12.2.6.5. Financials (Based on Availability)
- 12.2.7 Block Inc (Square)
- 12.2.7.1. Overview
- 12.2.7.2. Products
- 12.2.7.3. SWOT Analysis
- 12.2.7.4. Recent Developments
- 12.2.7.5. Financials (Based on Availability)
- 12.2.8 Nearex Technologies Pvt Ltd
- 12.2.8.1. Overview
- 12.2.8.2. Products
- 12.2.8.3. SWOT Analysis
- 12.2.8.4. Recent Developments
- 12.2.8.5. Financials (Based on Availability)
- 12.2.9 LINE Pay Corporation
- 12.2.9.1. Overview
- 12.2.9.2. Products
- 12.2.9.3. SWOT Analysis
- 12.2.9.4. Recent Developments
- 12.2.9.5. Financials (Based on Availability)
- 12.2.10 Revolut Technologies Inc
- 12.2.10.1. Overview
- 12.2.10.2. Products
- 12.2.10.3. SWOT Analysis
- 12.2.10.4. Recent Developments
- 12.2.10.5. Financials (Based on Availability)
- 12.2.11 Ecentric Payment Systems
- 12.2.11.1. Overview
- 12.2.11.2. Products
- 12.2.11.3. SWOT Analysis
- 12.2.11.4. Recent Developments
- 12.2.11.5. Financials (Based on Availability)
- 12.2.12 Clover Network LLC*List Not Exhaustive
- 12.2.12.1. Overview
- 12.2.12.2. Products
- 12.2.12.3. SWOT Analysis
- 12.2.12.4. Recent Developments
- 12.2.12.5. Financials (Based on Availability)
- 12.2.1 Uniqode Phygital Inc
List of Figures
- Figure 1: Global QR Codes Market Revenue Breakdown (Million, %) by Region 2024 & 2032
- Figure 2: Global QR Codes Market Volume Breakdown (Billion, %) by Region 2024 & 2032
- Figure 3: North America QR Codes Market Revenue (Million), by Type 2024 & 2032
- Figure 4: North America QR Codes Market Volume (Billion), by Type 2024 & 2032
- Figure 5: North America QR Codes Market Revenue Share (%), by Type 2024 & 2032
- Figure 6: North America QR Codes Market Volume Share (%), by Type 2024 & 2032
- Figure 7: North America QR Codes Market Revenue (Million), by Format 2024 & 2032
- Figure 8: North America QR Codes Market Volume (Billion), by Format 2024 & 2032
- Figure 9: North America QR Codes Market Revenue Share (%), by Format 2024 & 2032
- Figure 10: North America QR Codes Market Volume Share (%), by Format 2024 & 2032
- Figure 11: North America QR Codes Market Revenue (Million), by End-User Application 2024 & 2032
- Figure 12: North America QR Codes Market Volume (Billion), by End-User Application 2024 & 2032
- Figure 13: North America QR Codes Market Revenue Share (%), by End-User Application 2024 & 2032
- Figure 14: North America QR Codes Market Volume Share (%), by End-User Application 2024 & 2032
- Figure 15: North America QR Codes Market Revenue (Million), by Country 2024 & 2032
- Figure 16: North America QR Codes Market Volume (Billion), by Country 2024 & 2032
- Figure 17: North America QR Codes Market Revenue Share (%), by Country 2024 & 2032
- Figure 18: North America QR Codes Market Volume Share (%), by Country 2024 & 2032
- Figure 19: Europe QR Codes Market Revenue (Million), by Type 2024 & 2032
- Figure 20: Europe QR Codes Market Volume (Billion), by Type 2024 & 2032
- Figure 21: Europe QR Codes Market Revenue Share (%), by Type 2024 & 2032
- Figure 22: Europe QR Codes Market Volume Share (%), by Type 2024 & 2032
- Figure 23: Europe QR Codes Market Revenue (Million), by Format 2024 & 2032
- Figure 24: Europe QR Codes Market Volume (Billion), by Format 2024 & 2032
- Figure 25: Europe QR Codes Market Revenue Share (%), by Format 2024 & 2032
- Figure 26: Europe QR Codes Market Volume Share (%), by Format 2024 & 2032
- Figure 27: Europe QR Codes Market Revenue (Million), by End-User Application 2024 & 2032
- Figure 28: Europe QR Codes Market Volume (Billion), by End-User Application 2024 & 2032
- Figure 29: Europe QR Codes Market Revenue Share (%), by End-User Application 2024 & 2032
- Figure 30: Europe QR Codes Market Volume Share (%), by End-User Application 2024 & 2032
- Figure 31: Europe QR Codes Market Revenue (Million), by Country 2024 & 2032
- Figure 32: Europe QR Codes Market Volume (Billion), by Country 2024 & 2032
- Figure 33: Europe QR Codes Market Revenue Share (%), by Country 2024 & 2032
- Figure 34: Europe QR Codes Market Volume Share (%), by Country 2024 & 2032
- Figure 35: Asia QR Codes Market Revenue (Million), by Type 2024 & 2032
- Figure 36: Asia QR Codes Market Volume (Billion), by Type 2024 & 2032
- Figure 37: Asia QR Codes Market Revenue Share (%), by Type 2024 & 2032
- Figure 38: Asia QR Codes Market Volume Share (%), by Type 2024 & 2032
- Figure 39: Asia QR Codes Market Revenue (Million), by Format 2024 & 2032
- Figure 40: Asia QR Codes Market Volume (Billion), by Format 2024 & 2032
- Figure 41: Asia QR Codes Market Revenue Share (%), by Format 2024 & 2032
- Figure 42: Asia QR Codes Market Volume Share (%), by Format 2024 & 2032
- Figure 43: Asia QR Codes Market Revenue (Million), by End-User Application 2024 & 2032
- Figure 44: Asia QR Codes Market Volume (Billion), by End-User Application 2024 & 2032
- Figure 45: Asia QR Codes Market Revenue Share (%), by End-User Application 2024 & 2032
- Figure 46: Asia QR Codes Market Volume Share (%), by End-User Application 2024 & 2032
- Figure 47: Asia QR Codes Market Revenue (Million), by Country 2024 & 2032
- Figure 48: Asia QR Codes Market Volume (Billion), by Country 2024 & 2032
- Figure 49: Asia QR Codes Market Revenue Share (%), by Country 2024 & 2032
- Figure 50: Asia QR Codes Market Volume Share (%), by Country 2024 & 2032
- Figure 51: Australia and New Zealand QR Codes Market Revenue (Million), by Type 2024 & 2032
- Figure 52: Australia and New Zealand QR Codes Market Volume (Billion), by Type 2024 & 2032
- Figure 53: Australia and New Zealand QR Codes Market Revenue Share (%), by Type 2024 & 2032
- Figure 54: Australia and New Zealand QR Codes Market Volume Share (%), by Type 2024 & 2032
- Figure 55: Australia and New Zealand QR Codes Market Revenue (Million), by Format 2024 & 2032
- Figure 56: Australia and New Zealand QR Codes Market Volume (Billion), by Format 2024 & 2032
- Figure 57: Australia and New Zealand QR Codes Market Revenue Share (%), by Format 2024 & 2032
- Figure 58: Australia and New Zealand QR Codes Market Volume Share (%), by Format 2024 & 2032
- Figure 59: Australia and New Zealand QR Codes Market Revenue (Million), by End-User Application 2024 & 2032
- Figure 60: Australia and New Zealand QR Codes Market Volume (Billion), by End-User Application 2024 & 2032
- Figure 61: Australia and New Zealand QR Codes Market Revenue Share (%), by End-User Application 2024 & 2032
- Figure 62: Australia and New Zealand QR Codes Market Volume Share (%), by End-User Application 2024 & 2032
- Figure 63: Australia and New Zealand QR Codes Market Revenue (Million), by Country 2024 & 2032
- Figure 64: Australia and New Zealand QR Codes Market Volume (Billion), by Country 2024 & 2032
- Figure 65: Australia and New Zealand QR Codes Market Revenue Share (%), by Country 2024 & 2032
- Figure 66: Australia and New Zealand QR Codes Market Volume Share (%), by Country 2024 & 2032
- Figure 67: Latin America QR Codes Market Revenue (Million), by Type 2024 & 2032
- Figure 68: Latin America QR Codes Market Volume (Billion), by Type 2024 & 2032
- Figure 69: Latin America QR Codes Market Revenue Share (%), by Type 2024 & 2032
- Figure 70: Latin America QR Codes Market Volume Share (%), by Type 2024 & 2032
- Figure 71: Latin America QR Codes Market Revenue (Million), by Format 2024 & 2032
- Figure 72: Latin America QR Codes Market Volume (Billion), by Format 2024 & 2032
- Figure 73: Latin America QR Codes Market Revenue Share (%), by Format 2024 & 2032
- Figure 74: Latin America QR Codes Market Volume Share (%), by Format 2024 & 2032
- Figure 75: Latin America QR Codes Market Revenue (Million), by End-User Application 2024 & 2032
- Figure 76: Latin America QR Codes Market Volume (Billion), by End-User Application 2024 & 2032
- Figure 77: Latin America QR Codes Market Revenue Share (%), by End-User Application 2024 & 2032
- Figure 78: Latin America QR Codes Market Volume Share (%), by End-User Application 2024 & 2032
- Figure 79: Latin America QR Codes Market Revenue (Million), by Country 2024 & 2032
- Figure 80: Latin America QR Codes Market Volume (Billion), by Country 2024 & 2032
- Figure 81: Latin America QR Codes Market Revenue Share (%), by Country 2024 & 2032
- Figure 82: Latin America QR Codes Market Volume Share (%), by Country 2024 & 2032
- Figure 83: Middle East and Africa QR Codes Market Revenue (Million), by Type 2024 & 2032
- Figure 84: Middle East and Africa QR Codes Market Volume (Billion), by Type 2024 & 2032
- Figure 85: Middle East and Africa QR Codes Market Revenue Share (%), by Type 2024 & 2032
- Figure 86: Middle East and Africa QR Codes Market Volume Share (%), by Type 2024 & 2032
- Figure 87: Middle East and Africa QR Codes Market Revenue (Million), by Format 2024 & 2032
- Figure 88: Middle East and Africa QR Codes Market Volume (Billion), by Format 2024 & 2032
- Figure 89: Middle East and Africa QR Codes Market Revenue Share (%), by Format 2024 & 2032
- Figure 90: Middle East and Africa QR Codes Market Volume Share (%), by Format 2024 & 2032
- Figure 91: Middle East and Africa QR Codes Market Revenue (Million), by End-User Application 2024 & 2032
- Figure 92: Middle East and Africa QR Codes Market Volume (Billion), by End-User Application 2024 & 2032
- Figure 93: Middle East and Africa QR Codes Market Revenue Share (%), by End-User Application 2024 & 2032
- Figure 94: Middle East and Africa QR Codes Market Volume Share (%), by End-User Application 2024 & 2032
- Figure 95: Middle East and Africa QR Codes Market Revenue (Million), by Country 2024 & 2032
- Figure 96: Middle East and Africa QR Codes Market Volume (Billion), by Country 2024 & 2032
- Figure 97: Middle East and Africa QR Codes Market Revenue Share (%), by Country 2024 & 2032
- Figure 98: Middle East and Africa QR Codes Market Volume Share (%), by Country 2024 & 2032
List of Tables
- Table 1: Global QR Codes Market Revenue Million Forecast, by Region 2019 & 2032
- Table 2: Global QR Codes Market Volume Billion Forecast, by Region 2019 & 2032
- Table 3: Global QR Codes Market Revenue Million Forecast, by Type 2019 & 2032
- Table 4: Global QR Codes Market Volume Billion Forecast, by Type 2019 & 2032
- Table 5: Global QR Codes Market Revenue Million Forecast, by Format 2019 & 2032
- Table 6: Global QR Codes Market Volume Billion Forecast, by Format 2019 & 2032
- Table 7: Global QR Codes Market Revenue Million Forecast, by End-User Application 2019 & 2032
- Table 8: Global QR Codes Market Volume Billion Forecast, by End-User Application 2019 & 2032
- Table 9: Global QR Codes Market Revenue Million Forecast, by Region 2019 & 2032
- Table 10: Global QR Codes Market Volume Billion Forecast, by Region 2019 & 2032
- Table 11: Global QR Codes Market Revenue Million Forecast, by Type 2019 & 2032
- Table 12: Global QR Codes Market Volume Billion Forecast, by Type 2019 & 2032
- Table 13: Global QR Codes Market Revenue Million Forecast, by Format 2019 & 2032
- Table 14: Global QR Codes Market Volume Billion Forecast, by Format 2019 & 2032
- Table 15: Global QR Codes Market Revenue Million Forecast, by End-User Application 2019 & 2032
- Table 16: Global QR Codes Market Volume Billion Forecast, by End-User Application 2019 & 2032
- Table 17: Global QR Codes Market Revenue Million Forecast, by Country 2019 & 2032
- Table 18: Global QR Codes Market Volume Billion Forecast, by Country 2019 & 2032
- Table 19: Global QR Codes Market Revenue Million Forecast, by Type 2019 & 2032
- Table 20: Global QR Codes Market Volume Billion Forecast, by Type 2019 & 2032
- Table 21: Global QR Codes Market Revenue Million Forecast, by Format 2019 & 2032
- Table 22: Global QR Codes Market Volume Billion Forecast, by Format 2019 & 2032
- Table 23: Global QR Codes Market Revenue Million Forecast, by End-User Application 2019 & 2032
- Table 24: Global QR Codes Market Volume Billion Forecast, by End-User Application 2019 & 2032
- Table 25: Global QR Codes Market Revenue Million Forecast, by Country 2019 & 2032
- Table 26: Global QR Codes Market Volume Billion Forecast, by Country 2019 & 2032
- Table 27: Global QR Codes Market Revenue Million Forecast, by Type 2019 & 2032
- Table 28: Global QR Codes Market Volume Billion Forecast, by Type 2019 & 2032
- Table 29: Global QR Codes Market Revenue Million Forecast, by Format 2019 & 2032
- Table 30: Global QR Codes Market Volume Billion Forecast, by Format 2019 & 2032
- Table 31: Global QR Codes Market Revenue Million Forecast, by End-User Application 2019 & 2032
- Table 32: Global QR Codes Market Volume Billion Forecast, by End-User Application 2019 & 2032
- Table 33: Global QR Codes Market Revenue Million Forecast, by Country 2019 & 2032
- Table 34: Global QR Codes Market Volume Billion Forecast, by Country 2019 & 2032
- Table 35: Global QR Codes Market Revenue Million Forecast, by Type 2019 & 2032
- Table 36: Global QR Codes Market Volume Billion Forecast, by Type 2019 & 2032
- Table 37: Global QR Codes Market Revenue Million Forecast, by Format 2019 & 2032
- Table 38: Global QR Codes Market Volume Billion Forecast, by Format 2019 & 2032
- Table 39: Global QR Codes Market Revenue Million Forecast, by End-User Application 2019 & 2032
- Table 40: Global QR Codes Market Volume Billion Forecast, by End-User Application 2019 & 2032
- Table 41: Global QR Codes Market Revenue Million Forecast, by Country 2019 & 2032
- Table 42: Global QR Codes Market Volume Billion Forecast, by Country 2019 & 2032
- Table 43: Global QR Codes Market Revenue Million Forecast, by Type 2019 & 2032
- Table 44: Global QR Codes Market Volume Billion Forecast, by Type 2019 & 2032
- Table 45: Global QR Codes Market Revenue Million Forecast, by Format 2019 & 2032
- Table 46: Global QR Codes Market Volume Billion Forecast, by Format 2019 & 2032
- Table 47: Global QR Codes Market Revenue Million Forecast, by End-User Application 2019 & 2032
- Table 48: Global QR Codes Market Volume Billion Forecast, by End-User Application 2019 & 2032
- Table 49: Global QR Codes Market Revenue Million Forecast, by Country 2019 & 2032
- Table 50: Global QR Codes Market Volume Billion Forecast, by Country 2019 & 2032
- Table 51: Global QR Codes Market Revenue Million Forecast, by Type 2019 & 2032
- Table 52: Global QR Codes Market Volume Billion Forecast, by Type 2019 & 2032
- Table 53: Global QR Codes Market Revenue Million Forecast, by Format 2019 & 2032
- Table 54: Global QR Codes Market Volume Billion Forecast, by Format 2019 & 2032
- Table 55: Global QR Codes Market Revenue Million Forecast, by End-User Application 2019 & 2032
- Table 56: Global QR Codes Market Volume Billion Forecast, by End-User Application 2019 & 2032
- Table 57: Global QR Codes Market Revenue Million Forecast, by Country 2019 & 2032
- Table 58: Global QR Codes Market Volume Billion Forecast, by Country 2019 & 2032
Frequently Asked Questions
1. What is the projected Compound Annual Growth Rate (CAGR) of the QR Codes Market?
The projected CAGR is approximately 16.67%.
2. Which companies are prominent players in the QR Codes Market?
Key companies in the market include Uniqode Phygital Inc, QR TIGER PTE LTD, Flowcode, PayPal Inc, Storepay Inc, UnionPay International Co Ltd, Block Inc (Square), Nearex Technologies Pvt Ltd, LINE Pay Corporation, Revolut Technologies Inc, Ecentric Payment Systems, Clover Network LLC*List Not Exhaustive.
3. What are the main segments of the QR Codes Market?
The market segments include Type, Format, End-User Application.
4. Can you provide details about the market size?
The market size is estimated to be USD 10.5 Million as of 2022.
5. What are some drivers contributing to market growth?
Increased Smartphone Penetration; Growing Demand for Contactless Solutions; Increasing need for Security and Fraud Prevention.
6. What are the notable trends driving market growth?
The Payments and Transactions Segment is Anticipated to Witness a Significant Growth.
7. Are there any restraints impacting market growth?
Increased Smartphone Penetration; Growing Demand for Contactless Solutions; Increasing need for Security and Fraud Prevention.
8. Can you provide examples of recent developments in the market?
July 2024: Bandhan Bank launched its latest payment solution through the Bharat QR Code for its Current account and Savings account customers. The bank claimed that the solution will simplify how these self-employed segment customers make payments at any merchant outlet. An instant notification will also be received on every payment through a small speaker.June 2024: Flowcode, a marketing technology platform, unveiled a reimagined product designed for marketing and analytics teams at F1000 companies focused on measuring and maximizing offline conversions. Flowcode integrates seamlessly with data feeds, such as product catalogs, MLS listings, and more, to automate the creation of personalized, QR-enabled user journeys. This empowers brands to deliver unique, tailored consumer experiences, significantly increasing conversion rates.
9. What pricing options are available for accessing the report?
Pricing options include single-user, multi-user, and enterprise licenses priced at USD 4750, USD 5250, and USD 8750 respectively.
10. Is the market size provided in terms of value or volume?
The market size is provided in terms of value, measured in Million and volume, measured in Billion.
11. Are there any specific market keywords associated with the report?
Yes, the market keyword associated with the report is "QR Codes Market," which aids in identifying and referencing the specific market segment covered.
12. How do I determine which pricing option suits my needs best?
The pricing options vary based on user requirements and access needs. Individual users may opt for single-user licenses, while businesses requiring broader access may choose multi-user or enterprise licenses for cost-effective access to the report.
13. Are there any additional resources or data provided in the QR Codes Market report?
While the report offers comprehensive insights, it's advisable to review the specific contents or supplementary materials provided to ascertain if additional resources or data are available.
14. How can I stay updated on further developments or reports in the QR Codes Market?
To stay informed about further developments, trends, and reports in the QR Codes Market, consider subscribing to industry newsletters, following relevant companies and organizations, or regularly checking reputable industry news sources and publications.
Methodology
Step 1 - Identification of Relevant Samples Size from Population Database


Step 2 - Approaches for Defining Global Market Size (Value, Volume* & Price*)

Note*: In applicable scenarios
Step 3 - Data Sources
Primary Research
- Web Analytics
- Survey Reports
- Research Institute
- Latest Research Reports
- Opinion Leaders
Secondary Research
- Annual Reports
- White Paper
- Latest Press Release
- Industry Association
- Paid Database
- Investor Presentations

Step 4 - Data Triangulation
Involves using different sources of information in order to increase the validity of a study
These sources are likely to be stakeholders in a program - participants, other researchers, program staff, other community members, and so on.
Then we put all data in single framework & apply various statistical tools to find out the dynamic on the market.
During the analysis stage, feedback from the stakeholder groups would be compared to determine areas of agreement as well as areas of divergence
