

Key Insights
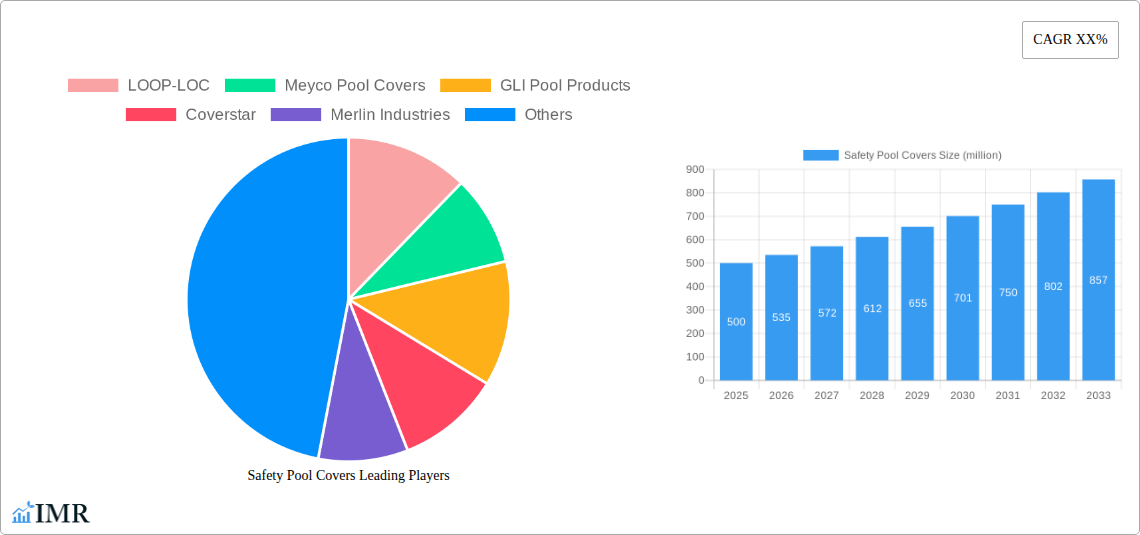
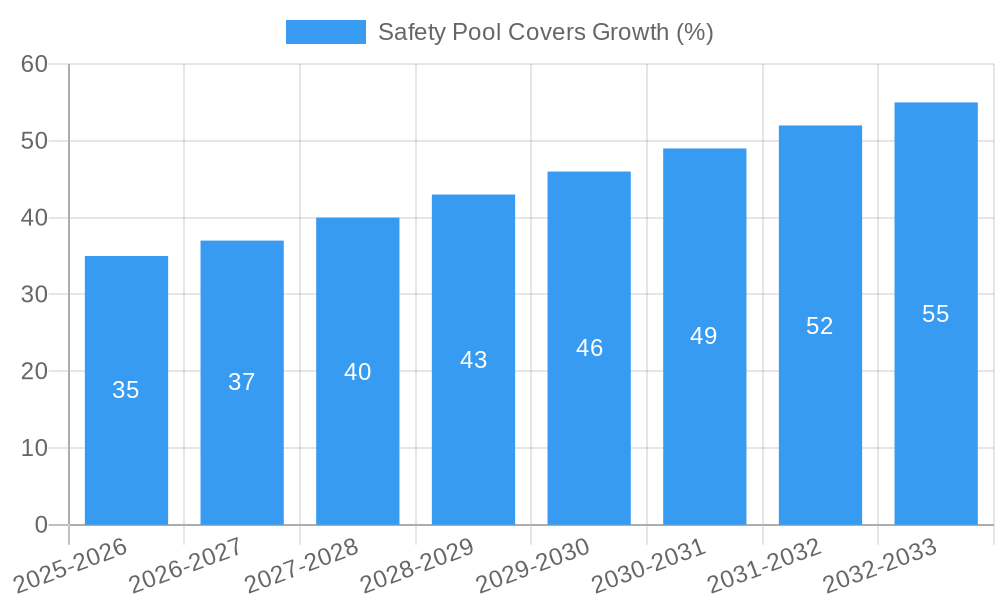
The global safety pool cover market is experiencing robust growth, driven by increasing awareness of pool safety, particularly concerning accidental drowning, especially among children. Stringent safety regulations being implemented worldwide are further fueling market expansion. The market's value is estimated at $500 million in 2025, exhibiting a compound annual growth rate (CAGR) of 7% from 2025-2033. This growth is propelled by several key trends, including the rising adoption of automated pool covers, the increasing preference for aesthetically pleasing and durable cover options, and the growing demand for covers offering enhanced features such as solar heating capabilities or integrated security systems. Leading market players like LOOP-LOC, Meyco Pool Covers, and GLI Pool Products are constantly innovating to meet these evolving demands. While the initial investment in safety pool covers might be perceived as a restraint for some consumers, the long-term cost savings related to reduced energy consumption (in the case of solar covers) and the invaluable benefit of enhanced safety are increasingly outweighing this factor.
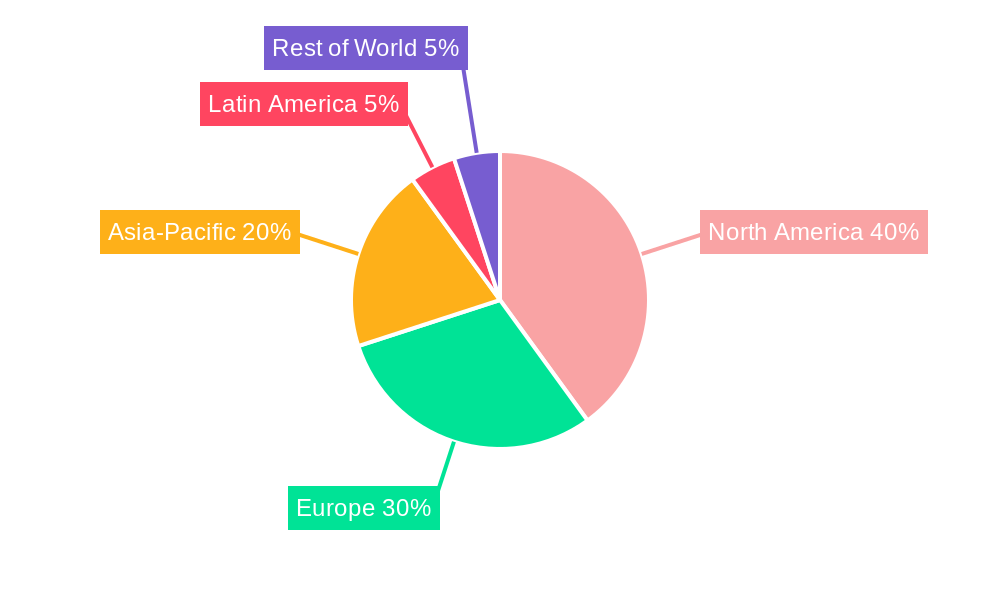
The market segmentation is diverse, encompassing various cover types (automatic, manual, mesh, solid), materials (vinyl, mesh, fabric), and distribution channels (online retailers, pool supply stores, and contractors). Regional variations exist, with North America and Europe currently holding the largest market shares due to high awareness and established safety standards. However, developing regions in Asia-Pacific and Latin America present significant growth potential as disposable incomes rise and safety awareness campaigns gain traction. Competition is relatively high, with numerous established players and smaller niche players vying for market share. Companies are increasingly focusing on building brand recognition, customer loyalty, and offering comprehensive after-sales service to stay competitive. The forecast period (2025-2033) predicts continued growth, driven by the aforementioned factors, leading to a substantial expansion of the safety pool covers market.
Safety Pool Covers Market Report: 2019-2033
This comprehensive report provides an in-depth analysis of the safety pool covers market, encompassing market dynamics, growth trends, regional segmentation, product landscape, competitive analysis, and future outlook. The study period covers 2019-2033, with 2025 as the base and estimated year. The forecast period is 2025-2033, and the historical period is 2019-2024. This report is crucial for industry professionals, investors, and anyone seeking a detailed understanding of this growing market, valued at xx million units in 2025.
Safety Pool Covers Market Dynamics & Structure
The safety pool covers market is characterized by moderate concentration, with key players like LOOP-LOC, Meyco Pool Covers, and GLI Pool Products holding significant market share (estimated collectively at xx%). Technological innovation, driven by advancements in materials science and automation, is a key growth driver. Stringent safety regulations, particularly in regions with high residential pool ownership, further propel market expansion. The market faces competition from alternative safety measures, such as pool fences, but the convenience and aesthetic appeal of safety pool covers maintain their position. M&A activity within the sector remains relatively low (xx deals in the past five years), indicating a stable, yet competitive landscape. End-user demographics show a strong correlation between higher disposable income and safety pool cover adoption.
- Market Concentration: Moderately concentrated, with top 3 players holding xx% market share.
- Technological Innovation: Focus on automated cover systems, stronger materials (e.g., reinforced polymers), and improved safety features.
- Regulatory Landscape: Stringent safety standards in developed nations drive demand.
- Competitive Substitutes: Pool fencing and other safety barriers present competition.
- End-User Demographics: Higher adoption rates in households with higher disposable income and young children.
- M&A Activity: Relatively low, with xx deals recorded between 2019 and 2024.
Safety Pool Covers Growth Trends & Insights
The global safety pool covers market exhibited a CAGR of xx% during 2019-2024, reaching an estimated value of xx million units in 2025. This growth is attributed to rising disposable incomes, increasing awareness of pool safety, and favorable government regulations. Technological advancements, such as the introduction of automated and self-retracting covers, have significantly impacted adoption rates, particularly within the luxury residential segment. Consumer behavior shifts, reflecting a preference for convenience and enhanced aesthetic appeal, further contribute to market expansion. The market penetration rate is estimated at xx% in developed regions and is projected to rise significantly in developing economies over the forecast period.
Dominant Regions, Countries, or Segments in Safety Pool Covers
North America (specifically the US) currently holds the largest market share in safety pool covers, driven by high residential pool ownership and robust regulatory frameworks supporting pool safety. Factors contributing to this dominance include:
- High Residential Pool Ownership: The US has a significantly higher number of residential pools than other regions.
- Stringent Safety Regulations: Mandatory safety standards in several states boost demand.
- High Disposable Incomes: Affluent populations can afford premium safety pool covers.
- Strong Awareness of Pool Safety: Well-established safety campaigns raise consumer consciousness.
Europe and Australia also show considerable market presence, driven by similar factors, though at a slightly lower scale than North America. The growth potential in Asia-Pacific is substantial, fueled by increasing disposable income and rising awareness of water safety.
Safety Pool Covers Product Landscape
Safety pool covers have undergone significant advancements, incorporating innovative materials, improved designs, and increased safety features. Products range from basic manual covers to automated systems with advanced features, such as remote control and integrated safety sensors. The emphasis is on durability, ease of use, and aesthetic appeal, with various styles and colors available to match pool designs. Unique selling propositions often include superior strength, weather resistance, and easy maintenance.
Key Drivers, Barriers & Challenges in Safety Pool Covers
Key Drivers: Rising consumer awareness of pool safety, stringent regulations mandating safety measures, growing disposable incomes, and technological advancements driving product improvements.
Challenges and Restraints: High initial investment costs can be a barrier to entry for some consumers. Competition from alternative safety solutions and fluctuating raw material prices also pose challenges. Supply chain disruptions experienced in recent years resulted in a xx% decrease in production in 2022, impacting market availability.
Emerging Opportunities in Safety Pool Covers
Untapped markets in developing countries present significant opportunities for expansion. Smart home integration and the development of eco-friendly, sustainable materials are also emerging trends with significant potential. Customized designs and specialized covers for unique pool shapes and sizes offer further growth potential.
Growth Accelerators in the Safety Pool Covers Industry
Technological advancements in automation and material science will be crucial for driving long-term growth. Strategic partnerships between manufacturers and pool installers can broaden market reach. Expansion into emerging markets through effective distribution networks will further accelerate market expansion.
Key Players Shaping the Safety Pool Covers Market
- LOOP-LOC
- Meyco Pool Covers
- GLI Pool Products
- Coverstar
- Merlin Industries
- Doheny's
- Garrett Liners
- HPI Pool Industries
- All-Safe Pool Fence & Covers
- Performance Pool Products
- Blue Wave Products
Notable Milestones in Safety Pool Covers Sector
- 2021: LOOP-LOC launched a new line of automated safety covers.
- 2022: Increased adoption of solar-powered automated covers.
- 2023: Introduction of safety covers with integrated smart home technology.
In-Depth Safety Pool Covers Market Outlook
The safety pool covers market is poised for sustained growth, driven by technological advancements, rising safety awareness, and expansion into untapped markets. Strategic partnerships, product innovation, and targeted marketing efforts will be pivotal for companies aiming to capture significant market share in the coming years. The market is expected to reach xx million units by 2033, exhibiting a CAGR of xx%.
Safety Pool Covers Segmentation
-
1. Application
- 1.1. Private
- 1.2. Public
- 1.3. Commercial
-
2. Types
- 2.1. Mesh Materials Covers
- 2.2. Solid Materials Covers
- 2.3. Hybrid Materials Covers
Safety Pool Covers Segmentation By Geography
-
1. North America
- 1.1. United States
- 1.2. Canada
- 1.3. Mexico
-
2. South America
- 2.1. Brazil
- 2.2. Argentina
- 2.3. Rest of South America
-
3. Europe
- 3.1. United Kingdom
- 3.2. Germany
- 3.3. France
- 3.4. Italy
- 3.5. Spain
- 3.6. Russia
- 3.7. Benelux
- 3.8. Nordics
- 3.9. Rest of Europe
-
4. Middle East & Africa
- 4.1. Turkey
- 4.2. Israel
- 4.3. GCC
- 4.4. North Africa
- 4.5. South Africa
- 4.6. Rest of Middle East & Africa
-
5. Asia Pacific
- 5.1. China
- 5.2. India
- 5.3. Japan
- 5.4. South Korea
- 5.5. ASEAN
- 5.6. Oceania
- 5.7. Rest of Asia Pacific
Safety Pool Covers REPORT HIGHLIGHTS
| Aspects | Details |
|---|---|
| Study Period | 2019-2033 |
| Base Year | 2024 |
| Estimated Year | 2025 |
| Forecast Period | 2025-2033 |
| Historical Period | 2019-2024 |
| Growth Rate | CAGR of XX% from 2019-2033 |
| Segmentation |
|
Table of Contents
- 1. Introduction
- 1.1. Research Scope
- 1.2. Market Segmentation
- 1.3. Research Methodology
- 1.4. Definitions and Assumptions
- 2. Executive Summary
- 2.1. Introduction
- 3. Market Dynamics
- 3.1. Introduction
- 3.2. Market Drivers
- 3.3. Market Restrains
- 3.4. Market Trends
- 4. Market Factor Analysis
- 4.1. Porters Five Forces
- 4.2. Supply/Value Chain
- 4.3. PESTEL analysis
- 4.4. Market Entropy
- 4.5. Patent/Trademark Analysis
- 5. Global Safety Pool Covers Analysis, Insights and Forecast, 2019-2031
- 5.1. Market Analysis, Insights and Forecast - by Application
- 5.1.1. Private
- 5.1.2. Public
- 5.1.3. Commercial
- 5.2. Market Analysis, Insights and Forecast - by Types
- 5.2.1. Mesh Materials Covers
- 5.2.2. Solid Materials Covers
- 5.2.3. Hybrid Materials Covers
- 5.3. Market Analysis, Insights and Forecast - by Region
- 5.3.1. North America
- 5.3.2. South America
- 5.3.3. Europe
- 5.3.4. Middle East & Africa
- 5.3.5. Asia Pacific
- 5.1. Market Analysis, Insights and Forecast - by Application
- 6. North America Safety Pool Covers Analysis, Insights and Forecast, 2019-2031
- 6.1. Market Analysis, Insights and Forecast - by Application
- 6.1.1. Private
- 6.1.2. Public
- 6.1.3. Commercial
- 6.2. Market Analysis, Insights and Forecast - by Types
- 6.2.1. Mesh Materials Covers
- 6.2.2. Solid Materials Covers
- 6.2.3. Hybrid Materials Covers
- 6.1. Market Analysis, Insights and Forecast - by Application
- 7. South America Safety Pool Covers Analysis, Insights and Forecast, 2019-2031
- 7.1. Market Analysis, Insights and Forecast - by Application
- 7.1.1. Private
- 7.1.2. Public
- 7.1.3. Commercial
- 7.2. Market Analysis, Insights and Forecast - by Types
- 7.2.1. Mesh Materials Covers
- 7.2.2. Solid Materials Covers
- 7.2.3. Hybrid Materials Covers
- 7.1. Market Analysis, Insights and Forecast - by Application
- 8. Europe Safety Pool Covers Analysis, Insights and Forecast, 2019-2031
- 8.1. Market Analysis, Insights and Forecast - by Application
- 8.1.1. Private
- 8.1.2. Public
- 8.1.3. Commercial
- 8.2. Market Analysis, Insights and Forecast - by Types
- 8.2.1. Mesh Materials Covers
- 8.2.2. Solid Materials Covers
- 8.2.3. Hybrid Materials Covers
- 8.1. Market Analysis, Insights and Forecast - by Application
- 9. Middle East & Africa Safety Pool Covers Analysis, Insights and Forecast, 2019-2031
- 9.1. Market Analysis, Insights and Forecast - by Application
- 9.1.1. Private
- 9.1.2. Public
- 9.1.3. Commercial
- 9.2. Market Analysis, Insights and Forecast - by Types
- 9.2.1. Mesh Materials Covers
- 9.2.2. Solid Materials Covers
- 9.2.3. Hybrid Materials Covers
- 9.1. Market Analysis, Insights and Forecast - by Application
- 10. Asia Pacific Safety Pool Covers Analysis, Insights and Forecast, 2019-2031
- 10.1. Market Analysis, Insights and Forecast - by Application
- 10.1.1. Private
- 10.1.2. Public
- 10.1.3. Commercial
- 10.2. Market Analysis, Insights and Forecast - by Types
- 10.2.1. Mesh Materials Covers
- 10.2.2. Solid Materials Covers
- 10.2.3. Hybrid Materials Covers
- 10.1. Market Analysis, Insights and Forecast - by Application
- 11. Competitive Analysis
- 11.1. Global Market Share Analysis 2024
- 11.2. Company Profiles
- 11.2.1 LOOP-LOC
- 11.2.1.1. Overview
- 11.2.1.2. Products
- 11.2.1.3. SWOT Analysis
- 11.2.1.4. Recent Developments
- 11.2.1.5. Financials (Based on Availability)
- 11.2.2 Meyco Pool Covers
- 11.2.2.1. Overview
- 11.2.2.2. Products
- 11.2.2.3. SWOT Analysis
- 11.2.2.4. Recent Developments
- 11.2.2.5. Financials (Based on Availability)
- 11.2.3 GLI Pool Products
- 11.2.3.1. Overview
- 11.2.3.2. Products
- 11.2.3.3. SWOT Analysis
- 11.2.3.4. Recent Developments
- 11.2.3.5. Financials (Based on Availability)
- 11.2.4 Coverstar
- 11.2.4.1. Overview
- 11.2.4.2. Products
- 11.2.4.3. SWOT Analysis
- 11.2.4.4. Recent Developments
- 11.2.4.5. Financials (Based on Availability)
- 11.2.5 Merlin Industries
- 11.2.5.1. Overview
- 11.2.5.2. Products
- 11.2.5.3. SWOT Analysis
- 11.2.5.4. Recent Developments
- 11.2.5.5. Financials (Based on Availability)
- 11.2.6 Doheny's
- 11.2.6.1. Overview
- 11.2.6.2. Products
- 11.2.6.3. SWOT Analysis
- 11.2.6.4. Recent Developments
- 11.2.6.5. Financials (Based on Availability)
- 11.2.7 Garrett Liners
- 11.2.7.1. Overview
- 11.2.7.2. Products
- 11.2.7.3. SWOT Analysis
- 11.2.7.4. Recent Developments
- 11.2.7.5. Financials (Based on Availability)
- 11.2.8 HPI Pool Industries
- 11.2.8.1. Overview
- 11.2.8.2. Products
- 11.2.8.3. SWOT Analysis
- 11.2.8.4. Recent Developments
- 11.2.8.5. Financials (Based on Availability)
- 11.2.9 All-Safe Pool Fence & Covers
- 11.2.9.1. Overview
- 11.2.9.2. Products
- 11.2.9.3. SWOT Analysis
- 11.2.9.4. Recent Developments
- 11.2.9.5. Financials (Based on Availability)
- 11.2.10 Performance Pool Products
- 11.2.10.1. Overview
- 11.2.10.2. Products
- 11.2.10.3. SWOT Analysis
- 11.2.10.4. Recent Developments
- 11.2.10.5. Financials (Based on Availability)
- 11.2.11 Blue Wave Products
- 11.2.11.1. Overview
- 11.2.11.2. Products
- 11.2.11.3. SWOT Analysis
- 11.2.11.4. Recent Developments
- 11.2.11.5. Financials (Based on Availability)
- 11.2.1 LOOP-LOC
List of Figures
- Figure 1: Global Safety Pool Covers Revenue Breakdown (million, %) by Region 2024 & 2032
- Figure 2: North America Safety Pool Covers Revenue (million), by Application 2024 & 2032
- Figure 3: North America Safety Pool Covers Revenue Share (%), by Application 2024 & 2032
- Figure 4: North America Safety Pool Covers Revenue (million), by Types 2024 & 2032
- Figure 5: North America Safety Pool Covers Revenue Share (%), by Types 2024 & 2032
- Figure 6: North America Safety Pool Covers Revenue (million), by Country 2024 & 2032
- Figure 7: North America Safety Pool Covers Revenue Share (%), by Country 2024 & 2032
- Figure 8: South America Safety Pool Covers Revenue (million), by Application 2024 & 2032
- Figure 9: South America Safety Pool Covers Revenue Share (%), by Application 2024 & 2032
- Figure 10: South America Safety Pool Covers Revenue (million), by Types 2024 & 2032
- Figure 11: South America Safety Pool Covers Revenue Share (%), by Types 2024 & 2032
- Figure 12: South America Safety Pool Covers Revenue (million), by Country 2024 & 2032
- Figure 13: South America Safety Pool Covers Revenue Share (%), by Country 2024 & 2032
- Figure 14: Europe Safety Pool Covers Revenue (million), by Application 2024 & 2032
- Figure 15: Europe Safety Pool Covers Revenue Share (%), by Application 2024 & 2032
- Figure 16: Europe Safety Pool Covers Revenue (million), by Types 2024 & 2032
- Figure 17: Europe Safety Pool Covers Revenue Share (%), by Types 2024 & 2032
- Figure 18: Europe Safety Pool Covers Revenue (million), by Country 2024 & 2032
- Figure 19: Europe Safety Pool Covers Revenue Share (%), by Country 2024 & 2032
- Figure 20: Middle East & Africa Safety Pool Covers Revenue (million), by Application 2024 & 2032
- Figure 21: Middle East & Africa Safety Pool Covers Revenue Share (%), by Application 2024 & 2032
- Figure 22: Middle East & Africa Safety Pool Covers Revenue (million), by Types 2024 & 2032
- Figure 23: Middle East & Africa Safety Pool Covers Revenue Share (%), by Types 2024 & 2032
- Figure 24: Middle East & Africa Safety Pool Covers Revenue (million), by Country 2024 & 2032
- Figure 25: Middle East & Africa Safety Pool Covers Revenue Share (%), by Country 2024 & 2032
- Figure 26: Asia Pacific Safety Pool Covers Revenue (million), by Application 2024 & 2032
- Figure 27: Asia Pacific Safety Pool Covers Revenue Share (%), by Application 2024 & 2032
- Figure 28: Asia Pacific Safety Pool Covers Revenue (million), by Types 2024 & 2032
- Figure 29: Asia Pacific Safety Pool Covers Revenue Share (%), by Types 2024 & 2032
- Figure 30: Asia Pacific Safety Pool Covers Revenue (million), by Country 2024 & 2032
- Figure 31: Asia Pacific Safety Pool Covers Revenue Share (%), by Country 2024 & 2032
List of Tables
- Table 1: Global Safety Pool Covers Revenue million Forecast, by Region 2019 & 2032
- Table 2: Global Safety Pool Covers Revenue million Forecast, by Application 2019 & 2032
- Table 3: Global Safety Pool Covers Revenue million Forecast, by Types 2019 & 2032
- Table 4: Global Safety Pool Covers Revenue million Forecast, by Region 2019 & 2032
- Table 5: Global Safety Pool Covers Revenue million Forecast, by Application 2019 & 2032
- Table 6: Global Safety Pool Covers Revenue million Forecast, by Types 2019 & 2032
- Table 7: Global Safety Pool Covers Revenue million Forecast, by Country 2019 & 2032
- Table 8: United States Safety Pool Covers Revenue (million) Forecast, by Application 2019 & 2032
- Table 9: Canada Safety Pool Covers Revenue (million) Forecast, by Application 2019 & 2032
- Table 10: Mexico Safety Pool Covers Revenue (million) Forecast, by Application 2019 & 2032
- Table 11: Global Safety Pool Covers Revenue million Forecast, by Application 2019 & 2032
- Table 12: Global Safety Pool Covers Revenue million Forecast, by Types 2019 & 2032
- Table 13: Global Safety Pool Covers Revenue million Forecast, by Country 2019 & 2032
- Table 14: Brazil Safety Pool Covers Revenue (million) Forecast, by Application 2019 & 2032
- Table 15: Argentina Safety Pool Covers Revenue (million) Forecast, by Application 2019 & 2032
- Table 16: Rest of South America Safety Pool Covers Revenue (million) Forecast, by Application 2019 & 2032
- Table 17: Global Safety Pool Covers Revenue million Forecast, by Application 2019 & 2032
- Table 18: Global Safety Pool Covers Revenue million Forecast, by Types 2019 & 2032
- Table 19: Global Safety Pool Covers Revenue million Forecast, by Country 2019 & 2032
- Table 20: United Kingdom Safety Pool Covers Revenue (million) Forecast, by Application 2019 & 2032
- Table 21: Germany Safety Pool Covers Revenue (million) Forecast, by Application 2019 & 2032
- Table 22: France Safety Pool Covers Revenue (million) Forecast, by Application 2019 & 2032
- Table 23: Italy Safety Pool Covers Revenue (million) Forecast, by Application 2019 & 2032
- Table 24: Spain Safety Pool Covers Revenue (million) Forecast, by Application 2019 & 2032
- Table 25: Russia Safety Pool Covers Revenue (million) Forecast, by Application 2019 & 2032
- Table 26: Benelux Safety Pool Covers Revenue (million) Forecast, by Application 2019 & 2032
- Table 27: Nordics Safety Pool Covers Revenue (million) Forecast, by Application 2019 & 2032
- Table 28: Rest of Europe Safety Pool Covers Revenue (million) Forecast, by Application 2019 & 2032
- Table 29: Global Safety Pool Covers Revenue million Forecast, by Application 2019 & 2032
- Table 30: Global Safety Pool Covers Revenue million Forecast, by Types 2019 & 2032
- Table 31: Global Safety Pool Covers Revenue million Forecast, by Country 2019 & 2032
- Table 32: Turkey Safety Pool Covers Revenue (million) Forecast, by Application 2019 & 2032
- Table 33: Israel Safety Pool Covers Revenue (million) Forecast, by Application 2019 & 2032
- Table 34: GCC Safety Pool Covers Revenue (million) Forecast, by Application 2019 & 2032
- Table 35: North Africa Safety Pool Covers Revenue (million) Forecast, by Application 2019 & 2032
- Table 36: South Africa Safety Pool Covers Revenue (million) Forecast, by Application 2019 & 2032
- Table 37: Rest of Middle East & Africa Safety Pool Covers Revenue (million) Forecast, by Application 2019 & 2032
- Table 38: Global Safety Pool Covers Revenue million Forecast, by Application 2019 & 2032
- Table 39: Global Safety Pool Covers Revenue million Forecast, by Types 2019 & 2032
- Table 40: Global Safety Pool Covers Revenue million Forecast, by Country 2019 & 2032
- Table 41: China Safety Pool Covers Revenue (million) Forecast, by Application 2019 & 2032
- Table 42: India Safety Pool Covers Revenue (million) Forecast, by Application 2019 & 2032
- Table 43: Japan Safety Pool Covers Revenue (million) Forecast, by Application 2019 & 2032
- Table 44: South Korea Safety Pool Covers Revenue (million) Forecast, by Application 2019 & 2032
- Table 45: ASEAN Safety Pool Covers Revenue (million) Forecast, by Application 2019 & 2032
- Table 46: Oceania Safety Pool Covers Revenue (million) Forecast, by Application 2019 & 2032
- Table 47: Rest of Asia Pacific Safety Pool Covers Revenue (million) Forecast, by Application 2019 & 2032
Frequently Asked Questions
1. What is the projected Compound Annual Growth Rate (CAGR) of the Safety Pool Covers?
The projected CAGR is approximately XX%.
2. Which companies are prominent players in the Safety Pool Covers?
Key companies in the market include LOOP-LOC, Meyco Pool Covers, GLI Pool Products, Coverstar, Merlin Industries, Doheny's, Garrett Liners, HPI Pool Industries, All-Safe Pool Fence & Covers, Performance Pool Products, Blue Wave Products.
3. What are the main segments of the Safety Pool Covers?
The market segments include Application, Types.
4. Can you provide details about the market size?
The market size is estimated to be USD XXX million as of 2022.
5. What are some drivers contributing to market growth?
N/A
6. What are the notable trends driving market growth?
N/A
7. Are there any restraints impacting market growth?
N/A
8. Can you provide examples of recent developments in the market?
N/A
9. What pricing options are available for accessing the report?
Pricing options include single-user, multi-user, and enterprise licenses priced at USD 4900.00, USD 7350.00, and USD 9800.00 respectively.
10. Is the market size provided in terms of value or volume?
The market size is provided in terms of value, measured in million.
11. Are there any specific market keywords associated with the report?
Yes, the market keyword associated with the report is "Safety Pool Covers," which aids in identifying and referencing the specific market segment covered.
12. How do I determine which pricing option suits my needs best?
The pricing options vary based on user requirements and access needs. Individual users may opt for single-user licenses, while businesses requiring broader access may choose multi-user or enterprise licenses for cost-effective access to the report.
13. Are there any additional resources or data provided in the Safety Pool Covers report?
While the report offers comprehensive insights, it's advisable to review the specific contents or supplementary materials provided to ascertain if additional resources or data are available.
14. How can I stay updated on further developments or reports in the Safety Pool Covers?
To stay informed about further developments, trends, and reports in the Safety Pool Covers, consider subscribing to industry newsletters, following relevant companies and organizations, or regularly checking reputable industry news sources and publications.
Methodology
Step 1 - Identification of Relevant Samples Size from Population Database


Step 2 - Approaches for Defining Global Market Size (Value, Volume* & Price*)

Note*: In applicable scenarios
Step 3 - Data Sources
Primary Research
- Web Analytics
- Survey Reports
- Research Institute
- Latest Research Reports
- Opinion Leaders
Secondary Research
- Annual Reports
- White Paper
- Latest Press Release
- Industry Association
- Paid Database
- Investor Presentations

Step 4 - Data Triangulation
Involves using different sources of information in order to increase the validity of a study
These sources are likely to be stakeholders in a program - participants, other researchers, program staff, other community members, and so on.
Then we put all data in single framework & apply various statistical tools to find out the dynamic on the market.
During the analysis stage, feedback from the stakeholder groups would be compared to determine areas of agreement as well as areas of divergence
