

Key Insights
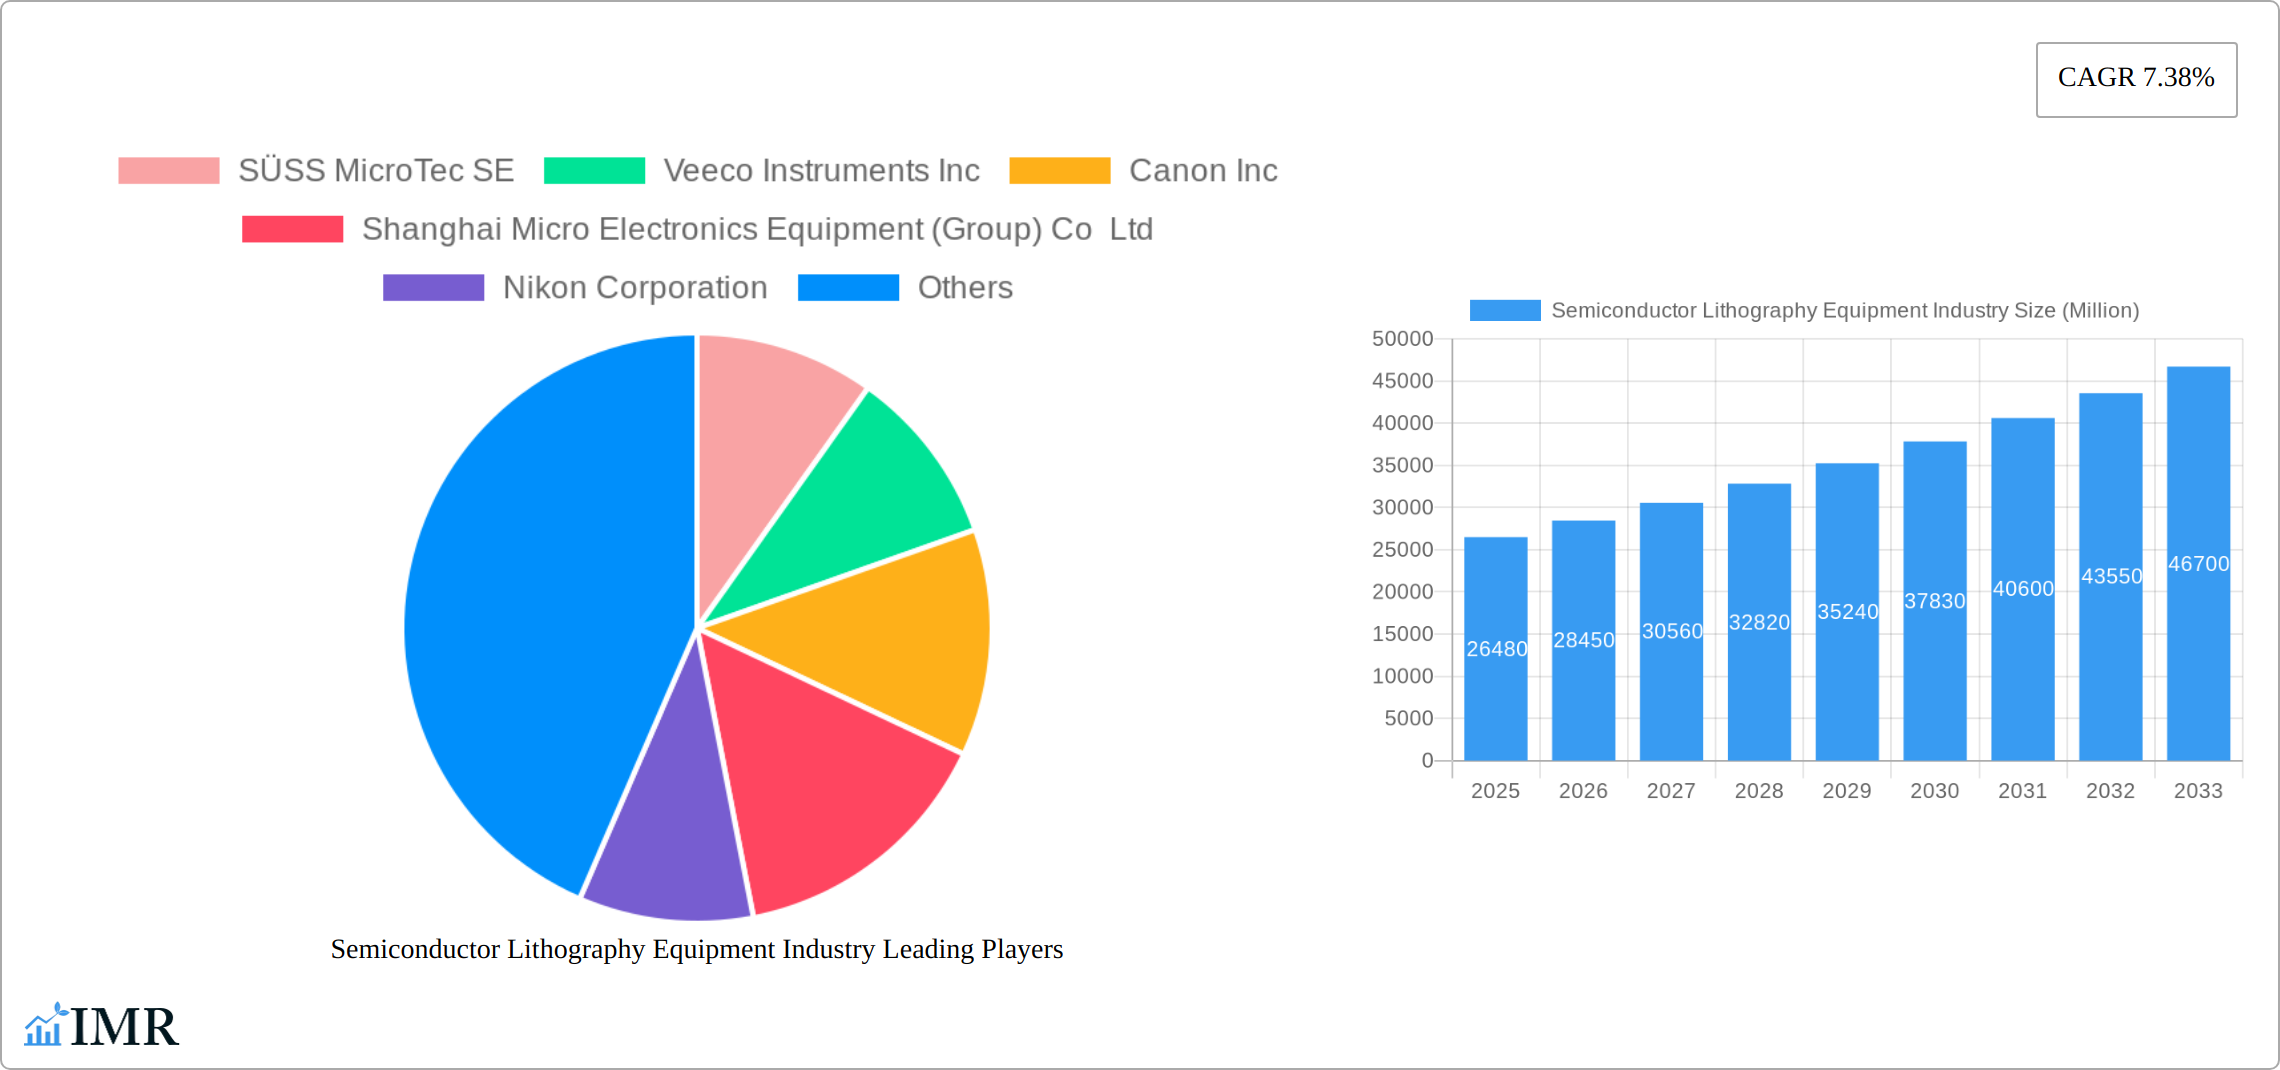
The Semiconductor Lithography Equipment market, valued at $26.48 billion in 2025, is projected to experience robust growth, driven by increasing demand for advanced semiconductor devices across various applications. The Compound Annual Growth Rate (CAGR) of 7.38% from 2025 to 2033 indicates a significant expansion in market size, reaching an estimated $45 billion by 2033. Key drivers include the rising adoption of advanced packaging techniques like 3D stacking and system-in-package (SiP) solutions, fueled by the miniaturization trend in electronics. The increasing demand for high-performance computing (HPC), artificial intelligence (AI), and 5G infrastructure further accelerates market growth. Technological advancements in Extreme Ultraviolet Lithography (EUV) are playing a crucial role, enabling the production of smaller, faster, and more energy-efficient chips. While the market faces challenges such as high equipment costs and the complexity of EUV technology, these are mitigated by continuous innovation and the strategic investments of key players. Market segmentation reveals a strong emphasis on EUV lithography systems, driven by their capability to create smaller feature sizes required for cutting-edge chips. The advanced packaging segment shows significant potential, mirroring the industry's shift towards heterogeneous integration for improved performance and cost efficiency. Geographically, North America and Asia Pacific are expected to dominate the market, reflecting the concentration of major semiconductor manufacturers and research facilities in these regions.
The competitive landscape is marked by the presence of both established players like ASML Holding NV, Nikon Corporation, and Canon Inc., and emerging companies striving for market share. These companies are constantly engaged in research and development, focusing on enhancing lithography techniques, improving equipment efficiency, and expanding their product portfolios. The strategic partnerships and collaborations within the industry are further shaping the market dynamics, fostering innovation and enabling faster adoption of advanced technologies. Successful navigation of this market requires a deep understanding of technological advancements, evolving market trends, and the complex interplay between various applications and geographical regions. Future growth will likely be shaped by the rate of adoption of EUV technology, the maturation of advanced packaging techniques, and the increasing demand for high-performance computing capabilities.
Semiconductor Lithography Equipment Industry Market Report: 2019-2033
This comprehensive report provides an in-depth analysis of the Semiconductor Lithography Equipment industry, encompassing market dynamics, growth trends, regional segmentation, product landscape, key players, and future outlook. The report covers the period from 2019 to 2033, with a focus on the forecast period of 2025-2033 and a base year of 2025. The study includes detailed analysis of parent markets (Semiconductor Equipment) and child markets (Advanced Packaging, MEMS, LED production equipment). Market values are presented in million units.
Semiconductor Lithography Equipment Industry Market Dynamics & Structure
The semiconductor lithography equipment market is characterized by high capital intensity, technological complexity, and intense competition among a few key players. Market concentration is relatively high, with ASML Holding NV holding a significant market share. Technological innovation, driven by the relentless pursuit of miniaturization in semiconductor manufacturing, is a primary growth driver. Stringent regulatory frameworks related to environmental compliance and safety standards also influence market dynamics. While direct substitutes are limited, advancements in alternative patterning techniques represent indirect competitive pressure. The end-user demographics consist primarily of major integrated device manufacturers (IDMs) and fabless semiconductor companies. M&A activity has been relatively modest in recent years, with a total deal volume estimated at xx million USD during the historical period (2019-2024).
- High Market Concentration: ASML and Nikon control a substantial portion (xx%) of the global market share.
- Technological Innovation: EUV lithography continues to drive significant investment and market growth.
- Regulatory Landscape: Compliance with environmental and safety regulations adds complexity and cost.
- Competitive Pressures: Alternative patterning techniques and material innovations pose indirect competition.
- M&A Activity: Consolidation within the industry remains moderate with xx major deals concluded in 2019-2024.
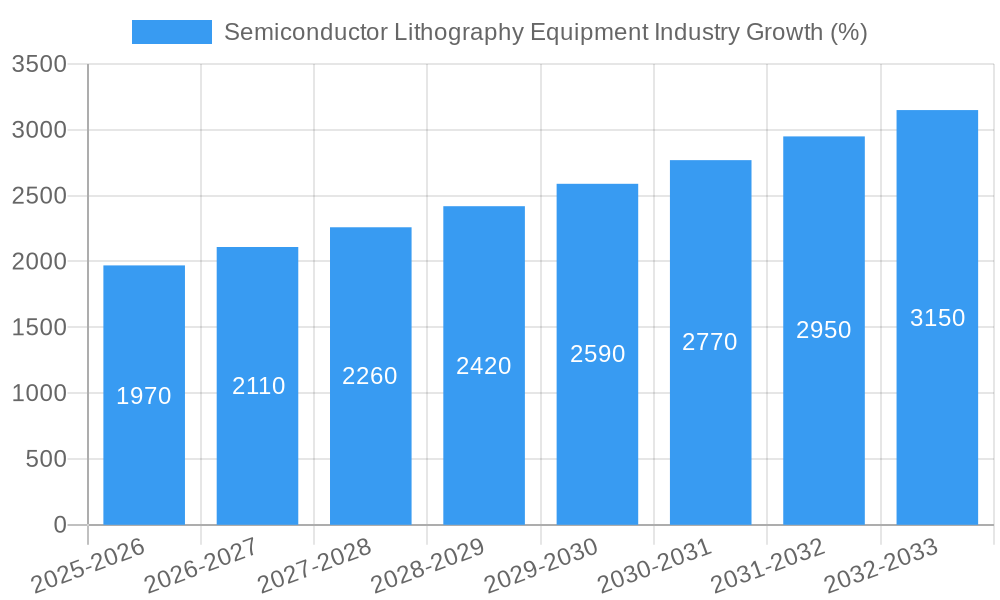
Semiconductor Lithography Equipment Industry Growth Trends & Insights
The semiconductor lithography equipment market experienced substantial growth during the historical period (2019-2024), driven primarily by increasing demand for advanced semiconductor devices. The market size is estimated at xx million units in 2025 and is projected to reach xx million units by 2033, exhibiting a Compound Annual Growth Rate (CAGR) of xx% during the forecast period. This growth reflects the ongoing trend of miniaturization in electronics, increasing adoption of advanced nodes, and the burgeoning demand for applications like AI, 5G, and high-performance computing. Technological disruptions, such as the transition from DUV to EUV lithography, have significantly impacted market dynamics and growth trajectories. Consumer behavior shifts toward more sophisticated and powerful electronic devices are fueling this demand, driving higher adoption rates and market penetration.
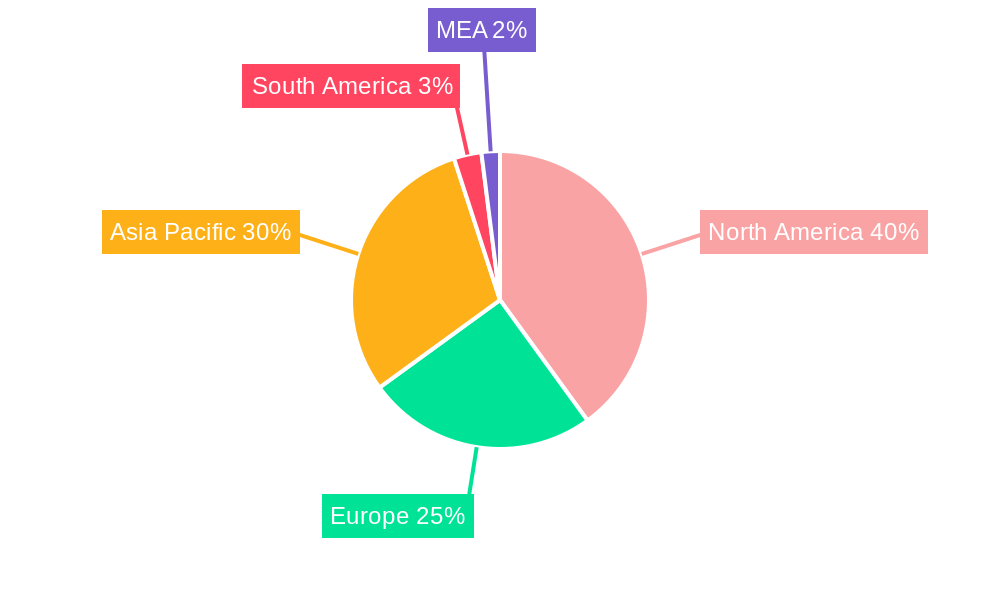
Dominant Regions, Countries, or Segments in Semiconductor Lithography Equipment Industry
The Asia-Pacific region, particularly Taiwan, South Korea, and China, dominates the semiconductor lithography equipment market. This dominance is primarily due to the high concentration of semiconductor manufacturing facilities in these regions and substantial investments in advanced technology nodes. Within the product segments, EUV lithography is the fastest-growing segment, driven by its ability to enable the production of the most advanced semiconductor chips. Advanced Packaging is also a key driver, benefiting from increasing demand for heterogeneous integration and 3D stacking.
- Asia-Pacific Dominance: High concentration of semiconductor fabs and investments in advanced technology.
- EUV Lithography Growth: Enabling the production of advanced node chips.
- Advanced Packaging Demand: Driving adoption of back-end lithography equipment.
- North America and Europe: Significant market presence, particularly in research & development.
Semiconductor Lithography Equipment Industry Product Landscape
The semiconductor lithography equipment market offers a diverse range of products, including deep ultraviolet (DUV) and extreme ultraviolet (EUV) lithography systems, along with associated components and services. Recent innovations focus on enhancing resolution, throughput, and process control. Key features include improved overlay accuracy, advanced metrology capabilities, and reduced defect rates. The industry continually strives to improve cost-effectiveness and reduce environmental impact. Unique selling propositions often revolve around superior resolution, higher throughput, and advanced automation features.
Key Drivers, Barriers & Challenges in Semiconductor Lithography Equipment Industry
Key Drivers: The primary drivers include the growing demand for advanced semiconductor devices in various applications, technological advancements in lithography techniques, increasing government support for semiconductor industries, and strategic investments from leading technology companies. The transition to smaller nodes necessitates continued innovation in lithography.
Key Challenges & Barriers: The high cost of EUV lithography equipment poses a significant barrier to entry for smaller companies. Geopolitical factors, supply chain disruptions, and intense competition constrain market growth. The impact of supply chain issues is estimated at xx% reduction in production capacity during 2022.
Emerging Opportunities in Semiconductor Lithography Equipment Industry
Emerging opportunities lie in the development of next-generation lithography technologies, such as directed self-assembly (DSA) and nanoimprint lithography. Expansion into emerging markets like the automotive and IoT sectors offers significant potential. Growth in specialized applications such as MEMS devices and advanced packaging further expands market opportunities.
Growth Accelerators in the Semiconductor Lithography Equipment Industry
Technological breakthroughs, particularly in EUV lithography, are key growth accelerators. Strategic partnerships between equipment manufacturers and semiconductor companies are streamlining innovation and adoption. Market expansion into emerging applications and geographic regions will propel further growth.
Key Players Shaping the Semiconductor Lithography Equipment Industry Market
- SÜSS MicroTec SE
- Veeco Instruments Inc
- Canon Inc
- Shanghai Micro Electronics Equipment (Group) Co Ltd
- Nikon Corporation
- JEOL Ltd
- Neutronix Quintel Inc (NXQ)
- Onto Innovation (Rudolph Technologies Inc)
- ASML Holding NV
- EV Group (EVG)
Notable Milestones in Semiconductor Lithography Equipment Industry Sector
- December 2022: Canon Inc. launched the FPA-5520iV LF2 i-line lithography stepper for 3D advanced packaging, enhancing back-end processing capabilities.
- November 2022: EV Group launched the next-generation 200-mm version of its EVG 150 automated resist processing system, strengthening its optical lithography portfolio.
In-Depth Semiconductor Lithography Equipment Industry Market Outlook
The semiconductor lithography equipment market is poised for continued growth, driven by the relentless demand for advanced semiconductor devices and ongoing technological advancements. Strategic partnerships, expansion into new applications, and the development of next-generation lithography technologies will shape future market dynamics. The market's long-term potential remains strong, presenting substantial opportunities for key players and new entrants.
Semiconductor Lithography Equipment Industry Segmentation
-
1. Type
- 1.1. Deep Ultraviolet Lithography (DUV)
- 1.2. Extreme Ultraviolet Lithography (EUV)
-
2. Application
- 2.1. Advanced Packaging
- 2.2. MEMS Devices
- 2.3. LED Devices
Semiconductor Lithography Equipment Industry Segmentation By Geography
- 1. North America
- 2. Europe
- 3. Asia
- 4. Australia and New Zealand
- 5. Latin America
- 6. Middle East and Africa
Semiconductor Lithography Equipment Industry REPORT HIGHLIGHTS
| Aspects | Details |
|---|---|
| Study Period | 2019-2033 |
| Base Year | 2024 |
| Estimated Year | 2025 |
| Forecast Period | 2025-2033 |
| Historical Period | 2019-2024 |
| Growth Rate | CAGR of 7.38% from 2019-2033 |
| Segmentation |
|
Table of Contents
- 1. Introduction
- 1.1. Research Scope
- 1.2. Market Segmentation
- 1.3. Research Methodology
- 1.4. Definitions and Assumptions
- 2. Executive Summary
- 2.1. Introduction
- 3. Market Dynamics
- 3.1. Introduction
- 3.2. Market Drivers
- 3.2.1. Increasing Demand for Miniaturization and Extra Functionality by Electric Vehicles and Advanced Mobile Devices; Growing Innovation by Specialist Equipment Vendors offering Brand New Lithography Tools
- 3.3. Market Restrains
- 3.3.1. Challenges Regarding Complexity of Pattern in Manufacturing Process
- 3.4. Market Trends
- 3.4.1. Deep Ultraviolet Lithography (DUV) to Hold Major Market Share
- 4. Market Factor Analysis
- 4.1. Porters Five Forces
- 4.2. Supply/Value Chain
- 4.3. PESTEL analysis
- 4.4. Market Entropy
- 4.5. Patent/Trademark Analysis
- 5. Global Semiconductor Lithography Equipment Industry Analysis, Insights and Forecast, 2019-2031
- 5.1. Market Analysis, Insights and Forecast - by Type
- 5.1.1. Deep Ultraviolet Lithography (DUV)
- 5.1.2. Extreme Ultraviolet Lithography (EUV)
- 5.2. Market Analysis, Insights and Forecast - by Application
- 5.2.1. Advanced Packaging
- 5.2.2. MEMS Devices
- 5.2.3. LED Devices
- 5.3. Market Analysis, Insights and Forecast - by Region
- 5.3.1. North America
- 5.3.2. Europe
- 5.3.3. Asia
- 5.3.4. Australia and New Zealand
- 5.3.5. Latin America
- 5.3.6. Middle East and Africa
- 5.1. Market Analysis, Insights and Forecast - by Type
- 6. North America Semiconductor Lithography Equipment Industry Analysis, Insights and Forecast, 2019-2031
- 6.1. Market Analysis, Insights and Forecast - by Type
- 6.1.1. Deep Ultraviolet Lithography (DUV)
- 6.1.2. Extreme Ultraviolet Lithography (EUV)
- 6.2. Market Analysis, Insights and Forecast - by Application
- 6.2.1. Advanced Packaging
- 6.2.2. MEMS Devices
- 6.2.3. LED Devices
- 6.1. Market Analysis, Insights and Forecast - by Type
- 7. Europe Semiconductor Lithography Equipment Industry Analysis, Insights and Forecast, 2019-2031
- 7.1. Market Analysis, Insights and Forecast - by Type
- 7.1.1. Deep Ultraviolet Lithography (DUV)
- 7.1.2. Extreme Ultraviolet Lithography (EUV)
- 7.2. Market Analysis, Insights and Forecast - by Application
- 7.2.1. Advanced Packaging
- 7.2.2. MEMS Devices
- 7.2.3. LED Devices
- 7.1. Market Analysis, Insights and Forecast - by Type
- 8. Asia Semiconductor Lithography Equipment Industry Analysis, Insights and Forecast, 2019-2031
- 8.1. Market Analysis, Insights and Forecast - by Type
- 8.1.1. Deep Ultraviolet Lithography (DUV)
- 8.1.2. Extreme Ultraviolet Lithography (EUV)
- 8.2. Market Analysis, Insights and Forecast - by Application
- 8.2.1. Advanced Packaging
- 8.2.2. MEMS Devices
- 8.2.3. LED Devices
- 8.1. Market Analysis, Insights and Forecast - by Type
- 9. Australia and New Zealand Semiconductor Lithography Equipment Industry Analysis, Insights and Forecast, 2019-2031
- 9.1. Market Analysis, Insights and Forecast - by Type
- 9.1.1. Deep Ultraviolet Lithography (DUV)
- 9.1.2. Extreme Ultraviolet Lithography (EUV)
- 9.2. Market Analysis, Insights and Forecast - by Application
- 9.2.1. Advanced Packaging
- 9.2.2. MEMS Devices
- 9.2.3. LED Devices
- 9.1. Market Analysis, Insights and Forecast - by Type
- 10. Latin America Semiconductor Lithography Equipment Industry Analysis, Insights and Forecast, 2019-2031
- 10.1. Market Analysis, Insights and Forecast - by Type
- 10.1.1. Deep Ultraviolet Lithography (DUV)
- 10.1.2. Extreme Ultraviolet Lithography (EUV)
- 10.2. Market Analysis, Insights and Forecast - by Application
- 10.2.1. Advanced Packaging
- 10.2.2. MEMS Devices
- 10.2.3. LED Devices
- 10.1. Market Analysis, Insights and Forecast - by Type
- 11. Middle East and Africa Semiconductor Lithography Equipment Industry Analysis, Insights and Forecast, 2019-2031
- 11.1. Market Analysis, Insights and Forecast - by Type
- 11.1.1. Deep Ultraviolet Lithography (DUV)
- 11.1.2. Extreme Ultraviolet Lithography (EUV)
- 11.2. Market Analysis, Insights and Forecast - by Application
- 11.2.1. Advanced Packaging
- 11.2.2. MEMS Devices
- 11.2.3. LED Devices
- 11.1. Market Analysis, Insights and Forecast - by Type
- 12. North America Semiconductor Lithography Equipment Industry Analysis, Insights and Forecast, 2019-2031
- 12.1. Market Analysis, Insights and Forecast - By Country/Sub-region
- 12.1.1 United States
- 12.1.2 Canada
- 12.1.3 Mexico
- 13. Europe Semiconductor Lithography Equipment Industry Analysis, Insights and Forecast, 2019-2031
- 13.1. Market Analysis, Insights and Forecast - By Country/Sub-region
- 13.1.1 Germany
- 13.1.2 United Kingdom
- 13.1.3 France
- 13.1.4 Spain
- 13.1.5 Italy
- 13.1.6 Spain
- 13.1.7 Belgium
- 13.1.8 Netherland
- 13.1.9 Nordics
- 13.1.10 Rest of Europe
- 14. Asia Pacific Semiconductor Lithography Equipment Industry Analysis, Insights and Forecast, 2019-2031
- 14.1. Market Analysis, Insights and Forecast - By Country/Sub-region
- 14.1.1 China
- 14.1.2 Japan
- 14.1.3 India
- 14.1.4 South Korea
- 14.1.5 Southeast Asia
- 14.1.6 Australia
- 14.1.7 Indonesia
- 14.1.8 Phillipes
- 14.1.9 Singapore
- 14.1.10 Thailandc
- 14.1.11 Rest of Asia Pacific
- 15. South America Semiconductor Lithography Equipment Industry Analysis, Insights and Forecast, 2019-2031
- 15.1. Market Analysis, Insights and Forecast - By Country/Sub-region
- 15.1.1 Brazil
- 15.1.2 Argentina
- 15.1.3 Peru
- 15.1.4 Chile
- 15.1.5 Colombia
- 15.1.6 Ecuador
- 15.1.7 Venezuela
- 15.1.8 Rest of South America
- 16. North America Semiconductor Lithography Equipment Industry Analysis, Insights and Forecast, 2019-2031
- 16.1. Market Analysis, Insights and Forecast - By Country/Sub-region
- 16.1.1 United States
- 16.1.2 Canada
- 16.1.3 Mexico
- 17. MEA Semiconductor Lithography Equipment Industry Analysis, Insights and Forecast, 2019-2031
- 17.1. Market Analysis, Insights and Forecast - By Country/Sub-region
- 17.1.1 United Arab Emirates
- 17.1.2 Saudi Arabia
- 17.1.3 South Africa
- 17.1.4 Rest of Middle East and Africa
- 18. Competitive Analysis
- 18.1. Global Market Share Analysis 2024
- 18.2. Company Profiles
- 18.2.1 SÜSS MicroTec SE
- 18.2.1.1. Overview
- 18.2.1.2. Products
- 18.2.1.3. SWOT Analysis
- 18.2.1.4. Recent Developments
- 18.2.1.5. Financials (Based on Availability)
- 18.2.2 Veeco Instruments Inc
- 18.2.2.1. Overview
- 18.2.2.2. Products
- 18.2.2.3. SWOT Analysis
- 18.2.2.4. Recent Developments
- 18.2.2.5. Financials (Based on Availability)
- 18.2.3 Canon Inc
- 18.2.3.1. Overview
- 18.2.3.2. Products
- 18.2.3.3. SWOT Analysis
- 18.2.3.4. Recent Developments
- 18.2.3.5. Financials (Based on Availability)
- 18.2.4 Shanghai Micro Electronics Equipment (Group) Co Ltd
- 18.2.4.1. Overview
- 18.2.4.2. Products
- 18.2.4.3. SWOT Analysis
- 18.2.4.4. Recent Developments
- 18.2.4.5. Financials (Based on Availability)
- 18.2.5 Nikon Corporation
- 18.2.5.1. Overview
- 18.2.5.2. Products
- 18.2.5.3. SWOT Analysis
- 18.2.5.4. Recent Developments
- 18.2.5.5. Financials (Based on Availability)
- 18.2.6 JEOL Ltd
- 18.2.6.1. Overview
- 18.2.6.2. Products
- 18.2.6.3. SWOT Analysis
- 18.2.6.4. Recent Developments
- 18.2.6.5. Financials (Based on Availability)
- 18.2.7 Neutronix Quintel Inc (NXQ)7 2 Vendor Market Share Analysi
- 18.2.7.1. Overview
- 18.2.7.2. Products
- 18.2.7.3. SWOT Analysis
- 18.2.7.4. Recent Developments
- 18.2.7.5. Financials (Based on Availability)
- 18.2.8 Onto Innovation (Rudolph Technologies Inc )
- 18.2.8.1. Overview
- 18.2.8.2. Products
- 18.2.8.3. SWOT Analysis
- 18.2.8.4. Recent Developments
- 18.2.8.5. Financials (Based on Availability)
- 18.2.9 ASML Holding NV
- 18.2.9.1. Overview
- 18.2.9.2. Products
- 18.2.9.3. SWOT Analysis
- 18.2.9.4. Recent Developments
- 18.2.9.5. Financials (Based on Availability)
- 18.2.10 EV Group (EVG)
- 18.2.10.1. Overview
- 18.2.10.2. Products
- 18.2.10.3. SWOT Analysis
- 18.2.10.4. Recent Developments
- 18.2.10.5. Financials (Based on Availability)
- 18.2.1 SÜSS MicroTec SE
List of Figures
- Figure 1: Global Semiconductor Lithography Equipment Industry Revenue Breakdown (Million, %) by Region 2024 & 2032
- Figure 2: Global Semiconductor Lithography Equipment Industry Volume Breakdown (K Unit, %) by Region 2024 & 2032
- Figure 3: North America Semiconductor Lithography Equipment Industry Revenue (Million), by Country 2024 & 2032
- Figure 4: North America Semiconductor Lithography Equipment Industry Volume (K Unit), by Country 2024 & 2032
- Figure 5: North America Semiconductor Lithography Equipment Industry Revenue Share (%), by Country 2024 & 2032
- Figure 6: North America Semiconductor Lithography Equipment Industry Volume Share (%), by Country 2024 & 2032
- Figure 7: Europe Semiconductor Lithography Equipment Industry Revenue (Million), by Country 2024 & 2032
- Figure 8: Europe Semiconductor Lithography Equipment Industry Volume (K Unit), by Country 2024 & 2032
- Figure 9: Europe Semiconductor Lithography Equipment Industry Revenue Share (%), by Country 2024 & 2032
- Figure 10: Europe Semiconductor Lithography Equipment Industry Volume Share (%), by Country 2024 & 2032
- Figure 11: Asia Pacific Semiconductor Lithography Equipment Industry Revenue (Million), by Country 2024 & 2032
- Figure 12: Asia Pacific Semiconductor Lithography Equipment Industry Volume (K Unit), by Country 2024 & 2032
- Figure 13: Asia Pacific Semiconductor Lithography Equipment Industry Revenue Share (%), by Country 2024 & 2032
- Figure 14: Asia Pacific Semiconductor Lithography Equipment Industry Volume Share (%), by Country 2024 & 2032
- Figure 15: South America Semiconductor Lithography Equipment Industry Revenue (Million), by Country 2024 & 2032
- Figure 16: South America Semiconductor Lithography Equipment Industry Volume (K Unit), by Country 2024 & 2032
- Figure 17: South America Semiconductor Lithography Equipment Industry Revenue Share (%), by Country 2024 & 2032
- Figure 18: South America Semiconductor Lithography Equipment Industry Volume Share (%), by Country 2024 & 2032
- Figure 19: North America Semiconductor Lithography Equipment Industry Revenue (Million), by Country 2024 & 2032
- Figure 20: North America Semiconductor Lithography Equipment Industry Volume (K Unit), by Country 2024 & 2032
- Figure 21: North America Semiconductor Lithography Equipment Industry Revenue Share (%), by Country 2024 & 2032
- Figure 22: North America Semiconductor Lithography Equipment Industry Volume Share (%), by Country 2024 & 2032
- Figure 23: MEA Semiconductor Lithography Equipment Industry Revenue (Million), by Country 2024 & 2032
- Figure 24: MEA Semiconductor Lithography Equipment Industry Volume (K Unit), by Country 2024 & 2032
- Figure 25: MEA Semiconductor Lithography Equipment Industry Revenue Share (%), by Country 2024 & 2032
- Figure 26: MEA Semiconductor Lithography Equipment Industry Volume Share (%), by Country 2024 & 2032
- Figure 27: North America Semiconductor Lithography Equipment Industry Revenue (Million), by Type 2024 & 2032
- Figure 28: North America Semiconductor Lithography Equipment Industry Volume (K Unit), by Type 2024 & 2032
- Figure 29: North America Semiconductor Lithography Equipment Industry Revenue Share (%), by Type 2024 & 2032
- Figure 30: North America Semiconductor Lithography Equipment Industry Volume Share (%), by Type 2024 & 2032
- Figure 31: North America Semiconductor Lithography Equipment Industry Revenue (Million), by Application 2024 & 2032
- Figure 32: North America Semiconductor Lithography Equipment Industry Volume (K Unit), by Application 2024 & 2032
- Figure 33: North America Semiconductor Lithography Equipment Industry Revenue Share (%), by Application 2024 & 2032
- Figure 34: North America Semiconductor Lithography Equipment Industry Volume Share (%), by Application 2024 & 2032
- Figure 35: North America Semiconductor Lithography Equipment Industry Revenue (Million), by Country 2024 & 2032
- Figure 36: North America Semiconductor Lithography Equipment Industry Volume (K Unit), by Country 2024 & 2032
- Figure 37: North America Semiconductor Lithography Equipment Industry Revenue Share (%), by Country 2024 & 2032
- Figure 38: North America Semiconductor Lithography Equipment Industry Volume Share (%), by Country 2024 & 2032
- Figure 39: Europe Semiconductor Lithography Equipment Industry Revenue (Million), by Type 2024 & 2032
- Figure 40: Europe Semiconductor Lithography Equipment Industry Volume (K Unit), by Type 2024 & 2032
- Figure 41: Europe Semiconductor Lithography Equipment Industry Revenue Share (%), by Type 2024 & 2032
- Figure 42: Europe Semiconductor Lithography Equipment Industry Volume Share (%), by Type 2024 & 2032
- Figure 43: Europe Semiconductor Lithography Equipment Industry Revenue (Million), by Application 2024 & 2032
- Figure 44: Europe Semiconductor Lithography Equipment Industry Volume (K Unit), by Application 2024 & 2032
- Figure 45: Europe Semiconductor Lithography Equipment Industry Revenue Share (%), by Application 2024 & 2032
- Figure 46: Europe Semiconductor Lithography Equipment Industry Volume Share (%), by Application 2024 & 2032
- Figure 47: Europe Semiconductor Lithography Equipment Industry Revenue (Million), by Country 2024 & 2032
- Figure 48: Europe Semiconductor Lithography Equipment Industry Volume (K Unit), by Country 2024 & 2032
- Figure 49: Europe Semiconductor Lithography Equipment Industry Revenue Share (%), by Country 2024 & 2032
- Figure 50: Europe Semiconductor Lithography Equipment Industry Volume Share (%), by Country 2024 & 2032
- Figure 51: Asia Semiconductor Lithography Equipment Industry Revenue (Million), by Type 2024 & 2032
- Figure 52: Asia Semiconductor Lithography Equipment Industry Volume (K Unit), by Type 2024 & 2032
- Figure 53: Asia Semiconductor Lithography Equipment Industry Revenue Share (%), by Type 2024 & 2032
- Figure 54: Asia Semiconductor Lithography Equipment Industry Volume Share (%), by Type 2024 & 2032
- Figure 55: Asia Semiconductor Lithography Equipment Industry Revenue (Million), by Application 2024 & 2032
- Figure 56: Asia Semiconductor Lithography Equipment Industry Volume (K Unit), by Application 2024 & 2032
- Figure 57: Asia Semiconductor Lithography Equipment Industry Revenue Share (%), by Application 2024 & 2032
- Figure 58: Asia Semiconductor Lithography Equipment Industry Volume Share (%), by Application 2024 & 2032
- Figure 59: Asia Semiconductor Lithography Equipment Industry Revenue (Million), by Country 2024 & 2032
- Figure 60: Asia Semiconductor Lithography Equipment Industry Volume (K Unit), by Country 2024 & 2032
- Figure 61: Asia Semiconductor Lithography Equipment Industry Revenue Share (%), by Country 2024 & 2032
- Figure 62: Asia Semiconductor Lithography Equipment Industry Volume Share (%), by Country 2024 & 2032
- Figure 63: Australia and New Zealand Semiconductor Lithography Equipment Industry Revenue (Million), by Type 2024 & 2032
- Figure 64: Australia and New Zealand Semiconductor Lithography Equipment Industry Volume (K Unit), by Type 2024 & 2032
- Figure 65: Australia and New Zealand Semiconductor Lithography Equipment Industry Revenue Share (%), by Type 2024 & 2032
- Figure 66: Australia and New Zealand Semiconductor Lithography Equipment Industry Volume Share (%), by Type 2024 & 2032
- Figure 67: Australia and New Zealand Semiconductor Lithography Equipment Industry Revenue (Million), by Application 2024 & 2032
- Figure 68: Australia and New Zealand Semiconductor Lithography Equipment Industry Volume (K Unit), by Application 2024 & 2032
- Figure 69: Australia and New Zealand Semiconductor Lithography Equipment Industry Revenue Share (%), by Application 2024 & 2032
- Figure 70: Australia and New Zealand Semiconductor Lithography Equipment Industry Volume Share (%), by Application 2024 & 2032
- Figure 71: Australia and New Zealand Semiconductor Lithography Equipment Industry Revenue (Million), by Country 2024 & 2032
- Figure 72: Australia and New Zealand Semiconductor Lithography Equipment Industry Volume (K Unit), by Country 2024 & 2032
- Figure 73: Australia and New Zealand Semiconductor Lithography Equipment Industry Revenue Share (%), by Country 2024 & 2032
- Figure 74: Australia and New Zealand Semiconductor Lithography Equipment Industry Volume Share (%), by Country 2024 & 2032
- Figure 75: Latin America Semiconductor Lithography Equipment Industry Revenue (Million), by Type 2024 & 2032
- Figure 76: Latin America Semiconductor Lithography Equipment Industry Volume (K Unit), by Type 2024 & 2032
- Figure 77: Latin America Semiconductor Lithography Equipment Industry Revenue Share (%), by Type 2024 & 2032
- Figure 78: Latin America Semiconductor Lithography Equipment Industry Volume Share (%), by Type 2024 & 2032
- Figure 79: Latin America Semiconductor Lithography Equipment Industry Revenue (Million), by Application 2024 & 2032
- Figure 80: Latin America Semiconductor Lithography Equipment Industry Volume (K Unit), by Application 2024 & 2032
- Figure 81: Latin America Semiconductor Lithography Equipment Industry Revenue Share (%), by Application 2024 & 2032
- Figure 82: Latin America Semiconductor Lithography Equipment Industry Volume Share (%), by Application 2024 & 2032
- Figure 83: Latin America Semiconductor Lithography Equipment Industry Revenue (Million), by Country 2024 & 2032
- Figure 84: Latin America Semiconductor Lithography Equipment Industry Volume (K Unit), by Country 2024 & 2032
- Figure 85: Latin America Semiconductor Lithography Equipment Industry Revenue Share (%), by Country 2024 & 2032
- Figure 86: Latin America Semiconductor Lithography Equipment Industry Volume Share (%), by Country 2024 & 2032
- Figure 87: Middle East and Africa Semiconductor Lithography Equipment Industry Revenue (Million), by Type 2024 & 2032
- Figure 88: Middle East and Africa Semiconductor Lithography Equipment Industry Volume (K Unit), by Type 2024 & 2032
- Figure 89: Middle East and Africa Semiconductor Lithography Equipment Industry Revenue Share (%), by Type 2024 & 2032
- Figure 90: Middle East and Africa Semiconductor Lithography Equipment Industry Volume Share (%), by Type 2024 & 2032
- Figure 91: Middle East and Africa Semiconductor Lithography Equipment Industry Revenue (Million), by Application 2024 & 2032
- Figure 92: Middle East and Africa Semiconductor Lithography Equipment Industry Volume (K Unit), by Application 2024 & 2032
- Figure 93: Middle East and Africa Semiconductor Lithography Equipment Industry Revenue Share (%), by Application 2024 & 2032
- Figure 94: Middle East and Africa Semiconductor Lithography Equipment Industry Volume Share (%), by Application 2024 & 2032
- Figure 95: Middle East and Africa Semiconductor Lithography Equipment Industry Revenue (Million), by Country 2024 & 2032
- Figure 96: Middle East and Africa Semiconductor Lithography Equipment Industry Volume (K Unit), by Country 2024 & 2032
- Figure 97: Middle East and Africa Semiconductor Lithography Equipment Industry Revenue Share (%), by Country 2024 & 2032
- Figure 98: Middle East and Africa Semiconductor Lithography Equipment Industry Volume Share (%), by Country 2024 & 2032
List of Tables
- Table 1: Global Semiconductor Lithography Equipment Industry Revenue Million Forecast, by Region 2019 & 2032
- Table 2: Global Semiconductor Lithography Equipment Industry Volume K Unit Forecast, by Region 2019 & 2032
- Table 3: Global Semiconductor Lithography Equipment Industry Revenue Million Forecast, by Type 2019 & 2032
- Table 4: Global Semiconductor Lithography Equipment Industry Volume K Unit Forecast, by Type 2019 & 2032
- Table 5: Global Semiconductor Lithography Equipment Industry Revenue Million Forecast, by Application 2019 & 2032
- Table 6: Global Semiconductor Lithography Equipment Industry Volume K Unit Forecast, by Application 2019 & 2032
- Table 7: Global Semiconductor Lithography Equipment Industry Revenue Million Forecast, by Region 2019 & 2032
- Table 8: Global Semiconductor Lithography Equipment Industry Volume K Unit Forecast, by Region 2019 & 2032
- Table 9: Global Semiconductor Lithography Equipment Industry Revenue Million Forecast, by Country 2019 & 2032
- Table 10: Global Semiconductor Lithography Equipment Industry Volume K Unit Forecast, by Country 2019 & 2032
- Table 11: United States Semiconductor Lithography Equipment Industry Revenue (Million) Forecast, by Application 2019 & 2032
- Table 12: United States Semiconductor Lithography Equipment Industry Volume (K Unit) Forecast, by Application 2019 & 2032
- Table 13: Canada Semiconductor Lithography Equipment Industry Revenue (Million) Forecast, by Application 2019 & 2032
- Table 14: Canada Semiconductor Lithography Equipment Industry Volume (K Unit) Forecast, by Application 2019 & 2032
- Table 15: Mexico Semiconductor Lithography Equipment Industry Revenue (Million) Forecast, by Application 2019 & 2032
- Table 16: Mexico Semiconductor Lithography Equipment Industry Volume (K Unit) Forecast, by Application 2019 & 2032
- Table 17: Global Semiconductor Lithography Equipment Industry Revenue Million Forecast, by Country 2019 & 2032
- Table 18: Global Semiconductor Lithography Equipment Industry Volume K Unit Forecast, by Country 2019 & 2032
- Table 19: Germany Semiconductor Lithography Equipment Industry Revenue (Million) Forecast, by Application 2019 & 2032
- Table 20: Germany Semiconductor Lithography Equipment Industry Volume (K Unit) Forecast, by Application 2019 & 2032
- Table 21: United Kingdom Semiconductor Lithography Equipment Industry Revenue (Million) Forecast, by Application 2019 & 2032
- Table 22: United Kingdom Semiconductor Lithography Equipment Industry Volume (K Unit) Forecast, by Application 2019 & 2032
- Table 23: France Semiconductor Lithography Equipment Industry Revenue (Million) Forecast, by Application 2019 & 2032
- Table 24: France Semiconductor Lithography Equipment Industry Volume (K Unit) Forecast, by Application 2019 & 2032
- Table 25: Spain Semiconductor Lithography Equipment Industry Revenue (Million) Forecast, by Application 2019 & 2032
- Table 26: Spain Semiconductor Lithography Equipment Industry Volume (K Unit) Forecast, by Application 2019 & 2032
- Table 27: Italy Semiconductor Lithography Equipment Industry Revenue (Million) Forecast, by Application 2019 & 2032
- Table 28: Italy Semiconductor Lithography Equipment Industry Volume (K Unit) Forecast, by Application 2019 & 2032
- Table 29: Spain Semiconductor Lithography Equipment Industry Revenue (Million) Forecast, by Application 2019 & 2032
- Table 30: Spain Semiconductor Lithography Equipment Industry Volume (K Unit) Forecast, by Application 2019 & 2032
- Table 31: Belgium Semiconductor Lithography Equipment Industry Revenue (Million) Forecast, by Application 2019 & 2032
- Table 32: Belgium Semiconductor Lithography Equipment Industry Volume (K Unit) Forecast, by Application 2019 & 2032
- Table 33: Netherland Semiconductor Lithography Equipment Industry Revenue (Million) Forecast, by Application 2019 & 2032
- Table 34: Netherland Semiconductor Lithography Equipment Industry Volume (K Unit) Forecast, by Application 2019 & 2032
- Table 35: Nordics Semiconductor Lithography Equipment Industry Revenue (Million) Forecast, by Application 2019 & 2032
- Table 36: Nordics Semiconductor Lithography Equipment Industry Volume (K Unit) Forecast, by Application 2019 & 2032
- Table 37: Rest of Europe Semiconductor Lithography Equipment Industry Revenue (Million) Forecast, by Application 2019 & 2032
- Table 38: Rest of Europe Semiconductor Lithography Equipment Industry Volume (K Unit) Forecast, by Application 2019 & 2032
- Table 39: Global Semiconductor Lithography Equipment Industry Revenue Million Forecast, by Country 2019 & 2032
- Table 40: Global Semiconductor Lithography Equipment Industry Volume K Unit Forecast, by Country 2019 & 2032
- Table 41: China Semiconductor Lithography Equipment Industry Revenue (Million) Forecast, by Application 2019 & 2032
- Table 42: China Semiconductor Lithography Equipment Industry Volume (K Unit) Forecast, by Application 2019 & 2032
- Table 43: Japan Semiconductor Lithography Equipment Industry Revenue (Million) Forecast, by Application 2019 & 2032
- Table 44: Japan Semiconductor Lithography Equipment Industry Volume (K Unit) Forecast, by Application 2019 & 2032
- Table 45: India Semiconductor Lithography Equipment Industry Revenue (Million) Forecast, by Application 2019 & 2032
- Table 46: India Semiconductor Lithography Equipment Industry Volume (K Unit) Forecast, by Application 2019 & 2032
- Table 47: South Korea Semiconductor Lithography Equipment Industry Revenue (Million) Forecast, by Application 2019 & 2032
- Table 48: South Korea Semiconductor Lithography Equipment Industry Volume (K Unit) Forecast, by Application 2019 & 2032
- Table 49: Southeast Asia Semiconductor Lithography Equipment Industry Revenue (Million) Forecast, by Application 2019 & 2032
- Table 50: Southeast Asia Semiconductor Lithography Equipment Industry Volume (K Unit) Forecast, by Application 2019 & 2032
- Table 51: Australia Semiconductor Lithography Equipment Industry Revenue (Million) Forecast, by Application 2019 & 2032
- Table 52: Australia Semiconductor Lithography Equipment Industry Volume (K Unit) Forecast, by Application 2019 & 2032
- Table 53: Indonesia Semiconductor Lithography Equipment Industry Revenue (Million) Forecast, by Application 2019 & 2032
- Table 54: Indonesia Semiconductor Lithography Equipment Industry Volume (K Unit) Forecast, by Application 2019 & 2032
- Table 55: Phillipes Semiconductor Lithography Equipment Industry Revenue (Million) Forecast, by Application 2019 & 2032
- Table 56: Phillipes Semiconductor Lithography Equipment Industry Volume (K Unit) Forecast, by Application 2019 & 2032
- Table 57: Singapore Semiconductor Lithography Equipment Industry Revenue (Million) Forecast, by Application 2019 & 2032
- Table 58: Singapore Semiconductor Lithography Equipment Industry Volume (K Unit) Forecast, by Application 2019 & 2032
- Table 59: Thailandc Semiconductor Lithography Equipment Industry Revenue (Million) Forecast, by Application 2019 & 2032
- Table 60: Thailandc Semiconductor Lithography Equipment Industry Volume (K Unit) Forecast, by Application 2019 & 2032
- Table 61: Rest of Asia Pacific Semiconductor Lithography Equipment Industry Revenue (Million) Forecast, by Application 2019 & 2032
- Table 62: Rest of Asia Pacific Semiconductor Lithography Equipment Industry Volume (K Unit) Forecast, by Application 2019 & 2032
- Table 63: Global Semiconductor Lithography Equipment Industry Revenue Million Forecast, by Country 2019 & 2032
- Table 64: Global Semiconductor Lithography Equipment Industry Volume K Unit Forecast, by Country 2019 & 2032
- Table 65: Brazil Semiconductor Lithography Equipment Industry Revenue (Million) Forecast, by Application 2019 & 2032
- Table 66: Brazil Semiconductor Lithography Equipment Industry Volume (K Unit) Forecast, by Application 2019 & 2032
- Table 67: Argentina Semiconductor Lithography Equipment Industry Revenue (Million) Forecast, by Application 2019 & 2032
- Table 68: Argentina Semiconductor Lithography Equipment Industry Volume (K Unit) Forecast, by Application 2019 & 2032
- Table 69: Peru Semiconductor Lithography Equipment Industry Revenue (Million) Forecast, by Application 2019 & 2032
- Table 70: Peru Semiconductor Lithography Equipment Industry Volume (K Unit) Forecast, by Application 2019 & 2032
- Table 71: Chile Semiconductor Lithography Equipment Industry Revenue (Million) Forecast, by Application 2019 & 2032
- Table 72: Chile Semiconductor Lithography Equipment Industry Volume (K Unit) Forecast, by Application 2019 & 2032
- Table 73: Colombia Semiconductor Lithography Equipment Industry Revenue (Million) Forecast, by Application 2019 & 2032
- Table 74: Colombia Semiconductor Lithography Equipment Industry Volume (K Unit) Forecast, by Application 2019 & 2032
- Table 75: Ecuador Semiconductor Lithography Equipment Industry Revenue (Million) Forecast, by Application 2019 & 2032
- Table 76: Ecuador Semiconductor Lithography Equipment Industry Volume (K Unit) Forecast, by Application 2019 & 2032
- Table 77: Venezuela Semiconductor Lithography Equipment Industry Revenue (Million) Forecast, by Application 2019 & 2032
- Table 78: Venezuela Semiconductor Lithography Equipment Industry Volume (K Unit) Forecast, by Application 2019 & 2032
- Table 79: Rest of South America Semiconductor Lithography Equipment Industry Revenue (Million) Forecast, by Application 2019 & 2032
- Table 80: Rest of South America Semiconductor Lithography Equipment Industry Volume (K Unit) Forecast, by Application 2019 & 2032
- Table 81: Global Semiconductor Lithography Equipment Industry Revenue Million Forecast, by Country 2019 & 2032
- Table 82: Global Semiconductor Lithography Equipment Industry Volume K Unit Forecast, by Country 2019 & 2032
- Table 83: United States Semiconductor Lithography Equipment Industry Revenue (Million) Forecast, by Application 2019 & 2032
- Table 84: United States Semiconductor Lithography Equipment Industry Volume (K Unit) Forecast, by Application 2019 & 2032
- Table 85: Canada Semiconductor Lithography Equipment Industry Revenue (Million) Forecast, by Application 2019 & 2032
- Table 86: Canada Semiconductor Lithography Equipment Industry Volume (K Unit) Forecast, by Application 2019 & 2032
- Table 87: Mexico Semiconductor Lithography Equipment Industry Revenue (Million) Forecast, by Application 2019 & 2032
- Table 88: Mexico Semiconductor Lithography Equipment Industry Volume (K Unit) Forecast, by Application 2019 & 2032
- Table 89: Global Semiconductor Lithography Equipment Industry Revenue Million Forecast, by Country 2019 & 2032
- Table 90: Global Semiconductor Lithography Equipment Industry Volume K Unit Forecast, by Country 2019 & 2032
- Table 91: United Arab Emirates Semiconductor Lithography Equipment Industry Revenue (Million) Forecast, by Application 2019 & 2032
- Table 92: United Arab Emirates Semiconductor Lithography Equipment Industry Volume (K Unit) Forecast, by Application 2019 & 2032
- Table 93: Saudi Arabia Semiconductor Lithography Equipment Industry Revenue (Million) Forecast, by Application 2019 & 2032
- Table 94: Saudi Arabia Semiconductor Lithography Equipment Industry Volume (K Unit) Forecast, by Application 2019 & 2032
- Table 95: South Africa Semiconductor Lithography Equipment Industry Revenue (Million) Forecast, by Application 2019 & 2032
- Table 96: South Africa Semiconductor Lithography Equipment Industry Volume (K Unit) Forecast, by Application 2019 & 2032
- Table 97: Rest of Middle East and Africa Semiconductor Lithography Equipment Industry Revenue (Million) Forecast, by Application 2019 & 2032
- Table 98: Rest of Middle East and Africa Semiconductor Lithography Equipment Industry Volume (K Unit) Forecast, by Application 2019 & 2032
- Table 99: Global Semiconductor Lithography Equipment Industry Revenue Million Forecast, by Type 2019 & 2032
- Table 100: Global Semiconductor Lithography Equipment Industry Volume K Unit Forecast, by Type 2019 & 2032
- Table 101: Global Semiconductor Lithography Equipment Industry Revenue Million Forecast, by Application 2019 & 2032
- Table 102: Global Semiconductor Lithography Equipment Industry Volume K Unit Forecast, by Application 2019 & 2032
- Table 103: Global Semiconductor Lithography Equipment Industry Revenue Million Forecast, by Country 2019 & 2032
- Table 104: Global Semiconductor Lithography Equipment Industry Volume K Unit Forecast, by Country 2019 & 2032
- Table 105: Global Semiconductor Lithography Equipment Industry Revenue Million Forecast, by Type 2019 & 2032
- Table 106: Global Semiconductor Lithography Equipment Industry Volume K Unit Forecast, by Type 2019 & 2032
- Table 107: Global Semiconductor Lithography Equipment Industry Revenue Million Forecast, by Application 2019 & 2032
- Table 108: Global Semiconductor Lithography Equipment Industry Volume K Unit Forecast, by Application 2019 & 2032
- Table 109: Global Semiconductor Lithography Equipment Industry Revenue Million Forecast, by Country 2019 & 2032
- Table 110: Global Semiconductor Lithography Equipment Industry Volume K Unit Forecast, by Country 2019 & 2032
- Table 111: Global Semiconductor Lithography Equipment Industry Revenue Million Forecast, by Type 2019 & 2032
- Table 112: Global Semiconductor Lithography Equipment Industry Volume K Unit Forecast, by Type 2019 & 2032
- Table 113: Global Semiconductor Lithography Equipment Industry Revenue Million Forecast, by Application 2019 & 2032
- Table 114: Global Semiconductor Lithography Equipment Industry Volume K Unit Forecast, by Application 2019 & 2032
- Table 115: Global Semiconductor Lithography Equipment Industry Revenue Million Forecast, by Country 2019 & 2032
- Table 116: Global Semiconductor Lithography Equipment Industry Volume K Unit Forecast, by Country 2019 & 2032
- Table 117: Global Semiconductor Lithography Equipment Industry Revenue Million Forecast, by Type 2019 & 2032
- Table 118: Global Semiconductor Lithography Equipment Industry Volume K Unit Forecast, by Type 2019 & 2032
- Table 119: Global Semiconductor Lithography Equipment Industry Revenue Million Forecast, by Application 2019 & 2032
- Table 120: Global Semiconductor Lithography Equipment Industry Volume K Unit Forecast, by Application 2019 & 2032
- Table 121: Global Semiconductor Lithography Equipment Industry Revenue Million Forecast, by Country 2019 & 2032
- Table 122: Global Semiconductor Lithography Equipment Industry Volume K Unit Forecast, by Country 2019 & 2032
- Table 123: Global Semiconductor Lithography Equipment Industry Revenue Million Forecast, by Type 2019 & 2032
- Table 124: Global Semiconductor Lithography Equipment Industry Volume K Unit Forecast, by Type 2019 & 2032
- Table 125: Global Semiconductor Lithography Equipment Industry Revenue Million Forecast, by Application 2019 & 2032
- Table 126: Global Semiconductor Lithography Equipment Industry Volume K Unit Forecast, by Application 2019 & 2032
- Table 127: Global Semiconductor Lithography Equipment Industry Revenue Million Forecast, by Country 2019 & 2032
- Table 128: Global Semiconductor Lithography Equipment Industry Volume K Unit Forecast, by Country 2019 & 2032
- Table 129: Global Semiconductor Lithography Equipment Industry Revenue Million Forecast, by Type 2019 & 2032
- Table 130: Global Semiconductor Lithography Equipment Industry Volume K Unit Forecast, by Type 2019 & 2032
- Table 131: Global Semiconductor Lithography Equipment Industry Revenue Million Forecast, by Application 2019 & 2032
- Table 132: Global Semiconductor Lithography Equipment Industry Volume K Unit Forecast, by Application 2019 & 2032
- Table 133: Global Semiconductor Lithography Equipment Industry Revenue Million Forecast, by Country 2019 & 2032
- Table 134: Global Semiconductor Lithography Equipment Industry Volume K Unit Forecast, by Country 2019 & 2032
Frequently Asked Questions
1. What is the projected Compound Annual Growth Rate (CAGR) of the Semiconductor Lithography Equipment Industry?
The projected CAGR is approximately 7.38%.
2. Which companies are prominent players in the Semiconductor Lithography Equipment Industry?
Key companies in the market include SÜSS MicroTec SE, Veeco Instruments Inc, Canon Inc, Shanghai Micro Electronics Equipment (Group) Co Ltd, Nikon Corporation, JEOL Ltd, Neutronix Quintel Inc (NXQ)7 2 Vendor Market Share Analysi, Onto Innovation (Rudolph Technologies Inc ), ASML Holding NV, EV Group (EVG).
3. What are the main segments of the Semiconductor Lithography Equipment Industry?
The market segments include Type, Application.
4. Can you provide details about the market size?
The market size is estimated to be USD 26.48 Million as of 2022.
5. What are some drivers contributing to market growth?
Increasing Demand for Miniaturization and Extra Functionality by Electric Vehicles and Advanced Mobile Devices; Growing Innovation by Specialist Equipment Vendors offering Brand New Lithography Tools.
6. What are the notable trends driving market growth?
Deep Ultraviolet Lithography (DUV) to Hold Major Market Share.
7. Are there any restraints impacting market growth?
Challenges Regarding Complexity of Pattern in Manufacturing Process.
8. Can you provide examples of recent developments in the market?
December 2022 - Canon Inc. launched an i-line lithography stepper for 3D advanced packaging, such as those used with chiplets mounted on an interposer. The FPA-5520iV LF2, based on 365nm wavelength light, is optimized for back-end processing and delivers 0.8-micron resolution across a 52 mm by 68 mm single-exposure field. A four-shot mode extends the area to 100 mm by 100 mm.
9. What pricing options are available for accessing the report?
Pricing options include single-user, multi-user, and enterprise licenses priced at USD 4750, USD 5250, and USD 8750 respectively.
10. Is the market size provided in terms of value or volume?
The market size is provided in terms of value, measured in Million and volume, measured in K Unit.
11. Are there any specific market keywords associated with the report?
Yes, the market keyword associated with the report is "Semiconductor Lithography Equipment Industry," which aids in identifying and referencing the specific market segment covered.
12. How do I determine which pricing option suits my needs best?
The pricing options vary based on user requirements and access needs. Individual users may opt for single-user licenses, while businesses requiring broader access may choose multi-user or enterprise licenses for cost-effective access to the report.
13. Are there any additional resources or data provided in the Semiconductor Lithography Equipment Industry report?
While the report offers comprehensive insights, it's advisable to review the specific contents or supplementary materials provided to ascertain if additional resources or data are available.
14. How can I stay updated on further developments or reports in the Semiconductor Lithography Equipment Industry?
To stay informed about further developments, trends, and reports in the Semiconductor Lithography Equipment Industry, consider subscribing to industry newsletters, following relevant companies and organizations, or regularly checking reputable industry news sources and publications.
Methodology
Step 1 - Identification of Relevant Samples Size from Population Database


Step 2 - Approaches for Defining Global Market Size (Value, Volume* & Price*)

Note*: In applicable scenarios
Step 3 - Data Sources
Primary Research
- Web Analytics
- Survey Reports
- Research Institute
- Latest Research Reports
- Opinion Leaders
Secondary Research
- Annual Reports
- White Paper
- Latest Press Release
- Industry Association
- Paid Database
- Investor Presentations

Step 4 - Data Triangulation
Involves using different sources of information in order to increase the validity of a study
These sources are likely to be stakeholders in a program - participants, other researchers, program staff, other community members, and so on.
Then we put all data in single framework & apply various statistical tools to find out the dynamic on the market.
During the analysis stage, feedback from the stakeholder groups would be compared to determine areas of agreement as well as areas of divergence
