

Key Insights
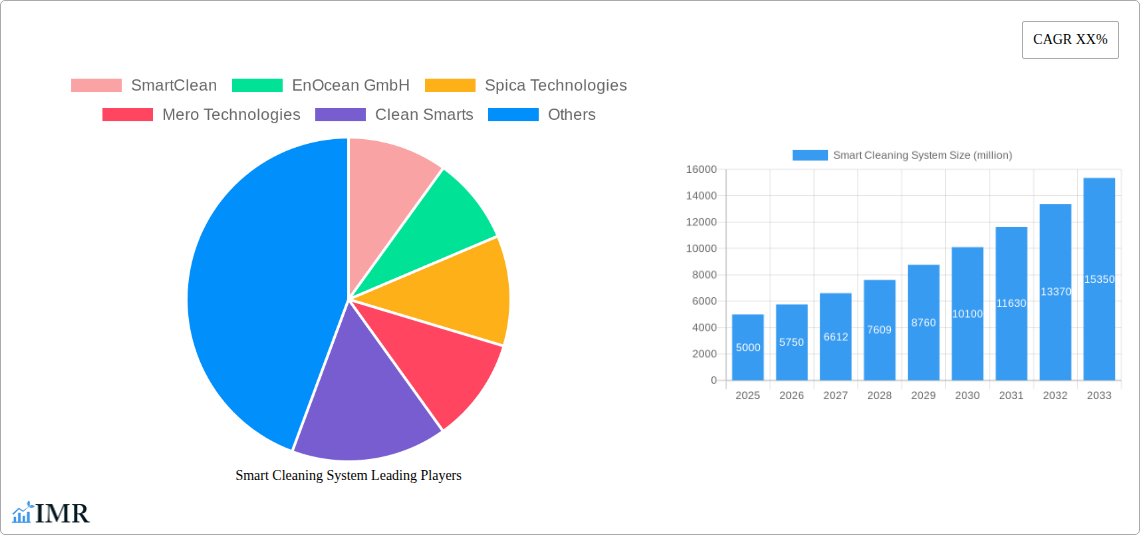
The smart cleaning systems market is experiencing robust growth, driven by increasing demand for efficient, hygienic, and data-driven cleaning solutions across various sectors. The market, estimated at $5 billion in 2025, is projected to witness a Compound Annual Growth Rate (CAGR) of 15% from 2025 to 2033, reaching approximately $15 billion by 2033. This growth is fueled by several key factors. Firstly, the rising adoption of automation and IoT technologies in cleaning operations enhances productivity and reduces labor costs. Secondly, the growing awareness of hygiene and sanitation, particularly post-pandemic, is boosting demand for advanced cleaning systems that ensure thorough disinfection. Thirdly, the integration of data analytics and remote monitoring capabilities enables optimized cleaning schedules and resource allocation, improving efficiency and reducing environmental impact. Key players like SmartClean, EnOcean GmbH, and Diversey Holdings are driving innovation through the development of advanced sensor technologies, AI-powered cleaning robots, and cloud-based management platforms.
Despite the positive outlook, the market faces certain challenges. High initial investment costs associated with implementing smart cleaning systems can be a barrier for small businesses. Furthermore, concerns regarding data security and privacy related to the collection and analysis of cleaning data need to be addressed. However, ongoing technological advancements, decreasing hardware costs, and the increasing availability of financing options are expected to mitigate these restraints. The market segmentation reflects diverse application areas, including commercial, healthcare, and industrial sectors. Regional variations in adoption rates are anticipated, with North America and Europe leading the market initially due to higher technological adoption and awareness, while other regions like Asia-Pacific are projected to show significant growth in the later forecast period.
Smart Cleaning System Market Report: 2019-2033
This comprehensive report provides an in-depth analysis of the global smart cleaning system market, encompassing market dynamics, growth trends, regional analysis, competitive landscape, and future outlook. The study period covers 2019-2033, with 2025 as the base and estimated year. This report is essential for industry professionals, investors, and strategic decision-makers seeking to understand and capitalize on opportunities within this rapidly evolving sector. The report uses million units as the unit of measurement for market size.
Smart Cleaning System Market Dynamics & Structure
The smart cleaning system market is characterized by moderate concentration, with key players like SmartClean, Diversey Holdings, and Soobr holding significant market share (estimated at xx%, xx%, and xx% respectively in 2025). Technological innovation, driven by advancements in IoT, AI, and robotics, is a primary growth driver. Stringent regulatory frameworks regarding hygiene and sanitation, particularly in the healthcare and hospitality sectors, further stimulate market growth. The market faces competition from traditional cleaning methods and equipment; however, the increasing demand for efficiency and data-driven insights is fueling the adoption of smart cleaning systems. M&A activity has been relatively low in the recent past (xx deals in 2019-2024), but we anticipate an increase in the forecast period due to consolidation and expansion efforts.
- Market Concentration: Moderately concentrated, with top 5 players holding xx% market share in 2025.
- Technological Innovation: Significant advancements in AI-powered cleaning robots and IoT-enabled sensor technology.
- Regulatory Landscape: Stringent hygiene standards in healthcare and hospitality sectors drive adoption.
- Competitive Substitutes: Traditional cleaning methods and equipment represent the primary competition.
- End-User Demographics: Growth primarily driven by healthcare, hospitality, commercial, and industrial sectors.
- M&A Activity: xx deals from 2019-2024, with a projected increase in the forecast period.
- Innovation Barriers: High initial investment costs and integration complexities can hinder adoption.
Smart Cleaning System Growth Trends & Insights
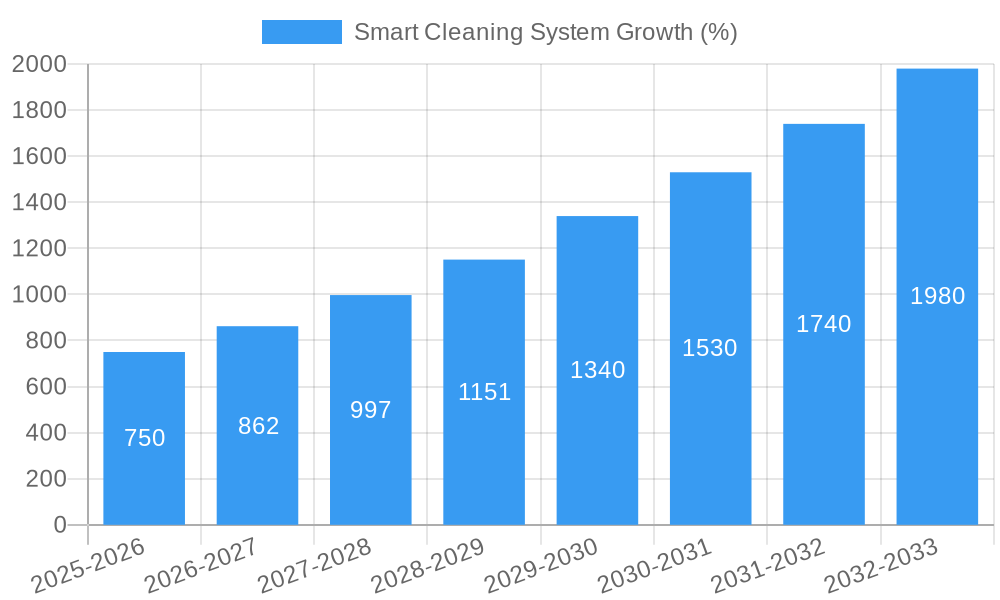
The global smart cleaning system market exhibited robust growth during the historical period (2019-2024), expanding at a CAGR of xx%. This growth is attributed to rising awareness of hygiene and sanitation, coupled with increasing labor costs and the need for improved efficiency. Market penetration remains relatively low (xx% in 2025), indicating significant untapped potential. Technological disruptions, such as the introduction of autonomous cleaning robots and advanced sensor technologies, are accelerating market expansion. Consumer behavior is shifting towards smart and automated solutions, driven by convenience, cost savings, and improved hygiene standards. The market size is projected to reach xx million units by 2033, growing at a CAGR of xx% during the forecast period (2025-2033).
Dominant Regions, Countries, or Segments in Smart Cleaning System
North America currently holds the largest market share in the smart cleaning system market, driven by high adoption rates in the healthcare and hospitality sectors, coupled with strong technological advancements and supportive regulatory frameworks. The region benefits from advanced infrastructure and high disposable incomes. Europe is another significant market, witnessing steady growth propelled by increasing environmental awareness and government initiatives promoting sustainable cleaning solutions. The Asia-Pacific region presents high growth potential, fueled by rapid urbanization, rising disposable incomes, and increasing demand for efficient cleaning solutions in developing economies.
- North America: High adoption rates, advanced infrastructure, and supportive regulatory environment.
- Europe: Steady growth driven by environmental consciousness and government initiatives.
- Asia-Pacific: High growth potential due to rapid urbanization, rising disposable incomes, and industrialization.
- Market Share Distribution: North America (xx%), Europe (xx%), Asia-Pacific (xx%), Rest of World (xx%) in 2025.
Smart Cleaning System Product Landscape
The smart cleaning system market offers a diverse range of products, including autonomous cleaning robots, intelligent cleaning equipment with integrated sensors, and cloud-based software for managing cleaning operations. Key features include real-time data analytics, remote monitoring capabilities, and predictive maintenance functionalities. These systems enhance cleaning efficiency, reduce labor costs, and improve overall hygiene standards. Recent innovations focus on AI-powered navigation, improved sensor accuracy, and integration with existing building management systems.
Key Drivers, Barriers & Challenges in Smart Cleaning System
Key Drivers:
- Rising demand for hygiene and sanitation, particularly in healthcare and hospitality.
- Increasing labor costs and the need for improved efficiency.
- Technological advancements in robotics, AI, and IoT.
- Government regulations promoting sustainable cleaning practices.
Challenges & Restraints:
- High initial investment costs for smart cleaning systems.
- Integration complexities with existing building infrastructure.
- Concerns regarding data security and privacy.
- Competition from traditional cleaning methods and equipment. This results in a xx% reduction in market growth annually.
Emerging Opportunities in Smart Cleaning System
Emerging opportunities lie in untapped markets like smart home cleaning, the integration of smart cleaning systems with building automation systems, and the development of specialized cleaning solutions for specific industries (e.g., food processing, pharmaceutical). The expansion into developing economies presents significant growth potential. Furthermore, the integration of advanced analytics for predictive maintenance and optimized resource allocation offers considerable value.
Growth Accelerators in the Smart Cleaning System Industry
Technological breakthroughs in AI, robotics, and sensor technology are key growth accelerators. Strategic partnerships between cleaning equipment manufacturers and software developers are facilitating the development of integrated solutions. Expansion into new markets and applications, such as smart home cleaning and specialized industrial cleaning, are driving long-term market growth.
Key Players Shaping the Smart Cleaning System Market
- SmartClean
- EnOcean GmbH
- Spica Technologies
- Mero Technologies
- Clean Smarts
- Diversey Holdings
- Soobr
Notable Milestones in Smart Cleaning System Sector
- 2020: SmartClean launches its AI-powered autonomous cleaning robot.
- 2022: Diversey Holdings acquires a smaller smart cleaning technology company.
- 2023: EnOcean GmbH releases a new generation of energy-efficient sensors for smart cleaning systems.
- 2024: Industry consortium formed to develop standardized communication protocols.
In-Depth Smart Cleaning System Market Outlook
The smart cleaning system market is poised for significant growth over the next decade, driven by sustained technological advancements, increasing adoption across diverse sectors, and expansion into new geographic markets. Strategic partnerships and the development of innovative solutions will further accelerate market expansion. The integration of smart cleaning systems into broader building management systems represents a key area of future opportunity, unlocking further efficiencies and cost savings.
Smart Cleaning System Segmentation
-
1. Application
- 1.1. Offices
- 1.2. Malls
- 1.3. Others
-
2. Types
- 2.1. On-premises
- 2.2. Cloud-Based
Smart Cleaning System Segmentation By Geography
-
1. North America
- 1.1. United States
- 1.2. Canada
- 1.3. Mexico
-
2. South America
- 2.1. Brazil
- 2.2. Argentina
- 2.3. Rest of South America
-
3. Europe
- 3.1. United Kingdom
- 3.2. Germany
- 3.3. France
- 3.4. Italy
- 3.5. Spain
- 3.6. Russia
- 3.7. Benelux
- 3.8. Nordics
- 3.9. Rest of Europe
-
4. Middle East & Africa
- 4.1. Turkey
- 4.2. Israel
- 4.3. GCC
- 4.4. North Africa
- 4.5. South Africa
- 4.6. Rest of Middle East & Africa
-
5. Asia Pacific
- 5.1. China
- 5.2. India
- 5.3. Japan
- 5.4. South Korea
- 5.5. ASEAN
- 5.6. Oceania
- 5.7. Rest of Asia Pacific

Smart Cleaning System REPORT HIGHLIGHTS
| Aspects | Details |
|---|---|
| Study Period | 2019-2033 |
| Base Year | 2024 |
| Estimated Year | 2025 |
| Forecast Period | 2025-2033 |
| Historical Period | 2019-2024 |
| Growth Rate | CAGR of XX% from 2019-2033 |
| Segmentation |
|
Table of Contents
- 1. Introduction
- 1.1. Research Scope
- 1.2. Market Segmentation
- 1.3. Research Methodology
- 1.4. Definitions and Assumptions
- 2. Executive Summary
- 2.1. Introduction
- 3. Market Dynamics
- 3.1. Introduction
- 3.2. Market Drivers
- 3.3. Market Restrains
- 3.4. Market Trends
- 4. Market Factor Analysis
- 4.1. Porters Five Forces
- 4.2. Supply/Value Chain
- 4.3. PESTEL analysis
- 4.4. Market Entropy
- 4.5. Patent/Trademark Analysis
- 5. Global Smart Cleaning System Analysis, Insights and Forecast, 2019-2031
- 5.1. Market Analysis, Insights and Forecast - by Application
- 5.1.1. Offices
- 5.1.2. Malls
- 5.1.3. Others
- 5.2. Market Analysis, Insights and Forecast - by Types
- 5.2.1. On-premises
- 5.2.2. Cloud-Based
- 5.3. Market Analysis, Insights and Forecast - by Region
- 5.3.1. North America
- 5.3.2. South America
- 5.3.3. Europe
- 5.3.4. Middle East & Africa
- 5.3.5. Asia Pacific
- 5.1. Market Analysis, Insights and Forecast - by Application
- 6. North America Smart Cleaning System Analysis, Insights and Forecast, 2019-2031
- 6.1. Market Analysis, Insights and Forecast - by Application
- 6.1.1. Offices
- 6.1.2. Malls
- 6.1.3. Others
- 6.2. Market Analysis, Insights and Forecast - by Types
- 6.2.1. On-premises
- 6.2.2. Cloud-Based
- 6.1. Market Analysis, Insights and Forecast - by Application
- 7. South America Smart Cleaning System Analysis, Insights and Forecast, 2019-2031
- 7.1. Market Analysis, Insights and Forecast - by Application
- 7.1.1. Offices
- 7.1.2. Malls
- 7.1.3. Others
- 7.2. Market Analysis, Insights and Forecast - by Types
- 7.2.1. On-premises
- 7.2.2. Cloud-Based
- 7.1. Market Analysis, Insights and Forecast - by Application
- 8. Europe Smart Cleaning System Analysis, Insights and Forecast, 2019-2031
- 8.1. Market Analysis, Insights and Forecast - by Application
- 8.1.1. Offices
- 8.1.2. Malls
- 8.1.3. Others
- 8.2. Market Analysis, Insights and Forecast - by Types
- 8.2.1. On-premises
- 8.2.2. Cloud-Based
- 8.1. Market Analysis, Insights and Forecast - by Application
- 9. Middle East & Africa Smart Cleaning System Analysis, Insights and Forecast, 2019-2031
- 9.1. Market Analysis, Insights and Forecast - by Application
- 9.1.1. Offices
- 9.1.2. Malls
- 9.1.3. Others
- 9.2. Market Analysis, Insights and Forecast - by Types
- 9.2.1. On-premises
- 9.2.2. Cloud-Based
- 9.1. Market Analysis, Insights and Forecast - by Application
- 10. Asia Pacific Smart Cleaning System Analysis, Insights and Forecast, 2019-2031
- 10.1. Market Analysis, Insights and Forecast - by Application
- 10.1.1. Offices
- 10.1.2. Malls
- 10.1.3. Others
- 10.2. Market Analysis, Insights and Forecast - by Types
- 10.2.1. On-premises
- 10.2.2. Cloud-Based
- 10.1. Market Analysis, Insights and Forecast - by Application
- 11. Competitive Analysis
- 11.1. Global Market Share Analysis 2024
- 11.2. Company Profiles
- 11.2.1 SmartClean
- 11.2.1.1. Overview
- 11.2.1.2. Products
- 11.2.1.3. SWOT Analysis
- 11.2.1.4. Recent Developments
- 11.2.1.5. Financials (Based on Availability)
- 11.2.2 EnOcean GmbH
- 11.2.2.1. Overview
- 11.2.2.2. Products
- 11.2.2.3. SWOT Analysis
- 11.2.2.4. Recent Developments
- 11.2.2.5. Financials (Based on Availability)
- 11.2.3 Spica Technologies
- 11.2.3.1. Overview
- 11.2.3.2. Products
- 11.2.3.3. SWOT Analysis
- 11.2.3.4. Recent Developments
- 11.2.3.5. Financials (Based on Availability)
- 11.2.4 Mero Technologies
- 11.2.4.1. Overview
- 11.2.4.2. Products
- 11.2.4.3. SWOT Analysis
- 11.2.4.4. Recent Developments
- 11.2.4.5. Financials (Based on Availability)
- 11.2.5 Clean Smarts
- 11.2.5.1. Overview
- 11.2.5.2. Products
- 11.2.5.3. SWOT Analysis
- 11.2.5.4. Recent Developments
- 11.2.5.5. Financials (Based on Availability)
- 11.2.6 Diversey Holdings
- 11.2.6.1. Overview
- 11.2.6.2. Products
- 11.2.6.3. SWOT Analysis
- 11.2.6.4. Recent Developments
- 11.2.6.5. Financials (Based on Availability)
- 11.2.7 Soobr
- 11.2.7.1. Overview
- 11.2.7.2. Products
- 11.2.7.3. SWOT Analysis
- 11.2.7.4. Recent Developments
- 11.2.7.5. Financials (Based on Availability)
- 11.2.1 SmartClean
List of Figures
- Figure 1: Global Smart Cleaning System Revenue Breakdown (million, %) by Region 2024 & 2032
- Figure 2: North America Smart Cleaning System Revenue (million), by Application 2024 & 2032
- Figure 3: North America Smart Cleaning System Revenue Share (%), by Application 2024 & 2032
- Figure 4: North America Smart Cleaning System Revenue (million), by Types 2024 & 2032
- Figure 5: North America Smart Cleaning System Revenue Share (%), by Types 2024 & 2032
- Figure 6: North America Smart Cleaning System Revenue (million), by Country 2024 & 2032
- Figure 7: North America Smart Cleaning System Revenue Share (%), by Country 2024 & 2032
- Figure 8: South America Smart Cleaning System Revenue (million), by Application 2024 & 2032
- Figure 9: South America Smart Cleaning System Revenue Share (%), by Application 2024 & 2032
- Figure 10: South America Smart Cleaning System Revenue (million), by Types 2024 & 2032
- Figure 11: South America Smart Cleaning System Revenue Share (%), by Types 2024 & 2032
- Figure 12: South America Smart Cleaning System Revenue (million), by Country 2024 & 2032
- Figure 13: South America Smart Cleaning System Revenue Share (%), by Country 2024 & 2032
- Figure 14: Europe Smart Cleaning System Revenue (million), by Application 2024 & 2032
- Figure 15: Europe Smart Cleaning System Revenue Share (%), by Application 2024 & 2032
- Figure 16: Europe Smart Cleaning System Revenue (million), by Types 2024 & 2032
- Figure 17: Europe Smart Cleaning System Revenue Share (%), by Types 2024 & 2032
- Figure 18: Europe Smart Cleaning System Revenue (million), by Country 2024 & 2032
- Figure 19: Europe Smart Cleaning System Revenue Share (%), by Country 2024 & 2032
- Figure 20: Middle East & Africa Smart Cleaning System Revenue (million), by Application 2024 & 2032
- Figure 21: Middle East & Africa Smart Cleaning System Revenue Share (%), by Application 2024 & 2032
- Figure 22: Middle East & Africa Smart Cleaning System Revenue (million), by Types 2024 & 2032
- Figure 23: Middle East & Africa Smart Cleaning System Revenue Share (%), by Types 2024 & 2032
- Figure 24: Middle East & Africa Smart Cleaning System Revenue (million), by Country 2024 & 2032
- Figure 25: Middle East & Africa Smart Cleaning System Revenue Share (%), by Country 2024 & 2032
- Figure 26: Asia Pacific Smart Cleaning System Revenue (million), by Application 2024 & 2032
- Figure 27: Asia Pacific Smart Cleaning System Revenue Share (%), by Application 2024 & 2032
- Figure 28: Asia Pacific Smart Cleaning System Revenue (million), by Types 2024 & 2032
- Figure 29: Asia Pacific Smart Cleaning System Revenue Share (%), by Types 2024 & 2032
- Figure 30: Asia Pacific Smart Cleaning System Revenue (million), by Country 2024 & 2032
- Figure 31: Asia Pacific Smart Cleaning System Revenue Share (%), by Country 2024 & 2032
List of Tables
- Table 1: Global Smart Cleaning System Revenue million Forecast, by Region 2019 & 2032
- Table 2: Global Smart Cleaning System Revenue million Forecast, by Application 2019 & 2032
- Table 3: Global Smart Cleaning System Revenue million Forecast, by Types 2019 & 2032
- Table 4: Global Smart Cleaning System Revenue million Forecast, by Region 2019 & 2032
- Table 5: Global Smart Cleaning System Revenue million Forecast, by Application 2019 & 2032
- Table 6: Global Smart Cleaning System Revenue million Forecast, by Types 2019 & 2032
- Table 7: Global Smart Cleaning System Revenue million Forecast, by Country 2019 & 2032
- Table 8: United States Smart Cleaning System Revenue (million) Forecast, by Application 2019 & 2032
- Table 9: Canada Smart Cleaning System Revenue (million) Forecast, by Application 2019 & 2032
- Table 10: Mexico Smart Cleaning System Revenue (million) Forecast, by Application 2019 & 2032
- Table 11: Global Smart Cleaning System Revenue million Forecast, by Application 2019 & 2032
- Table 12: Global Smart Cleaning System Revenue million Forecast, by Types 2019 & 2032
- Table 13: Global Smart Cleaning System Revenue million Forecast, by Country 2019 & 2032
- Table 14: Brazil Smart Cleaning System Revenue (million) Forecast, by Application 2019 & 2032
- Table 15: Argentina Smart Cleaning System Revenue (million) Forecast, by Application 2019 & 2032
- Table 16: Rest of South America Smart Cleaning System Revenue (million) Forecast, by Application 2019 & 2032
- Table 17: Global Smart Cleaning System Revenue million Forecast, by Application 2019 & 2032
- Table 18: Global Smart Cleaning System Revenue million Forecast, by Types 2019 & 2032
- Table 19: Global Smart Cleaning System Revenue million Forecast, by Country 2019 & 2032
- Table 20: United Kingdom Smart Cleaning System Revenue (million) Forecast, by Application 2019 & 2032
- Table 21: Germany Smart Cleaning System Revenue (million) Forecast, by Application 2019 & 2032
- Table 22: France Smart Cleaning System Revenue (million) Forecast, by Application 2019 & 2032
- Table 23: Italy Smart Cleaning System Revenue (million) Forecast, by Application 2019 & 2032
- Table 24: Spain Smart Cleaning System Revenue (million) Forecast, by Application 2019 & 2032
- Table 25: Russia Smart Cleaning System Revenue (million) Forecast, by Application 2019 & 2032
- Table 26: Benelux Smart Cleaning System Revenue (million) Forecast, by Application 2019 & 2032
- Table 27: Nordics Smart Cleaning System Revenue (million) Forecast, by Application 2019 & 2032
- Table 28: Rest of Europe Smart Cleaning System Revenue (million) Forecast, by Application 2019 & 2032
- Table 29: Global Smart Cleaning System Revenue million Forecast, by Application 2019 & 2032
- Table 30: Global Smart Cleaning System Revenue million Forecast, by Types 2019 & 2032
- Table 31: Global Smart Cleaning System Revenue million Forecast, by Country 2019 & 2032
- Table 32: Turkey Smart Cleaning System Revenue (million) Forecast, by Application 2019 & 2032
- Table 33: Israel Smart Cleaning System Revenue (million) Forecast, by Application 2019 & 2032
- Table 34: GCC Smart Cleaning System Revenue (million) Forecast, by Application 2019 & 2032
- Table 35: North Africa Smart Cleaning System Revenue (million) Forecast, by Application 2019 & 2032
- Table 36: South Africa Smart Cleaning System Revenue (million) Forecast, by Application 2019 & 2032
- Table 37: Rest of Middle East & Africa Smart Cleaning System Revenue (million) Forecast, by Application 2019 & 2032
- Table 38: Global Smart Cleaning System Revenue million Forecast, by Application 2019 & 2032
- Table 39: Global Smart Cleaning System Revenue million Forecast, by Types 2019 & 2032
- Table 40: Global Smart Cleaning System Revenue million Forecast, by Country 2019 & 2032
- Table 41: China Smart Cleaning System Revenue (million) Forecast, by Application 2019 & 2032
- Table 42: India Smart Cleaning System Revenue (million) Forecast, by Application 2019 & 2032
- Table 43: Japan Smart Cleaning System Revenue (million) Forecast, by Application 2019 & 2032
- Table 44: South Korea Smart Cleaning System Revenue (million) Forecast, by Application 2019 & 2032
- Table 45: ASEAN Smart Cleaning System Revenue (million) Forecast, by Application 2019 & 2032
- Table 46: Oceania Smart Cleaning System Revenue (million) Forecast, by Application 2019 & 2032
- Table 47: Rest of Asia Pacific Smart Cleaning System Revenue (million) Forecast, by Application 2019 & 2032
Frequently Asked Questions
1. What is the projected Compound Annual Growth Rate (CAGR) of the Smart Cleaning System?
The projected CAGR is approximately XX%.
2. Which companies are prominent players in the Smart Cleaning System?
Key companies in the market include SmartClean, EnOcean GmbH, Spica Technologies, Mero Technologies, Clean Smarts, Diversey Holdings, Soobr.
3. What are the main segments of the Smart Cleaning System?
The market segments include Application, Types.
4. Can you provide details about the market size?
The market size is estimated to be USD XXX million as of 2022.
5. What are some drivers contributing to market growth?
N/A
6. What are the notable trends driving market growth?
N/A
7. Are there any restraints impacting market growth?
N/A
8. Can you provide examples of recent developments in the market?
N/A
9. What pricing options are available for accessing the report?
Pricing options include single-user, multi-user, and enterprise licenses priced at USD 3350.00, USD 5025.00, and USD 6700.00 respectively.
10. Is the market size provided in terms of value or volume?
The market size is provided in terms of value, measured in million.
11. Are there any specific market keywords associated with the report?
Yes, the market keyword associated with the report is "Smart Cleaning System," which aids in identifying and referencing the specific market segment covered.
12. How do I determine which pricing option suits my needs best?
The pricing options vary based on user requirements and access needs. Individual users may opt for single-user licenses, while businesses requiring broader access may choose multi-user or enterprise licenses for cost-effective access to the report.
13. Are there any additional resources or data provided in the Smart Cleaning System report?
While the report offers comprehensive insights, it's advisable to review the specific contents or supplementary materials provided to ascertain if additional resources or data are available.
14. How can I stay updated on further developments or reports in the Smart Cleaning System?
To stay informed about further developments, trends, and reports in the Smart Cleaning System, consider subscribing to industry newsletters, following relevant companies and organizations, or regularly checking reputable industry news sources and publications.
Methodology
Step 1 - Identification of Relevant Samples Size from Population Database


Step 2 - Approaches for Defining Global Market Size (Value, Volume* & Price*)

Note*: In applicable scenarios
Step 3 - Data Sources
Primary Research
- Web Analytics
- Survey Reports
- Research Institute
- Latest Research Reports
- Opinion Leaders
Secondary Research
- Annual Reports
- White Paper
- Latest Press Release
- Industry Association
- Paid Database
- Investor Presentations

Step 4 - Data Triangulation
Involves using different sources of information in order to increase the validity of a study
These sources are likely to be stakeholders in a program - participants, other researchers, program staff, other community members, and so on.
Then we put all data in single framework & apply various statistical tools to find out the dynamic on the market.
During the analysis stage, feedback from the stakeholder groups would be compared to determine areas of agreement as well as areas of divergence
