

Key Insights
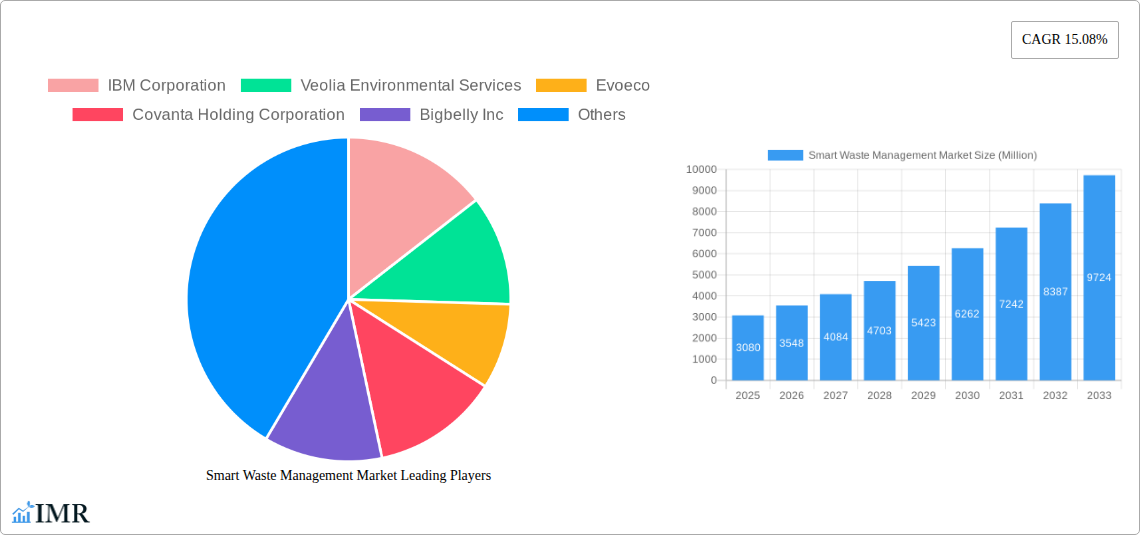
The smart waste management market is experiencing robust growth, projected to reach \$3.08 billion in 2025 and exhibiting a Compound Annual Growth Rate (CAGR) of 15.08% from 2025 to 2033. This expansion is fueled by several key drivers. Increasing urbanization leads to escalating waste generation, demanding efficient and sustainable waste management solutions. Smart technologies, such as IoT-enabled sensors, AI-powered analytics, and advanced fleet management systems, offer significant improvements in waste collection efficiency, reducing operational costs and environmental impact. Furthermore, stringent government regulations aimed at promoting waste reduction and recycling are pushing municipalities and private companies to adopt smarter approaches. The market is segmented by waste type (industrial and residential) and solution (fleet management, remote monitoring, and analytics). The integration of these technologies streamlines waste collection routes, optimizes bin capacity utilization, and enables proactive maintenance, resulting in considerable cost savings and improved service delivery. The growing emphasis on sustainability and the increasing availability of affordable smart waste management solutions are expected to further accelerate market growth throughout the forecast period.
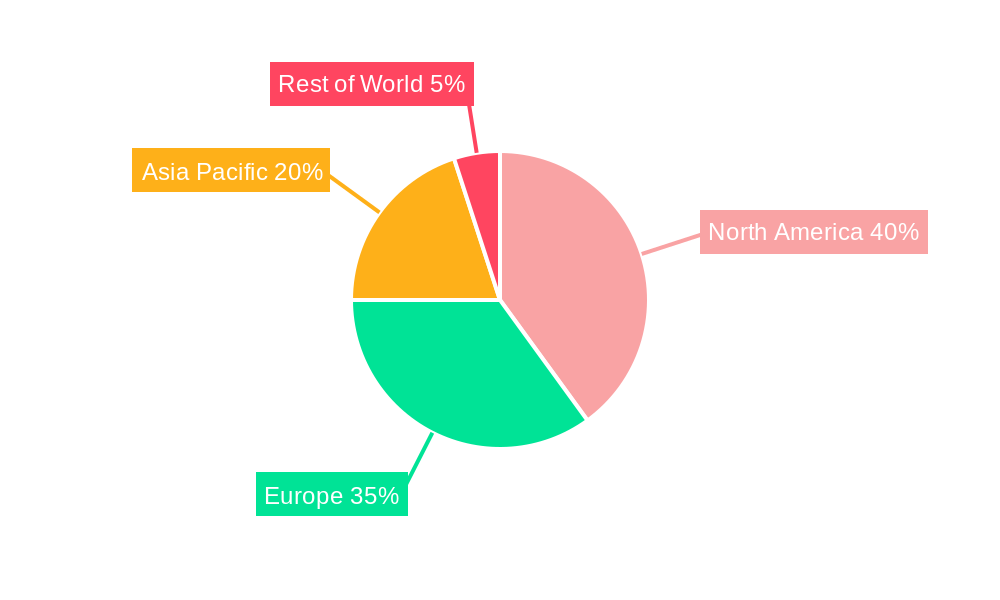
The North American region, particularly the United States, currently holds a significant market share due to early adoption of advanced technologies and a strong focus on environmental sustainability. However, rapid technological advancements and rising environmental concerns are driving growth across Europe and the Asia-Pacific region, specifically in countries like China and India, experiencing rapid urbanization and industrialization. Leading market players such as IBM, Veolia, and Waste Management are investing heavily in research and development, expanding their product portfolios, and strategic partnerships to maintain their competitive edge. The increasing adoption of cloud-based platforms and the growing focus on data analytics further contribute to the market’s expansion, empowering stakeholders to make data-driven decisions for optimal waste management strategies. The competitive landscape is characterized by both established players and emerging innovative companies, leading to increased product differentiation and intensified competition in the coming years.
Smart Waste Management Market Report: 2019-2033
This comprehensive report provides a detailed analysis of the Smart Waste Management Market, encompassing market dynamics, growth trends, regional dominance, product landscape, challenges, opportunities, and key players. With a study period spanning 2019-2033, a base year of 2025, and a forecast period of 2025-2033, this report offers invaluable insights for industry professionals, investors, and stakeholders seeking to navigate this rapidly evolving market. The report analyzes the parent market of Waste Management and the child market of Smart Waste Management Solutions, providing a holistic view of the industry landscape.
Smart Waste Management Market Market Dynamics & Structure
The Smart Waste Management market is characterized by increasing market concentration, driven by technological innovation and strategic mergers & acquisitions (M&A). The market is experiencing a significant shift towards smart solutions, fueled by growing environmental concerns and the need for efficient waste management. Regulatory frameworks, varying across regions, play a crucial role in shaping market growth and adoption.
- Market Concentration: The market exhibits moderate concentration, with a few major players holding significant market share (estimated at xx%). However, the emergence of innovative startups is challenging this established landscape.
- Technological Innovation: Advancements in IoT, AI, and data analytics are driving the adoption of smart waste management solutions. However, high initial investment costs and the need for robust infrastructure present innovation barriers.
- Regulatory Landscape: Stringent environmental regulations in developed regions are accelerating the adoption of smart waste management systems. However, inconsistencies in regulations across different countries create market fragmentation.
- Competitive Product Substitutes: Traditional waste management methods continue to compete, particularly in developing economies with limited infrastructure. However, the cost-effectiveness and efficiency advantages of smart solutions are gradually eroding this competition.
- End-User Demographics: Municipal corporations and private waste management companies are the primary end-users. The increasing urbanization and population growth are driving demand for effective waste management solutions.
- M&A Trends: The market has witnessed a rise in M&A activities in recent years, with larger companies acquiring smaller innovative firms to expand their product portfolios and market reach. The total value of M&A deals in the period 2019-2024 is estimated at xx Million.
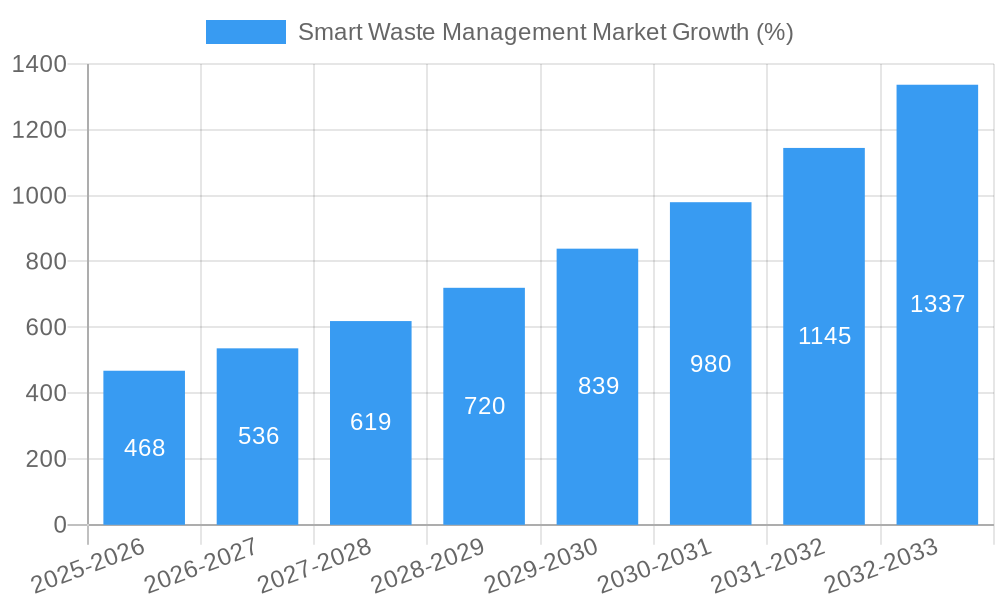
Smart Waste Management Market Growth Trends & Insights
The Smart Waste Management market is experiencing robust growth, driven by increasing urbanization, stringent environmental regulations, and technological advancements. The market size is projected to reach xx Million by 2033, exhibiting a CAGR of xx% during the forecast period (2025-2033). Adoption rates are significantly higher in developed regions compared to developing countries, driven primarily by higher awareness and access to advanced technologies. Technological disruptions such as the Internet of Things (IoT) and advanced data analytics are transforming the sector, leading to improved efficiency and reduced operational costs. Consumer behavior shifts towards environmentally conscious practices are further fueling the market's growth. The market penetration rate is projected to reach xx% by 2033.
Dominant Regions, Countries, or Segments in Smart Waste Management Market
North America and Europe currently dominate the Smart Waste Management market, driven by robust environmental regulations and high technological adoption. However, Asia-Pacific is poised for significant growth, driven by rapid urbanization and increasing investments in smart city infrastructure.
- By Waste Type: The industrial waste segment holds a larger market share than residential waste, driven by stringent regulations and the need for efficient industrial waste management.
- By Solution: Remote monitoring and analytics solutions are witnessing high adoption rates, offering real-time insights and optimizing waste collection routes. Fleet management solutions contribute significantly to operational efficiency.
- Key Drivers: Stringent environmental regulations, growing urbanization, increasing awareness of environmental sustainability, and government initiatives promoting smart city development are key growth drivers.
Smart Waste Management Market Product Landscape
The Smart Waste Management market offers a diverse range of solutions, including smart bins with fill-level sensors, intelligent routing software, and real-time monitoring systems. These solutions utilize advanced technologies such as IoT, AI, and data analytics to optimize waste collection, reduce operational costs, and improve environmental sustainability. Key features include real-time data analysis, predictive maintenance, and improved route optimization, leading to increased efficiency and reduced operational costs. Unique selling propositions include reducing waste overflow, optimizing collection routes, and enabling proactive maintenance, leading to cost savings and improved service delivery.
Key Drivers, Barriers & Challenges in Smart Waste Management Market
Key Drivers:
- Growing environmental concerns and the need for sustainable waste management practices.
- Increasing urbanization and the associated challenges of waste disposal.
- Technological advancements in IoT, AI, and data analytics.
- Government initiatives and supportive regulatory frameworks.
Challenges & Restraints:
- High initial investment costs associated with implementing smart waste management systems.
- Lack of awareness and understanding of smart waste management solutions among stakeholders.
- Integration challenges with existing waste management infrastructure.
- Data security and privacy concerns related to data collection and analysis. The estimated impact of these challenges on market growth is xx% annually.
Emerging Opportunities in Smart Waste Management Market
- Expanding into untapped markets in developing countries.
- Developing innovative solutions for specific waste types, such as hazardous waste or medical waste.
- Leveraging AI and machine learning to further optimize waste collection and recycling processes.
- Creating partnerships with municipalities and waste management companies to promote widespread adoption.
Growth Accelerators in the Smart Waste Management Market Industry
Strategic partnerships between technology providers, waste management companies, and municipal corporations are driving market expansion. Technological breakthroughs, such as advanced sensor technologies and AI-powered analytics, are continuously improving the efficiency and effectiveness of smart waste management solutions. Expanding into new geographical markets and tailoring solutions to meet specific regional needs are further accelerating market growth.
Key Players Shaping the Smart Waste Management Market Market
- IBM Corporation
- Veolia Environmental Services
- Evoeco
- Covanta Holding Corporation
- Bigbelly Inc
- Waste Management Inc
- Enevo
- Pepperl+Fuchs GmbH
- BIN-
- SAP SE
Notable Milestones in Smart Waste Management Market Sector
- July 2023: WM opened a new USD 35 million renewable natural gas plant, signifying investment in sustainable waste management technologies and creating new jobs.
- June 2023: The Indian government's support for the CITIIS 2.0 project boosts the adoption of blended waste management practices across 18 cities.
In-Depth Smart Waste Management Market Market Outlook
The Smart Waste Management market is poised for continued robust growth, driven by increasing demand for sustainable waste management solutions and technological advancements. Strategic partnerships, technological breakthroughs, and expanding into new markets will be crucial for long-term success. The market presents significant opportunities for companies to develop innovative solutions and capitalize on the growing demand for efficient and sustainable waste management practices.
Smart Waste Management Market Segmentation
-
1. Solution
- 1.1. Fleet Management
- 1.2. Remote Monitoring
- 1.3. Analytics
-
2. Waste Type
- 2.1. Industrial Waste
- 2.2. Residential Waste
Smart Waste Management Market Segmentation By Geography
-
1. North America
- 1.1. United States
- 1.2. Canada
-
2. Europe
- 2.1. Germany
- 2.2. United Kingdom
- 2.3. France
- 2.4. Spain
- 2.5. Italy
-
3. Asia
- 3.1. India
- 3.2. China
- 3.3. Australia
- 3.4. Japan
- 3.5. Australia and New Zealand
- 4. Latin America
- 5. Middle East and Africa
Smart Waste Management Market REPORT HIGHLIGHTS
| Aspects | Details |
|---|---|
| Study Period | 2019-2033 |
| Base Year | 2024 |
| Estimated Year | 2025 |
| Forecast Period | 2025-2033 |
| Historical Period | 2019-2024 |
| Growth Rate | CAGR of 15.08% from 2019-2033 |
| Segmentation |
|
Table of Contents
- 1. Introduction
- 1.1. Research Scope
- 1.2. Market Segmentation
- 1.3. Research Methodology
- 1.4. Definitions and Assumptions
- 2. Executive Summary
- 2.1. Introduction
- 3. Market Dynamics
- 3.1. Introduction
- 3.2. Market Drivers
- 3.2.1. Increasing Volumes of Waste to Boost the Market; Rising Adoption of Smart Cities to Flourish the Market
- 3.3. Market Restrains
- 3.3.1. Cybersecurity Concerns and Data Security Breaches
- 3.4. Market Trends
- 3.4.1. Analytics Sector to Witness Major Growth
- 4. Market Factor Analysis
- 4.1. Porters Five Forces
- 4.2. Supply/Value Chain
- 4.3. PESTEL analysis
- 4.4. Market Entropy
- 4.5. Patent/Trademark Analysis
- 5. Global Smart Waste Management Market Analysis, Insights and Forecast, 2019-2031
- 5.1. Market Analysis, Insights and Forecast - by Solution
- 5.1.1. Fleet Management
- 5.1.2. Remote Monitoring
- 5.1.3. Analytics
- 5.2. Market Analysis, Insights and Forecast - by Waste Type
- 5.2.1. Industrial Waste
- 5.2.2. Residential Waste
- 5.3. Market Analysis, Insights and Forecast - by Region
- 5.3.1. North America
- 5.3.2. Europe
- 5.3.3. Asia
- 5.3.4. Latin America
- 5.3.5. Middle East and Africa
- 5.1. Market Analysis, Insights and Forecast - by Solution
- 6. North America Smart Waste Management Market Analysis, Insights and Forecast, 2019-2031
- 6.1. Market Analysis, Insights and Forecast - by Solution
- 6.1.1. Fleet Management
- 6.1.2. Remote Monitoring
- 6.1.3. Analytics
- 6.2. Market Analysis, Insights and Forecast - by Waste Type
- 6.2.1. Industrial Waste
- 6.2.2. Residential Waste
- 6.1. Market Analysis, Insights and Forecast - by Solution
- 7. Europe Smart Waste Management Market Analysis, Insights and Forecast, 2019-2031
- 7.1. Market Analysis, Insights and Forecast - by Solution
- 7.1.1. Fleet Management
- 7.1.2. Remote Monitoring
- 7.1.3. Analytics
- 7.2. Market Analysis, Insights and Forecast - by Waste Type
- 7.2.1. Industrial Waste
- 7.2.2. Residential Waste
- 7.1. Market Analysis, Insights and Forecast - by Solution
- 8. Asia Smart Waste Management Market Analysis, Insights and Forecast, 2019-2031
- 8.1. Market Analysis, Insights and Forecast - by Solution
- 8.1.1. Fleet Management
- 8.1.2. Remote Monitoring
- 8.1.3. Analytics
- 8.2. Market Analysis, Insights and Forecast - by Waste Type
- 8.2.1. Industrial Waste
- 8.2.2. Residential Waste
- 8.1. Market Analysis, Insights and Forecast - by Solution
- 9. Latin America Smart Waste Management Market Analysis, Insights and Forecast, 2019-2031
- 9.1. Market Analysis, Insights and Forecast - by Solution
- 9.1.1. Fleet Management
- 9.1.2. Remote Monitoring
- 9.1.3. Analytics
- 9.2. Market Analysis, Insights and Forecast - by Waste Type
- 9.2.1. Industrial Waste
- 9.2.2. Residential Waste
- 9.1. Market Analysis, Insights and Forecast - by Solution
- 10. Middle East and Africa Smart Waste Management Market Analysis, Insights and Forecast, 2019-2031
- 10.1. Market Analysis, Insights and Forecast - by Solution
- 10.1.1. Fleet Management
- 10.1.2. Remote Monitoring
- 10.1.3. Analytics
- 10.2. Market Analysis, Insights and Forecast - by Waste Type
- 10.2.1. Industrial Waste
- 10.2.2. Residential Waste
- 10.1. Market Analysis, Insights and Forecast - by Solution
- 11. North America Smart Waste Management Market Analysis, Insights and Forecast, 2019-2031
- 11.1. Market Analysis, Insights and Forecast - By Country/Sub-region
- 11.1.1 United States
- 11.1.2 Canada
- 12. Europe Smart Waste Management Market Analysis, Insights and Forecast, 2019-2031
- 12.1. Market Analysis, Insights and Forecast - By Country/Sub-region
- 12.1.1 Germany
- 12.1.2 United Kingdom
- 12.1.3 France
- 12.1.4 Spain
- 12.1.5 Italy
- 12.1.6 Rest of Europe
- 13. Asia Pacific Smart Waste Management Market Analysis, Insights and Forecast, 2019-2031
- 13.1. Market Analysis, Insights and Forecast - By Country/Sub-region
- 13.1.1 India
- 13.1.2 China
- 13.1.3 Australia
- 13.1.4 Japan
- 13.1.5 Rest of Asia Pacific
- 14. Rest of the World Smart Waste Management Market Analysis, Insights and Forecast, 2019-2031
- 14.1. Market Analysis, Insights and Forecast - By Country/Sub-region
- 14.1.1.
- 15. Competitive Analysis
- 15.1. Global Market Share Analysis 2024
- 15.2. Company Profiles
- 15.2.1 IBM Corporation
- 15.2.1.1. Overview
- 15.2.1.2. Products
- 15.2.1.3. SWOT Analysis
- 15.2.1.4. Recent Developments
- 15.2.1.5. Financials (Based on Availability)
- 15.2.2 Veolia Environmental Services
- 15.2.2.1. Overview
- 15.2.2.2. Products
- 15.2.2.3. SWOT Analysis
- 15.2.2.4. Recent Developments
- 15.2.2.5. Financials (Based on Availability)
- 15.2.3 Evoeco
- 15.2.3.1. Overview
- 15.2.3.2. Products
- 15.2.3.3. SWOT Analysis
- 15.2.3.4. Recent Developments
- 15.2.3.5. Financials (Based on Availability)
- 15.2.4 Covanta Holding Corporation
- 15.2.4.1. Overview
- 15.2.4.2. Products
- 15.2.4.3. SWOT Analysis
- 15.2.4.4. Recent Developments
- 15.2.4.5. Financials (Based on Availability)
- 15.2.5 Bigbelly Inc
- 15.2.5.1. Overview
- 15.2.5.2. Products
- 15.2.5.3. SWOT Analysis
- 15.2.5.4. Recent Developments
- 15.2.5.5. Financials (Based on Availability)
- 15.2.6 Waste Management Inc
- 15.2.6.1. Overview
- 15.2.6.2. Products
- 15.2.6.3. SWOT Analysis
- 15.2.6.4. Recent Developments
- 15.2.6.5. Financials (Based on Availability)
- 15.2.7 Enevo
- 15.2.7.1. Overview
- 15.2.7.2. Products
- 15.2.7.3. SWOT Analysis
- 15.2.7.4. Recent Developments
- 15.2.7.5. Financials (Based on Availability)
- 15.2.8 Pepperl+Fuchs GmbH
- 15.2.8.1. Overview
- 15.2.8.2. Products
- 15.2.8.3. SWOT Analysis
- 15.2.8.4. Recent Developments
- 15.2.8.5. Financials (Based on Availability)
- 15.2.9 BIN-
- 15.2.9.1. Overview
- 15.2.9.2. Products
- 15.2.9.3. SWOT Analysis
- 15.2.9.4. Recent Developments
- 15.2.9.5. Financials (Based on Availability)
- 15.2.10 SAP SE
- 15.2.10.1. Overview
- 15.2.10.2. Products
- 15.2.10.3. SWOT Analysis
- 15.2.10.4. Recent Developments
- 15.2.10.5. Financials (Based on Availability)
- 15.2.1 IBM Corporation
List of Figures
- Figure 1: Global Smart Waste Management Market Revenue Breakdown (Million, %) by Region 2024 & 2032
- Figure 2: North America Smart Waste Management Market Revenue (Million), by Country 2024 & 2032
- Figure 3: North America Smart Waste Management Market Revenue Share (%), by Country 2024 & 2032
- Figure 4: Europe Smart Waste Management Market Revenue (Million), by Country 2024 & 2032
- Figure 5: Europe Smart Waste Management Market Revenue Share (%), by Country 2024 & 2032
- Figure 6: Asia Pacific Smart Waste Management Market Revenue (Million), by Country 2024 & 2032
- Figure 7: Asia Pacific Smart Waste Management Market Revenue Share (%), by Country 2024 & 2032
- Figure 8: Rest of the World Smart Waste Management Market Revenue (Million), by Country 2024 & 2032
- Figure 9: Rest of the World Smart Waste Management Market Revenue Share (%), by Country 2024 & 2032
- Figure 10: North America Smart Waste Management Market Revenue (Million), by Solution 2024 & 2032
- Figure 11: North America Smart Waste Management Market Revenue Share (%), by Solution 2024 & 2032
- Figure 12: North America Smart Waste Management Market Revenue (Million), by Waste Type 2024 & 2032
- Figure 13: North America Smart Waste Management Market Revenue Share (%), by Waste Type 2024 & 2032
- Figure 14: North America Smart Waste Management Market Revenue (Million), by Country 2024 & 2032
- Figure 15: North America Smart Waste Management Market Revenue Share (%), by Country 2024 & 2032
- Figure 16: Europe Smart Waste Management Market Revenue (Million), by Solution 2024 & 2032
- Figure 17: Europe Smart Waste Management Market Revenue Share (%), by Solution 2024 & 2032
- Figure 18: Europe Smart Waste Management Market Revenue (Million), by Waste Type 2024 & 2032
- Figure 19: Europe Smart Waste Management Market Revenue Share (%), by Waste Type 2024 & 2032
- Figure 20: Europe Smart Waste Management Market Revenue (Million), by Country 2024 & 2032
- Figure 21: Europe Smart Waste Management Market Revenue Share (%), by Country 2024 & 2032
- Figure 22: Asia Smart Waste Management Market Revenue (Million), by Solution 2024 & 2032
- Figure 23: Asia Smart Waste Management Market Revenue Share (%), by Solution 2024 & 2032
- Figure 24: Asia Smart Waste Management Market Revenue (Million), by Waste Type 2024 & 2032
- Figure 25: Asia Smart Waste Management Market Revenue Share (%), by Waste Type 2024 & 2032
- Figure 26: Asia Smart Waste Management Market Revenue (Million), by Country 2024 & 2032
- Figure 27: Asia Smart Waste Management Market Revenue Share (%), by Country 2024 & 2032
- Figure 28: Latin America Smart Waste Management Market Revenue (Million), by Solution 2024 & 2032
- Figure 29: Latin America Smart Waste Management Market Revenue Share (%), by Solution 2024 & 2032
- Figure 30: Latin America Smart Waste Management Market Revenue (Million), by Waste Type 2024 & 2032
- Figure 31: Latin America Smart Waste Management Market Revenue Share (%), by Waste Type 2024 & 2032
- Figure 32: Latin America Smart Waste Management Market Revenue (Million), by Country 2024 & 2032
- Figure 33: Latin America Smart Waste Management Market Revenue Share (%), by Country 2024 & 2032
- Figure 34: Middle East and Africa Smart Waste Management Market Revenue (Million), by Solution 2024 & 2032
- Figure 35: Middle East and Africa Smart Waste Management Market Revenue Share (%), by Solution 2024 & 2032
- Figure 36: Middle East and Africa Smart Waste Management Market Revenue (Million), by Waste Type 2024 & 2032
- Figure 37: Middle East and Africa Smart Waste Management Market Revenue Share (%), by Waste Type 2024 & 2032
- Figure 38: Middle East and Africa Smart Waste Management Market Revenue (Million), by Country 2024 & 2032
- Figure 39: Middle East and Africa Smart Waste Management Market Revenue Share (%), by Country 2024 & 2032
List of Tables
- Table 1: Global Smart Waste Management Market Revenue Million Forecast, by Region 2019 & 2032
- Table 2: Global Smart Waste Management Market Revenue Million Forecast, by Solution 2019 & 2032
- Table 3: Global Smart Waste Management Market Revenue Million Forecast, by Waste Type 2019 & 2032
- Table 4: Global Smart Waste Management Market Revenue Million Forecast, by Region 2019 & 2032
- Table 5: Global Smart Waste Management Market Revenue Million Forecast, by Country 2019 & 2032
- Table 6: United States Smart Waste Management Market Revenue (Million) Forecast, by Application 2019 & 2032
- Table 7: Canada Smart Waste Management Market Revenue (Million) Forecast, by Application 2019 & 2032
- Table 8: Global Smart Waste Management Market Revenue Million Forecast, by Country 2019 & 2032
- Table 9: Germany Smart Waste Management Market Revenue (Million) Forecast, by Application 2019 & 2032
- Table 10: United Kingdom Smart Waste Management Market Revenue (Million) Forecast, by Application 2019 & 2032
- Table 11: France Smart Waste Management Market Revenue (Million) Forecast, by Application 2019 & 2032
- Table 12: Spain Smart Waste Management Market Revenue (Million) Forecast, by Application 2019 & 2032
- Table 13: Italy Smart Waste Management Market Revenue (Million) Forecast, by Application 2019 & 2032
- Table 14: Rest of Europe Smart Waste Management Market Revenue (Million) Forecast, by Application 2019 & 2032
- Table 15: Global Smart Waste Management Market Revenue Million Forecast, by Country 2019 & 2032
- Table 16: India Smart Waste Management Market Revenue (Million) Forecast, by Application 2019 & 2032
- Table 17: China Smart Waste Management Market Revenue (Million) Forecast, by Application 2019 & 2032
- Table 18: Australia Smart Waste Management Market Revenue (Million) Forecast, by Application 2019 & 2032
- Table 19: Japan Smart Waste Management Market Revenue (Million) Forecast, by Application 2019 & 2032
- Table 20: Rest of Asia Pacific Smart Waste Management Market Revenue (Million) Forecast, by Application 2019 & 2032
- Table 21: Global Smart Waste Management Market Revenue Million Forecast, by Country 2019 & 2032
- Table 22: Smart Waste Management Market Revenue (Million) Forecast, by Application 2019 & 2032
- Table 23: Global Smart Waste Management Market Revenue Million Forecast, by Solution 2019 & 2032
- Table 24: Global Smart Waste Management Market Revenue Million Forecast, by Waste Type 2019 & 2032
- Table 25: Global Smart Waste Management Market Revenue Million Forecast, by Country 2019 & 2032
- Table 26: United States Smart Waste Management Market Revenue (Million) Forecast, by Application 2019 & 2032
- Table 27: Canada Smart Waste Management Market Revenue (Million) Forecast, by Application 2019 & 2032
- Table 28: Global Smart Waste Management Market Revenue Million Forecast, by Solution 2019 & 2032
- Table 29: Global Smart Waste Management Market Revenue Million Forecast, by Waste Type 2019 & 2032
- Table 30: Global Smart Waste Management Market Revenue Million Forecast, by Country 2019 & 2032
- Table 31: Germany Smart Waste Management Market Revenue (Million) Forecast, by Application 2019 & 2032
- Table 32: United Kingdom Smart Waste Management Market Revenue (Million) Forecast, by Application 2019 & 2032
- Table 33: France Smart Waste Management Market Revenue (Million) Forecast, by Application 2019 & 2032
- Table 34: Spain Smart Waste Management Market Revenue (Million) Forecast, by Application 2019 & 2032
- Table 35: Italy Smart Waste Management Market Revenue (Million) Forecast, by Application 2019 & 2032
- Table 36: Global Smart Waste Management Market Revenue Million Forecast, by Solution 2019 & 2032
- Table 37: Global Smart Waste Management Market Revenue Million Forecast, by Waste Type 2019 & 2032
- Table 38: Global Smart Waste Management Market Revenue Million Forecast, by Country 2019 & 2032
- Table 39: India Smart Waste Management Market Revenue (Million) Forecast, by Application 2019 & 2032
- Table 40: China Smart Waste Management Market Revenue (Million) Forecast, by Application 2019 & 2032
- Table 41: Australia Smart Waste Management Market Revenue (Million) Forecast, by Application 2019 & 2032
- Table 42: Japan Smart Waste Management Market Revenue (Million) Forecast, by Application 2019 & 2032
- Table 43: Australia and New Zealand Smart Waste Management Market Revenue (Million) Forecast, by Application 2019 & 2032
- Table 44: Global Smart Waste Management Market Revenue Million Forecast, by Solution 2019 & 2032
- Table 45: Global Smart Waste Management Market Revenue Million Forecast, by Waste Type 2019 & 2032
- Table 46: Global Smart Waste Management Market Revenue Million Forecast, by Country 2019 & 2032
- Table 47: Global Smart Waste Management Market Revenue Million Forecast, by Solution 2019 & 2032
- Table 48: Global Smart Waste Management Market Revenue Million Forecast, by Waste Type 2019 & 2032
- Table 49: Global Smart Waste Management Market Revenue Million Forecast, by Country 2019 & 2032
Frequently Asked Questions
1. What is the projected Compound Annual Growth Rate (CAGR) of the Smart Waste Management Market?
The projected CAGR is approximately 15.08%.
2. Which companies are prominent players in the Smart Waste Management Market?
Key companies in the market include IBM Corporation, Veolia Environmental Services, Evoeco, Covanta Holding Corporation, Bigbelly Inc, Waste Management Inc, Enevo, Pepperl+Fuchs GmbH, BIN-, SAP SE.
3. What are the main segments of the Smart Waste Management Market?
The market segments include Solution, Waste Type.
4. Can you provide details about the market size?
The market size is estimated to be USD 3.08 Million as of 2022.
5. What are some drivers contributing to market growth?
Increasing Volumes of Waste to Boost the Market; Rising Adoption of Smart Cities to Flourish the Market.
6. What are the notable trends driving market growth?
Analytics Sector to Witness Major Growth.
7. Are there any restraints impacting market growth?
Cybersecurity Concerns and Data Security Breaches.
8. Can you provide examples of recent developments in the market?
July 2023 - WM began operations at its new USD 35 million, 14,500 square foot renewable natural gas plant located at the Texas-based company’s Eco Vista landfill, the company said in a news release. Construction on the new facility began two years ago, and the company plans to employ 125 construction workers and four workers to manage the facility, which will have a capacity of 14,500 square feet. The company said the new facility is expected to be fully operational by the end of May.
9. What pricing options are available for accessing the report?
Pricing options include single-user, multi-user, and enterprise licenses priced at USD 4750, USD 5250, and USD 8750 respectively.
10. Is the market size provided in terms of value or volume?
The market size is provided in terms of value, measured in Million.
11. Are there any specific market keywords associated with the report?
Yes, the market keyword associated with the report is "Smart Waste Management Market," which aids in identifying and referencing the specific market segment covered.
12. How do I determine which pricing option suits my needs best?
The pricing options vary based on user requirements and access needs. Individual users may opt for single-user licenses, while businesses requiring broader access may choose multi-user or enterprise licenses for cost-effective access to the report.
13. Are there any additional resources or data provided in the Smart Waste Management Market report?
While the report offers comprehensive insights, it's advisable to review the specific contents or supplementary materials provided to ascertain if additional resources or data are available.
14. How can I stay updated on further developments or reports in the Smart Waste Management Market?
To stay informed about further developments, trends, and reports in the Smart Waste Management Market, consider subscribing to industry newsletters, following relevant companies and organizations, or regularly checking reputable industry news sources and publications.
Methodology
Step 1 - Identification of Relevant Samples Size from Population Database


Step 2 - Approaches for Defining Global Market Size (Value, Volume* & Price*)

Note*: In applicable scenarios
Step 3 - Data Sources
Primary Research
- Web Analytics
- Survey Reports
- Research Institute
- Latest Research Reports
- Opinion Leaders
Secondary Research
- Annual Reports
- White Paper
- Latest Press Release
- Industry Association
- Paid Database
- Investor Presentations

Step 4 - Data Triangulation
Involves using different sources of information in order to increase the validity of a study
These sources are likely to be stakeholders in a program - participants, other researchers, program staff, other community members, and so on.
Then we put all data in single framework & apply various statistical tools to find out the dynamic on the market.
During the analysis stage, feedback from the stakeholder groups would be compared to determine areas of agreement as well as areas of divergence
