

Key Insights
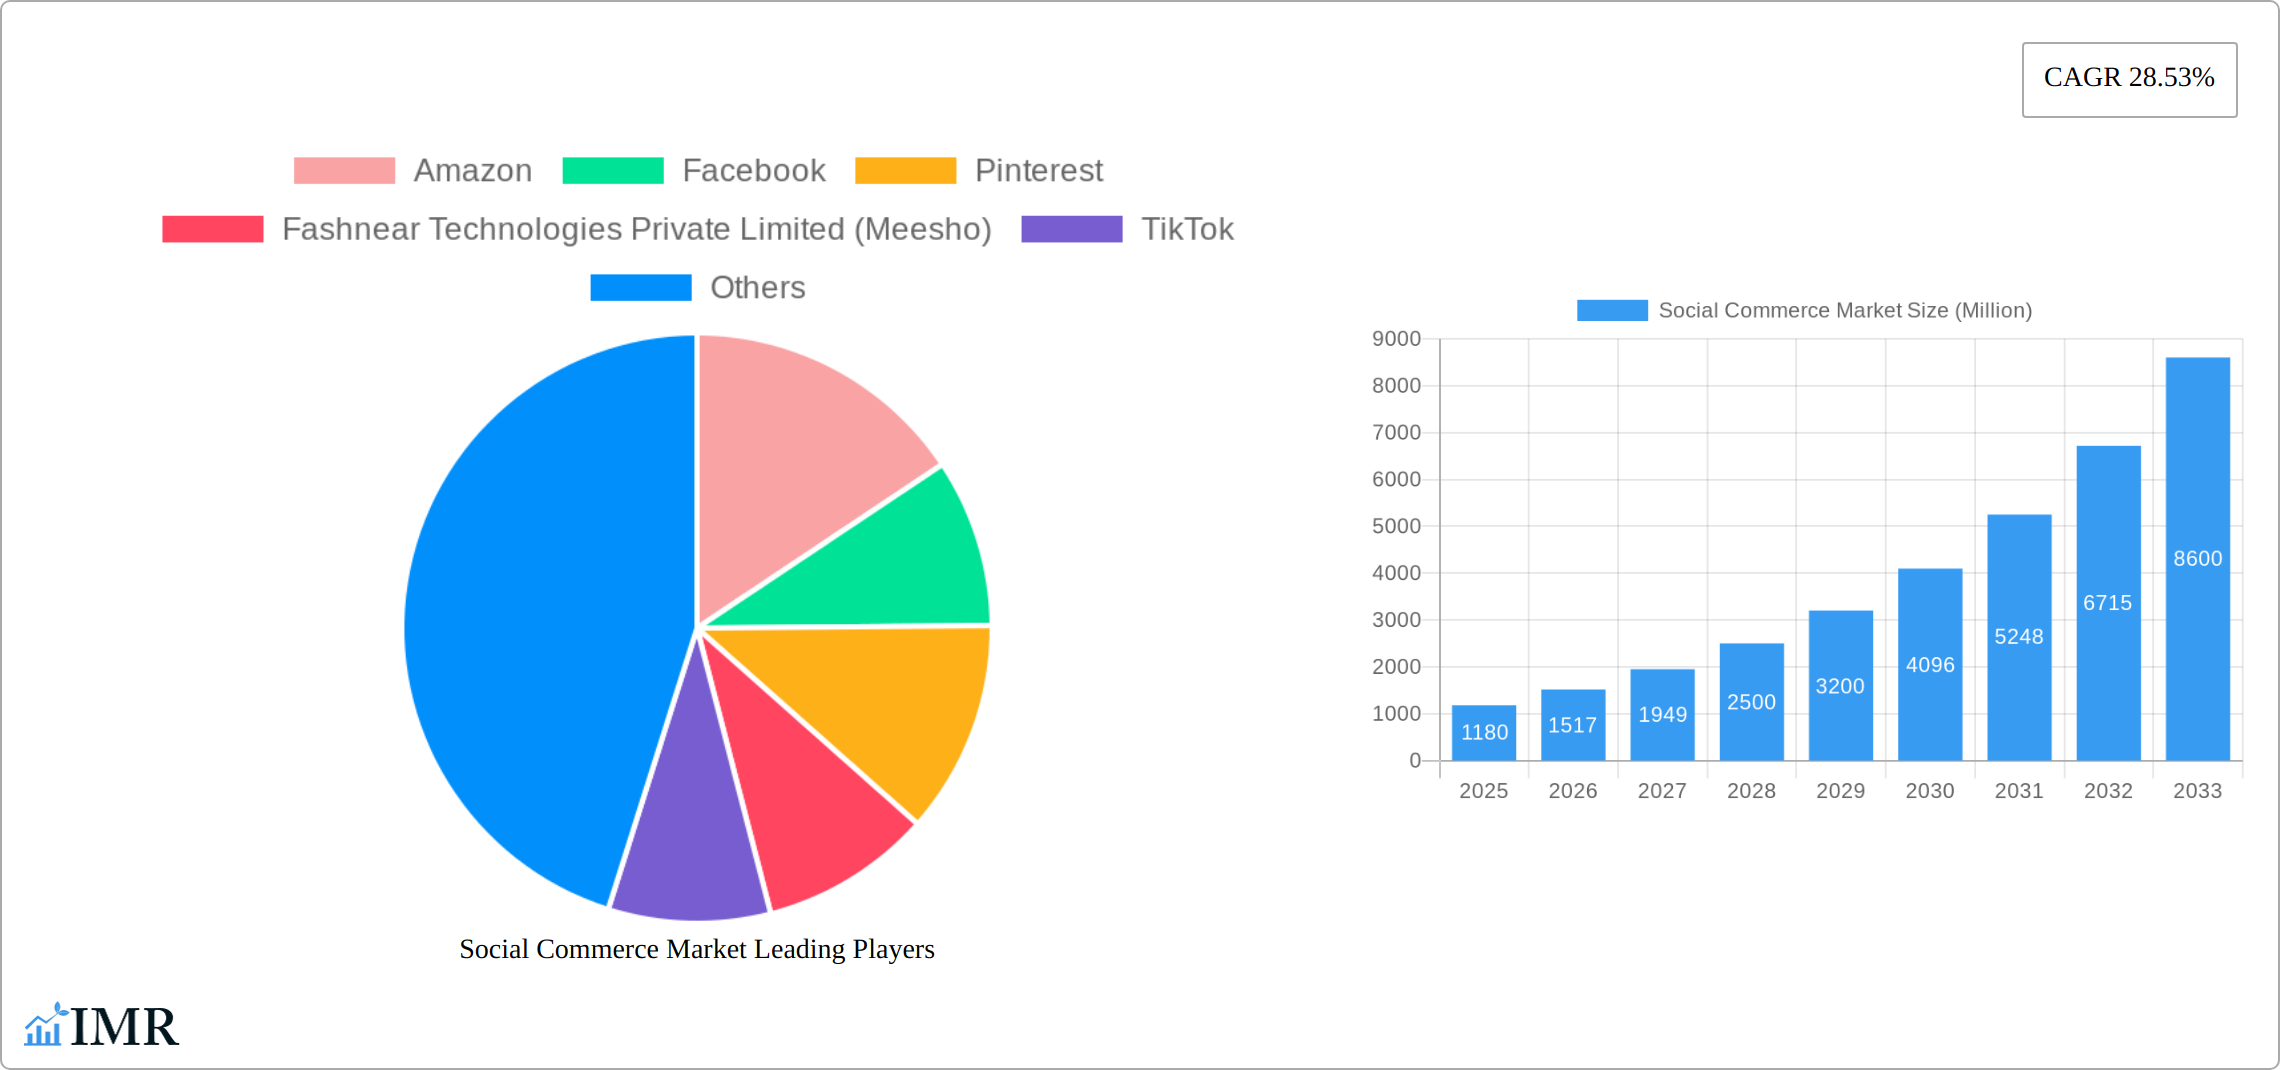
The social commerce market, valued at $1.18 billion in 2025, is experiencing explosive growth, projected to expand at a Compound Annual Growth Rate (CAGR) of 28.53% from 2025 to 2033. This surge is driven by several key factors. The increasing penetration of smartphones and social media platforms, particularly among younger demographics, creates a fertile ground for businesses to connect directly with consumers. The convenience and personalized experience offered by social commerce platforms, which seamlessly integrate browsing, purchasing, and social interaction, are major attractors. Furthermore, the rise of influencer marketing and user-generated content fuels trust and brand awareness, driving sales. The diverse range of product categories available, from personal care and apparel to home goods and health supplements, caters to a broad consumer base, contributing to the market's expansion. Different business models, including B2C, B2B, and C2C, further enhance market reach and cater to diverse needs. Growth is fueled by innovative sales channels like video commerce, social network-led commerce, and social reselling, which provide engaging and interactive shopping experiences.
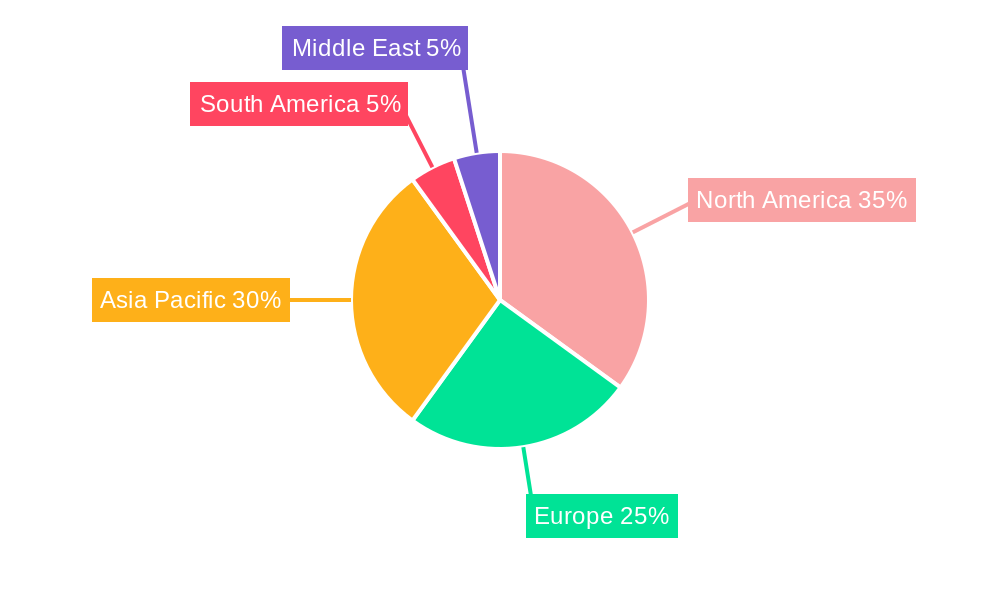
Despite the robust growth, the social commerce market faces certain challenges. Maintaining consumer trust and addressing concerns about data privacy and security is paramount. Competition among established players and new entrants necessitates continuous innovation and adaptation. Furthermore, managing logistics and ensuring seamless delivery across diverse regions pose logistical complexities. Overcoming these hurdles will be crucial for sustained growth. The market is geographically diverse, with North America and Asia Pacific expected to be key regions driving growth, given their high social media penetration and e-commerce adoption. The continued development of advanced technologies, like augmented reality (AR) and virtual reality (VR), for enhanced shopping experiences, will further shape the future of social commerce.
Social Commerce Market: A Comprehensive Report (2019-2033)
This comprehensive report provides an in-depth analysis of the global social commerce market, encompassing market dynamics, growth trends, dominant segments, product landscape, key players, and future outlook. With a study period spanning 2019-2033, a base year of 2025, and a forecast period of 2025-2033, this report offers invaluable insights for businesses, investors, and industry professionals seeking to navigate this rapidly evolving market. The report analyzes the parent market of e-commerce and its child market, social commerce, providing a detailed view of its various segments. The market size is projected to reach xx Million by 2033.
Social Commerce Market Dynamics & Structure
The social commerce market is characterized by high dynamism, driven by technological innovation, evolving consumer preferences, and strategic partnerships. Market concentration is moderate, with key players like Amazon, Facebook, and Pinterest holding significant shares, but also witnessing the emergence of smaller, agile companies like Meesho (Fashnear Technologies Private Limited) and Roposo. Technological advancements, particularly in areas such as live streaming, AR/VR, and AI-powered personalization, are continuously reshaping the landscape. Regulatory frameworks concerning data privacy and consumer protection play a significant role. The competitive landscape is marked by both cooperation and competition, as evidenced by recent strategic partnerships and acquisitions.
- Market Concentration: Moderate, with top players holding xx% market share in 2025.
- Technological Innovation: Rapid advancements in AI, AR/VR, and live-streaming drive market growth.
- Regulatory Framework: Data privacy regulations and consumer protection laws impact market operations.
- Competitive Substitutes: Traditional e-commerce platforms and physical retail stores.
- End-User Demographics: Millennials and Gen Z are key demographics driving market adoption.
- M&A Trends: Strategic partnerships and acquisitions are common, signifying market consolidation. The volume of M&A deals in the social commerce sector reached xx in 2024.
Social Commerce Market Growth Trends & Insights
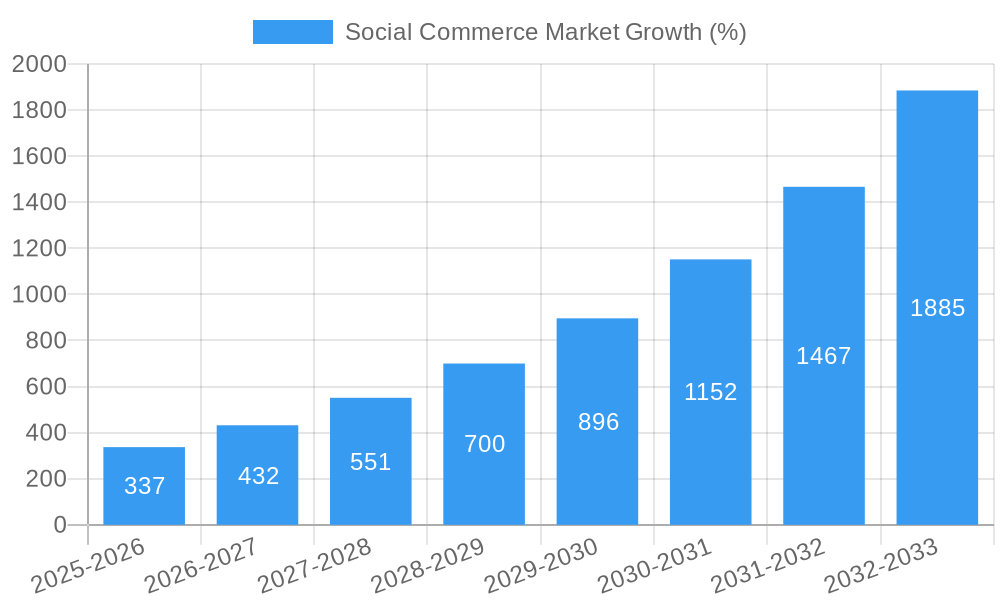
The global social commerce market has experienced substantial growth during the historical period (2019-2024), fueled by increasing smartphone penetration, widespread social media usage, and the rise of influencer marketing. The market size is estimated to be xx Million in 2025, exhibiting a Compound Annual Growth Rate (CAGR) of xx% during the forecast period (2025-2033). This growth is driven by factors such as enhanced user experience, seamless integration of social media and e-commerce platforms, and the growing preference for convenient and personalized shopping experiences. Technological disruptions, such as the introduction of short-form video shopping and the expansion of live commerce, are accelerating market adoption. Consumer behavior shifts towards mobile-first shopping and social interaction are also key drivers. Market penetration is expected to reach xx% by 2033.
Dominant Regions, Countries, or Segments in Social Commerce Market
North America and Asia-Pacific are currently leading the social commerce market, driven by high internet penetration, a large social media user base, and a favorable regulatory environment. Within these regions, specific countries like the USA, China, and India are showing exceptionally strong growth. Regarding segments:
- By Business Model: B2C dominates the market, accounting for xx% of the total market value in 2025, followed by C2C and B2B.
- By Product Type: Apparel, personal and beauty care, and accessories are the leading product categories, driven by high demand and visual appeal.
- By Sales Channel: Social network-led commerce and video commerce are the most popular sales channels, contributing xx% and xx% to total market revenue in 2025, respectively.
Key drivers for growth in these segments include favorable economic policies, robust digital infrastructure, and the increasing adoption of mobile commerce.
Social Commerce Market Product Landscape
The social commerce product landscape is dynamic, with continuous innovations in product features, functionalities, and user interfaces. Key innovations include integration of augmented reality (AR) and virtual reality (VR) technologies for enhanced product visualization, personalized recommendations powered by AI, and seamless checkout processes. The focus is on enhancing user experience and providing personalized shopping experiences.
Key Drivers, Barriers & Challenges in Social Commerce Market
Key Drivers:
- Increasing smartphone penetration and internet usage.
- Rise of influencer marketing and social media advertising.
- Enhanced user experience and seamless integration of e-commerce and social media platforms.
Challenges & Restraints:
- Data privacy concerns and regulatory hurdles.
- Competition from established e-commerce platforms.
- Supply chain disruptions and logistics challenges (impact: xx% reduction in sales in certain regions).
Emerging Opportunities in Social Commerce Market
- Untapped markets in developing economies.
- Expansion of live commerce and short-form video shopping.
- Integration of social commerce with other emerging technologies like blockchain and metaverse.
Growth Accelerators in the Social Commerce Market Industry
Strategic partnerships between social media platforms and e-commerce giants, such as the Amazon-Meta collaboration, are significantly accelerating market growth. Technological advancements in AI, AR/VR, and live-streaming will continue to drive innovation and adoption. Expansion into new markets and product categories will also contribute to long-term growth.
Key Players Shaping the Social Commerce Market Market
- Amazon
- Meesho (Fashnear Technologies Private Limited)
- TikTok
- YouTube
- Roposo
- Verint
Notable Milestones in Social Commerce Market Sector
- December 2022: Amazon launched "Inspire," a short-form video shopping feed, boosting user engagement and driving sales.
- April 2023: Amazon and Pinterest partnered to make every Pinterest pin shoppable, expanding reach and driving traffic.
- November 2023: Amazon and Meta (Facebook) partnered to integrate their platforms, creating a seamless shopping experience.
In-Depth Social Commerce Market Market Outlook
The future of social commerce is bright, with significant growth potential driven by continuous technological advancements, strategic partnerships, and evolving consumer preferences. The market is poised to witness further consolidation, with larger players expanding their capabilities and smaller players focusing on niche segments. The focus on personalization, seamless user experiences, and innovative sales channels will remain crucial for success in this dynamic market.
Social Commerce Market Segmentation
-
1. Business Model
- 1.1. Business to Consumer (B2C)
- 1.2. Business to Business (B2B)
- 1.3. Consumer to Consumer (C2C)
-
2. Product Type
- 2.1. Personal and Beauty Care
- 2.2. Apparel
- 2.3. Accessories
- 2.4. Home Products
- 2.5. Health Supplements
- 2.6. Food and Beverages
- 2.7. Other Product Types
-
3. Sales Channel
- 3.1. Video Commerce
- 3.2. Social Network-Led Commerce
- 3.3. Social Reselling
- 3.4. Group Buying
- 3.5. Product Review Platforms
Social Commerce Market Segmentation By Geography
-
1. North America
- 1.1. United States
- 1.2. Canada
- 1.3. Mexico
- 1.4. Rest of North America
-
2. Europe
- 2.1. United Kingdom
- 2.2. Germany
- 2.3. France
- 2.4. Russia
- 2.5. Italy
- 2.6. Spain
- 2.7. Rest of Europe
-
3. Asia Pacific
- 3.1. India
- 3.2. China
- 3.3. Japan
- 3.4. Australia
- 3.5. Rest of Asia Pacific
-
4. South America
- 4.1. Brazil
- 4.2. Argentina
- 4.3. Rest of South America
- 5. Middle East
-
6. United Arab Emirates
- 6.1. South Africa
- 6.2. Rest of Middle East
Social Commerce Market REPORT HIGHLIGHTS
| Aspects | Details |
|---|---|
| Study Period | 2019-2033 |
| Base Year | 2024 |
| Estimated Year | 2025 |
| Forecast Period | 2025-2033 |
| Historical Period | 2019-2024 |
| Growth Rate | CAGR of 28.53% from 2019-2033 |
| Segmentation |
|
Table of Contents
- 1. Introduction
- 1.1. Research Scope
- 1.2. Market Segmentation
- 1.3. Research Methodology
- 1.4. Definitions and Assumptions
- 2. Executive Summary
- 2.1. Introduction
- 3. Market Dynamics
- 3.1. Introduction
- 3.2. Market Drivers
- 3.2.1. Growing Number of Social Media Platforms; Shift in Consumer Preferences Toward Online Purchase
- 3.3. Market Restrains
- 3.3.1. Privacy Concerns Over Gathering and Using Personal Data; Intense Competition in the Social Commerce Space
- 3.4. Market Trends
- 3.4.1. Growing demand for business-to-consumer (B2C) social commerce is driving the market growth
- 4. Market Factor Analysis
- 4.1. Porters Five Forces
- 4.2. Supply/Value Chain
- 4.3. PESTEL analysis
- 4.4. Market Entropy
- 4.5. Patent/Trademark Analysis
- 5. Global Social Commerce Market Analysis, Insights and Forecast, 2019-2031
- 5.1. Market Analysis, Insights and Forecast - by Business Model
- 5.1.1. Business to Consumer (B2C)
- 5.1.2. Business to Business (B2B)
- 5.1.3. Consumer to Consumer (C2C)
- 5.2. Market Analysis, Insights and Forecast - by Product Type
- 5.2.1. Personal and Beauty Care
- 5.2.2. Apparel
- 5.2.3. Accessories
- 5.2.4. Home Products
- 5.2.5. Health Supplements
- 5.2.6. Food and Beverages
- 5.2.7. Other Product Types
- 5.3. Market Analysis, Insights and Forecast - by Sales Channel
- 5.3.1. Video Commerce
- 5.3.2. Social Network-Led Commerce
- 5.3.3. Social Reselling
- 5.3.4. Group Buying
- 5.3.5. Product Review Platforms
- 5.4. Market Analysis, Insights and Forecast - by Region
- 5.4.1. North America
- 5.4.2. Europe
- 5.4.3. Asia Pacific
- 5.4.4. South America
- 5.4.5. Middle East
- 5.4.6. United Arab Emirates
- 5.1. Market Analysis, Insights and Forecast - by Business Model
- 6. North America Social Commerce Market Analysis, Insights and Forecast, 2019-2031
- 6.1. Market Analysis, Insights and Forecast - by Business Model
- 6.1.1. Business to Consumer (B2C)
- 6.1.2. Business to Business (B2B)
- 6.1.3. Consumer to Consumer (C2C)
- 6.2. Market Analysis, Insights and Forecast - by Product Type
- 6.2.1. Personal and Beauty Care
- 6.2.2. Apparel
- 6.2.3. Accessories
- 6.2.4. Home Products
- 6.2.5. Health Supplements
- 6.2.6. Food and Beverages
- 6.2.7. Other Product Types
- 6.3. Market Analysis, Insights and Forecast - by Sales Channel
- 6.3.1. Video Commerce
- 6.3.2. Social Network-Led Commerce
- 6.3.3. Social Reselling
- 6.3.4. Group Buying
- 6.3.5. Product Review Platforms
- 6.1. Market Analysis, Insights and Forecast - by Business Model
- 7. Europe Social Commerce Market Analysis, Insights and Forecast, 2019-2031
- 7.1. Market Analysis, Insights and Forecast - by Business Model
- 7.1.1. Business to Consumer (B2C)
- 7.1.2. Business to Business (B2B)
- 7.1.3. Consumer to Consumer (C2C)
- 7.2. Market Analysis, Insights and Forecast - by Product Type
- 7.2.1. Personal and Beauty Care
- 7.2.2. Apparel
- 7.2.3. Accessories
- 7.2.4. Home Products
- 7.2.5. Health Supplements
- 7.2.6. Food and Beverages
- 7.2.7. Other Product Types
- 7.3. Market Analysis, Insights and Forecast - by Sales Channel
- 7.3.1. Video Commerce
- 7.3.2. Social Network-Led Commerce
- 7.3.3. Social Reselling
- 7.3.4. Group Buying
- 7.3.5. Product Review Platforms
- 7.1. Market Analysis, Insights and Forecast - by Business Model
- 8. Asia Pacific Social Commerce Market Analysis, Insights and Forecast, 2019-2031
- 8.1. Market Analysis, Insights and Forecast - by Business Model
- 8.1.1. Business to Consumer (B2C)
- 8.1.2. Business to Business (B2B)
- 8.1.3. Consumer to Consumer (C2C)
- 8.2. Market Analysis, Insights and Forecast - by Product Type
- 8.2.1. Personal and Beauty Care
- 8.2.2. Apparel
- 8.2.3. Accessories
- 8.2.4. Home Products
- 8.2.5. Health Supplements
- 8.2.6. Food and Beverages
- 8.2.7. Other Product Types
- 8.3. Market Analysis, Insights and Forecast - by Sales Channel
- 8.3.1. Video Commerce
- 8.3.2. Social Network-Led Commerce
- 8.3.3. Social Reselling
- 8.3.4. Group Buying
- 8.3.5. Product Review Platforms
- 8.1. Market Analysis, Insights and Forecast - by Business Model
- 9. South America Social Commerce Market Analysis, Insights and Forecast, 2019-2031
- 9.1. Market Analysis, Insights and Forecast - by Business Model
- 9.1.1. Business to Consumer (B2C)
- 9.1.2. Business to Business (B2B)
- 9.1.3. Consumer to Consumer (C2C)
- 9.2. Market Analysis, Insights and Forecast - by Product Type
- 9.2.1. Personal and Beauty Care
- 9.2.2. Apparel
- 9.2.3. Accessories
- 9.2.4. Home Products
- 9.2.5. Health Supplements
- 9.2.6. Food and Beverages
- 9.2.7. Other Product Types
- 9.3. Market Analysis, Insights and Forecast - by Sales Channel
- 9.3.1. Video Commerce
- 9.3.2. Social Network-Led Commerce
- 9.3.3. Social Reselling
- 9.3.4. Group Buying
- 9.3.5. Product Review Platforms
- 9.1. Market Analysis, Insights and Forecast - by Business Model
- 10. Middle East Social Commerce Market Analysis, Insights and Forecast, 2019-2031
- 10.1. Market Analysis, Insights and Forecast - by Business Model
- 10.1.1. Business to Consumer (B2C)
- 10.1.2. Business to Business (B2B)
- 10.1.3. Consumer to Consumer (C2C)
- 10.2. Market Analysis, Insights and Forecast - by Product Type
- 10.2.1. Personal and Beauty Care
- 10.2.2. Apparel
- 10.2.3. Accessories
- 10.2.4. Home Products
- 10.2.5. Health Supplements
- 10.2.6. Food and Beverages
- 10.2.7. Other Product Types
- 10.3. Market Analysis, Insights and Forecast - by Sales Channel
- 10.3.1. Video Commerce
- 10.3.2. Social Network-Led Commerce
- 10.3.3. Social Reselling
- 10.3.4. Group Buying
- 10.3.5. Product Review Platforms
- 10.1. Market Analysis, Insights and Forecast - by Business Model
- 11. United Arab Emirates Social Commerce Market Analysis, Insights and Forecast, 2019-2031
- 11.1. Market Analysis, Insights and Forecast - by Business Model
- 11.1.1. Business to Consumer (B2C)
- 11.1.2. Business to Business (B2B)
- 11.1.3. Consumer to Consumer (C2C)
- 11.2. Market Analysis, Insights and Forecast - by Product Type
- 11.2.1. Personal and Beauty Care
- 11.2.2. Apparel
- 11.2.3. Accessories
- 11.2.4. Home Products
- 11.2.5. Health Supplements
- 11.2.6. Food and Beverages
- 11.2.7. Other Product Types
- 11.3. Market Analysis, Insights and Forecast - by Sales Channel
- 11.3.1. Video Commerce
- 11.3.2. Social Network-Led Commerce
- 11.3.3. Social Reselling
- 11.3.4. Group Buying
- 11.3.5. Product Review Platforms
- 11.1. Market Analysis, Insights and Forecast - by Business Model
- 12. North America Social Commerce Market Analysis, Insights and Forecast, 2019-2031
- 12.1. Market Analysis, Insights and Forecast - By Country/Sub-region
- 12.1.1 United States
- 12.1.2 Canada
- 12.1.3 Mexico
- 12.1.4 Rest of North America
- 13. Europe Social Commerce Market Analysis, Insights and Forecast, 2019-2031
- 13.1. Market Analysis, Insights and Forecast - By Country/Sub-region
- 13.1.1 United Kingdom
- 13.1.2 Germany
- 13.1.3 France
- 13.1.4 Russia
- 13.1.5 Italy
- 13.1.6 Spain
- 13.1.7 Rest of Europe
- 14. Asia Pacific Social Commerce Market Analysis, Insights and Forecast, 2019-2031
- 14.1. Market Analysis, Insights and Forecast - By Country/Sub-region
- 14.1.1 India
- 14.1.2 China
- 14.1.3 Japan
- 14.1.4 Australia
- 14.1.5 Rest of Asia Pacific
- 15. South America Social Commerce Market Analysis, Insights and Forecast, 2019-2031
- 15.1. Market Analysis, Insights and Forecast - By Country/Sub-region
- 15.1.1 Brazil
- 15.1.2 Argentina
- 15.1.3 Rest of South America
- 16. Middle East Social Commerce Market Analysis, Insights and Forecast, 2019-2031
- 16.1. Market Analysis, Insights and Forecast - By Country/Sub-region
- 16.1.1.
- 17. United Arab Emirates Social Commerce Market Analysis, Insights and Forecast, 2019-2031
- 17.1. Market Analysis, Insights and Forecast - By Country/Sub-region
- 17.1.1 South Africa
- 17.1.2 Rest of Middle East
- 18. Competitive Analysis
- 18.1. Global Market Share Analysis 2024
- 18.2. Company Profiles
- 18.2.1 Amazon
- 18.2.1.1. Overview
- 18.2.1.2. Products
- 18.2.1.3. SWOT Analysis
- 18.2.1.4. Recent Developments
- 18.2.1.5. Financials (Based on Availability)
- 18.2.2 Facebook
- 18.2.2.1. Overview
- 18.2.2.2. Products
- 18.2.2.3. SWOT Analysis
- 18.2.2.4. Recent Developments
- 18.2.2.5. Financials (Based on Availability)
- 18.2.3 Pinterest
- 18.2.3.1. Overview
- 18.2.3.2. Products
- 18.2.3.3. SWOT Analysis
- 18.2.3.4. Recent Developments
- 18.2.3.5. Financials (Based on Availability)
- 18.2.4 Fashnear Technologies Private Limited (Meesho)
- 18.2.4.1. Overview
- 18.2.4.2. Products
- 18.2.4.3. SWOT Analysis
- 18.2.4.4. Recent Developments
- 18.2.4.5. Financials (Based on Availability)
- 18.2.5 TikTok
- 18.2.5.1. Overview
- 18.2.5.2. Products
- 18.2.5.3. SWOT Analysis
- 18.2.5.4. Recent Developments
- 18.2.5.5. Financials (Based on Availability)
- 18.2.6 Instagram
- 18.2.6.1. Overview
- 18.2.6.2. Products
- 18.2.6.3. SWOT Analysis
- 18.2.6.4. Recent Developments
- 18.2.6.5. Financials (Based on Availability)
- 18.2.7 Twitter**List Not Exhaustive
- 18.2.7.1. Overview
- 18.2.7.2. Products
- 18.2.7.3. SWOT Analysis
- 18.2.7.4. Recent Developments
- 18.2.7.5. Financials (Based on Availability)
- 18.2.8 YouTube
- 18.2.8.1. Overview
- 18.2.8.2. Products
- 18.2.8.3. SWOT Analysis
- 18.2.8.4. Recent Developments
- 18.2.8.5. Financials (Based on Availability)
- 18.2.9 Roposo
- 18.2.9.1. Overview
- 18.2.9.2. Products
- 18.2.9.3. SWOT Analysis
- 18.2.9.4. Recent Developments
- 18.2.9.5. Financials (Based on Availability)
- 18.2.10 Verint
- 18.2.10.1. Overview
- 18.2.10.2. Products
- 18.2.10.3. SWOT Analysis
- 18.2.10.4. Recent Developments
- 18.2.10.5. Financials (Based on Availability)
- 18.2.1 Amazon
List of Figures
- Figure 1: Global Social Commerce Market Revenue Breakdown (Million, %) by Region 2024 & 2032
- Figure 2: North America Social Commerce Market Revenue (Million), by Country 2024 & 2032
- Figure 3: North America Social Commerce Market Revenue Share (%), by Country 2024 & 2032
- Figure 4: Europe Social Commerce Market Revenue (Million), by Country 2024 & 2032
- Figure 5: Europe Social Commerce Market Revenue Share (%), by Country 2024 & 2032
- Figure 6: Asia Pacific Social Commerce Market Revenue (Million), by Country 2024 & 2032
- Figure 7: Asia Pacific Social Commerce Market Revenue Share (%), by Country 2024 & 2032
- Figure 8: South America Social Commerce Market Revenue (Million), by Country 2024 & 2032
- Figure 9: South America Social Commerce Market Revenue Share (%), by Country 2024 & 2032
- Figure 10: Middle East Social Commerce Market Revenue (Million), by Country 2024 & 2032
- Figure 11: Middle East Social Commerce Market Revenue Share (%), by Country 2024 & 2032
- Figure 12: United Arab Emirates Social Commerce Market Revenue (Million), by Country 2024 & 2032
- Figure 13: United Arab Emirates Social Commerce Market Revenue Share (%), by Country 2024 & 2032
- Figure 14: North America Social Commerce Market Revenue (Million), by Business Model 2024 & 2032
- Figure 15: North America Social Commerce Market Revenue Share (%), by Business Model 2024 & 2032
- Figure 16: North America Social Commerce Market Revenue (Million), by Product Type 2024 & 2032
- Figure 17: North America Social Commerce Market Revenue Share (%), by Product Type 2024 & 2032
- Figure 18: North America Social Commerce Market Revenue (Million), by Sales Channel 2024 & 2032
- Figure 19: North America Social Commerce Market Revenue Share (%), by Sales Channel 2024 & 2032
- Figure 20: North America Social Commerce Market Revenue (Million), by Country 2024 & 2032
- Figure 21: North America Social Commerce Market Revenue Share (%), by Country 2024 & 2032
- Figure 22: Europe Social Commerce Market Revenue (Million), by Business Model 2024 & 2032
- Figure 23: Europe Social Commerce Market Revenue Share (%), by Business Model 2024 & 2032
- Figure 24: Europe Social Commerce Market Revenue (Million), by Product Type 2024 & 2032
- Figure 25: Europe Social Commerce Market Revenue Share (%), by Product Type 2024 & 2032
- Figure 26: Europe Social Commerce Market Revenue (Million), by Sales Channel 2024 & 2032
- Figure 27: Europe Social Commerce Market Revenue Share (%), by Sales Channel 2024 & 2032
- Figure 28: Europe Social Commerce Market Revenue (Million), by Country 2024 & 2032
- Figure 29: Europe Social Commerce Market Revenue Share (%), by Country 2024 & 2032
- Figure 30: Asia Pacific Social Commerce Market Revenue (Million), by Business Model 2024 & 2032
- Figure 31: Asia Pacific Social Commerce Market Revenue Share (%), by Business Model 2024 & 2032
- Figure 32: Asia Pacific Social Commerce Market Revenue (Million), by Product Type 2024 & 2032
- Figure 33: Asia Pacific Social Commerce Market Revenue Share (%), by Product Type 2024 & 2032
- Figure 34: Asia Pacific Social Commerce Market Revenue (Million), by Sales Channel 2024 & 2032
- Figure 35: Asia Pacific Social Commerce Market Revenue Share (%), by Sales Channel 2024 & 2032
- Figure 36: Asia Pacific Social Commerce Market Revenue (Million), by Country 2024 & 2032
- Figure 37: Asia Pacific Social Commerce Market Revenue Share (%), by Country 2024 & 2032
- Figure 38: South America Social Commerce Market Revenue (Million), by Business Model 2024 & 2032
- Figure 39: South America Social Commerce Market Revenue Share (%), by Business Model 2024 & 2032
- Figure 40: South America Social Commerce Market Revenue (Million), by Product Type 2024 & 2032
- Figure 41: South America Social Commerce Market Revenue Share (%), by Product Type 2024 & 2032
- Figure 42: South America Social Commerce Market Revenue (Million), by Sales Channel 2024 & 2032
- Figure 43: South America Social Commerce Market Revenue Share (%), by Sales Channel 2024 & 2032
- Figure 44: South America Social Commerce Market Revenue (Million), by Country 2024 & 2032
- Figure 45: South America Social Commerce Market Revenue Share (%), by Country 2024 & 2032
- Figure 46: Middle East Social Commerce Market Revenue (Million), by Business Model 2024 & 2032
- Figure 47: Middle East Social Commerce Market Revenue Share (%), by Business Model 2024 & 2032
- Figure 48: Middle East Social Commerce Market Revenue (Million), by Product Type 2024 & 2032
- Figure 49: Middle East Social Commerce Market Revenue Share (%), by Product Type 2024 & 2032
- Figure 50: Middle East Social Commerce Market Revenue (Million), by Sales Channel 2024 & 2032
- Figure 51: Middle East Social Commerce Market Revenue Share (%), by Sales Channel 2024 & 2032
- Figure 52: Middle East Social Commerce Market Revenue (Million), by Country 2024 & 2032
- Figure 53: Middle East Social Commerce Market Revenue Share (%), by Country 2024 & 2032
- Figure 54: United Arab Emirates Social Commerce Market Revenue (Million), by Business Model 2024 & 2032
- Figure 55: United Arab Emirates Social Commerce Market Revenue Share (%), by Business Model 2024 & 2032
- Figure 56: United Arab Emirates Social Commerce Market Revenue (Million), by Product Type 2024 & 2032
- Figure 57: United Arab Emirates Social Commerce Market Revenue Share (%), by Product Type 2024 & 2032
- Figure 58: United Arab Emirates Social Commerce Market Revenue (Million), by Sales Channel 2024 & 2032
- Figure 59: United Arab Emirates Social Commerce Market Revenue Share (%), by Sales Channel 2024 & 2032
- Figure 60: United Arab Emirates Social Commerce Market Revenue (Million), by Country 2024 & 2032
- Figure 61: United Arab Emirates Social Commerce Market Revenue Share (%), by Country 2024 & 2032
List of Tables
- Table 1: Global Social Commerce Market Revenue Million Forecast, by Region 2019 & 2032
- Table 2: Global Social Commerce Market Revenue Million Forecast, by Business Model 2019 & 2032
- Table 3: Global Social Commerce Market Revenue Million Forecast, by Product Type 2019 & 2032
- Table 4: Global Social Commerce Market Revenue Million Forecast, by Sales Channel 2019 & 2032
- Table 5: Global Social Commerce Market Revenue Million Forecast, by Region 2019 & 2032
- Table 6: Global Social Commerce Market Revenue Million Forecast, by Country 2019 & 2032
- Table 7: United States Social Commerce Market Revenue (Million) Forecast, by Application 2019 & 2032
- Table 8: Canada Social Commerce Market Revenue (Million) Forecast, by Application 2019 & 2032
- Table 9: Mexico Social Commerce Market Revenue (Million) Forecast, by Application 2019 & 2032
- Table 10: Rest of North America Social Commerce Market Revenue (Million) Forecast, by Application 2019 & 2032
- Table 11: Global Social Commerce Market Revenue Million Forecast, by Country 2019 & 2032
- Table 12: United Kingdom Social Commerce Market Revenue (Million) Forecast, by Application 2019 & 2032
- Table 13: Germany Social Commerce Market Revenue (Million) Forecast, by Application 2019 & 2032
- Table 14: France Social Commerce Market Revenue (Million) Forecast, by Application 2019 & 2032
- Table 15: Russia Social Commerce Market Revenue (Million) Forecast, by Application 2019 & 2032
- Table 16: Italy Social Commerce Market Revenue (Million) Forecast, by Application 2019 & 2032
- Table 17: Spain Social Commerce Market Revenue (Million) Forecast, by Application 2019 & 2032
- Table 18: Rest of Europe Social Commerce Market Revenue (Million) Forecast, by Application 2019 & 2032
- Table 19: Global Social Commerce Market Revenue Million Forecast, by Country 2019 & 2032
- Table 20: India Social Commerce Market Revenue (Million) Forecast, by Application 2019 & 2032
- Table 21: China Social Commerce Market Revenue (Million) Forecast, by Application 2019 & 2032
- Table 22: Japan Social Commerce Market Revenue (Million) Forecast, by Application 2019 & 2032
- Table 23: Australia Social Commerce Market Revenue (Million) Forecast, by Application 2019 & 2032
- Table 24: Rest of Asia Pacific Social Commerce Market Revenue (Million) Forecast, by Application 2019 & 2032
- Table 25: Global Social Commerce Market Revenue Million Forecast, by Country 2019 & 2032
- Table 26: Brazil Social Commerce Market Revenue (Million) Forecast, by Application 2019 & 2032
- Table 27: Argentina Social Commerce Market Revenue (Million) Forecast, by Application 2019 & 2032
- Table 28: Rest of South America Social Commerce Market Revenue (Million) Forecast, by Application 2019 & 2032
- Table 29: Global Social Commerce Market Revenue Million Forecast, by Country 2019 & 2032
- Table 30: Social Commerce Market Revenue (Million) Forecast, by Application 2019 & 2032
- Table 31: Global Social Commerce Market Revenue Million Forecast, by Country 2019 & 2032
- Table 32: South Africa Social Commerce Market Revenue (Million) Forecast, by Application 2019 & 2032
- Table 33: Rest of Middle East Social Commerce Market Revenue (Million) Forecast, by Application 2019 & 2032
- Table 34: Global Social Commerce Market Revenue Million Forecast, by Business Model 2019 & 2032
- Table 35: Global Social Commerce Market Revenue Million Forecast, by Product Type 2019 & 2032
- Table 36: Global Social Commerce Market Revenue Million Forecast, by Sales Channel 2019 & 2032
- Table 37: Global Social Commerce Market Revenue Million Forecast, by Country 2019 & 2032
- Table 38: United States Social Commerce Market Revenue (Million) Forecast, by Application 2019 & 2032
- Table 39: Canada Social Commerce Market Revenue (Million) Forecast, by Application 2019 & 2032
- Table 40: Mexico Social Commerce Market Revenue (Million) Forecast, by Application 2019 & 2032
- Table 41: Rest of North America Social Commerce Market Revenue (Million) Forecast, by Application 2019 & 2032
- Table 42: Global Social Commerce Market Revenue Million Forecast, by Business Model 2019 & 2032
- Table 43: Global Social Commerce Market Revenue Million Forecast, by Product Type 2019 & 2032
- Table 44: Global Social Commerce Market Revenue Million Forecast, by Sales Channel 2019 & 2032
- Table 45: Global Social Commerce Market Revenue Million Forecast, by Country 2019 & 2032
- Table 46: United Kingdom Social Commerce Market Revenue (Million) Forecast, by Application 2019 & 2032
- Table 47: Germany Social Commerce Market Revenue (Million) Forecast, by Application 2019 & 2032
- Table 48: France Social Commerce Market Revenue (Million) Forecast, by Application 2019 & 2032
- Table 49: Russia Social Commerce Market Revenue (Million) Forecast, by Application 2019 & 2032
- Table 50: Italy Social Commerce Market Revenue (Million) Forecast, by Application 2019 & 2032
- Table 51: Spain Social Commerce Market Revenue (Million) Forecast, by Application 2019 & 2032
- Table 52: Rest of Europe Social Commerce Market Revenue (Million) Forecast, by Application 2019 & 2032
- Table 53: Global Social Commerce Market Revenue Million Forecast, by Business Model 2019 & 2032
- Table 54: Global Social Commerce Market Revenue Million Forecast, by Product Type 2019 & 2032
- Table 55: Global Social Commerce Market Revenue Million Forecast, by Sales Channel 2019 & 2032
- Table 56: Global Social Commerce Market Revenue Million Forecast, by Country 2019 & 2032
- Table 57: India Social Commerce Market Revenue (Million) Forecast, by Application 2019 & 2032
- Table 58: China Social Commerce Market Revenue (Million) Forecast, by Application 2019 & 2032
- Table 59: Japan Social Commerce Market Revenue (Million) Forecast, by Application 2019 & 2032
- Table 60: Australia Social Commerce Market Revenue (Million) Forecast, by Application 2019 & 2032
- Table 61: Rest of Asia Pacific Social Commerce Market Revenue (Million) Forecast, by Application 2019 & 2032
- Table 62: Global Social Commerce Market Revenue Million Forecast, by Business Model 2019 & 2032
- Table 63: Global Social Commerce Market Revenue Million Forecast, by Product Type 2019 & 2032
- Table 64: Global Social Commerce Market Revenue Million Forecast, by Sales Channel 2019 & 2032
- Table 65: Global Social Commerce Market Revenue Million Forecast, by Country 2019 & 2032
- Table 66: Brazil Social Commerce Market Revenue (Million) Forecast, by Application 2019 & 2032
- Table 67: Argentina Social Commerce Market Revenue (Million) Forecast, by Application 2019 & 2032
- Table 68: Rest of South America Social Commerce Market Revenue (Million) Forecast, by Application 2019 & 2032
- Table 69: Global Social Commerce Market Revenue Million Forecast, by Business Model 2019 & 2032
- Table 70: Global Social Commerce Market Revenue Million Forecast, by Product Type 2019 & 2032
- Table 71: Global Social Commerce Market Revenue Million Forecast, by Sales Channel 2019 & 2032
- Table 72: Global Social Commerce Market Revenue Million Forecast, by Country 2019 & 2032
- Table 73: Global Social Commerce Market Revenue Million Forecast, by Business Model 2019 & 2032
- Table 74: Global Social Commerce Market Revenue Million Forecast, by Product Type 2019 & 2032
- Table 75: Global Social Commerce Market Revenue Million Forecast, by Sales Channel 2019 & 2032
- Table 76: Global Social Commerce Market Revenue Million Forecast, by Country 2019 & 2032
- Table 77: South Africa Social Commerce Market Revenue (Million) Forecast, by Application 2019 & 2032
- Table 78: Rest of Middle East Social Commerce Market Revenue (Million) Forecast, by Application 2019 & 2032
Frequently Asked Questions
1. What is the projected Compound Annual Growth Rate (CAGR) of the Social Commerce Market?
The projected CAGR is approximately 28.53%.
2. Which companies are prominent players in the Social Commerce Market?
Key companies in the market include Amazon, Facebook, Pinterest, Fashnear Technologies Private Limited (Meesho), TikTok, Instagram, Twitter**List Not Exhaustive, YouTube, Roposo, Verint.
3. What are the main segments of the Social Commerce Market?
The market segments include Business Model, Product Type, Sales Channel.
4. Can you provide details about the market size?
The market size is estimated to be USD 1.18 Million as of 2022.
5. What are some drivers contributing to market growth?
Growing Number of Social Media Platforms; Shift in Consumer Preferences Toward Online Purchase.
6. What are the notable trends driving market growth?
Growing demand for business-to-consumer (B2C) social commerce is driving the market growth.
7. Are there any restraints impacting market growth?
Privacy Concerns Over Gathering and Using Personal Data; Intense Competition in the Social Commerce Space.
8. Can you provide examples of recent developments in the market?
November 2023: Amazon announced a partnership with Meta (Facebook’s parent company) to revolutionize social commerce. This collaboration aims to integrate Amazon’s e-commerce platform with Meta’s social media platform, providing shoppers with a seamless purchase experience and opening new opportunities for targeted advertising.
9. What pricing options are available for accessing the report?
Pricing options include single-user, multi-user, and enterprise licenses priced at USD 4750, USD 5250, and USD 8750 respectively.
10. Is the market size provided in terms of value or volume?
The market size is provided in terms of value, measured in Million.
11. Are there any specific market keywords associated with the report?
Yes, the market keyword associated with the report is "Social Commerce Market," which aids in identifying and referencing the specific market segment covered.
12. How do I determine which pricing option suits my needs best?
The pricing options vary based on user requirements and access needs. Individual users may opt for single-user licenses, while businesses requiring broader access may choose multi-user or enterprise licenses for cost-effective access to the report.
13. Are there any additional resources or data provided in the Social Commerce Market report?
While the report offers comprehensive insights, it's advisable to review the specific contents or supplementary materials provided to ascertain if additional resources or data are available.
14. How can I stay updated on further developments or reports in the Social Commerce Market?
To stay informed about further developments, trends, and reports in the Social Commerce Market, consider subscribing to industry newsletters, following relevant companies and organizations, or regularly checking reputable industry news sources and publications.
Methodology
Step 1 - Identification of Relevant Samples Size from Population Database


Step 2 - Approaches for Defining Global Market Size (Value, Volume* & Price*)

Note*: In applicable scenarios
Step 3 - Data Sources
Primary Research
- Web Analytics
- Survey Reports
- Research Institute
- Latest Research Reports
- Opinion Leaders
Secondary Research
- Annual Reports
- White Paper
- Latest Press Release
- Industry Association
- Paid Database
- Investor Presentations

Step 4 - Data Triangulation
Involves using different sources of information in order to increase the validity of a study
These sources are likely to be stakeholders in a program - participants, other researchers, program staff, other community members, and so on.
Then we put all data in single framework & apply various statistical tools to find out the dynamic on the market.
During the analysis stage, feedback from the stakeholder groups would be compared to determine areas of agreement as well as areas of divergence
