

Key Insights
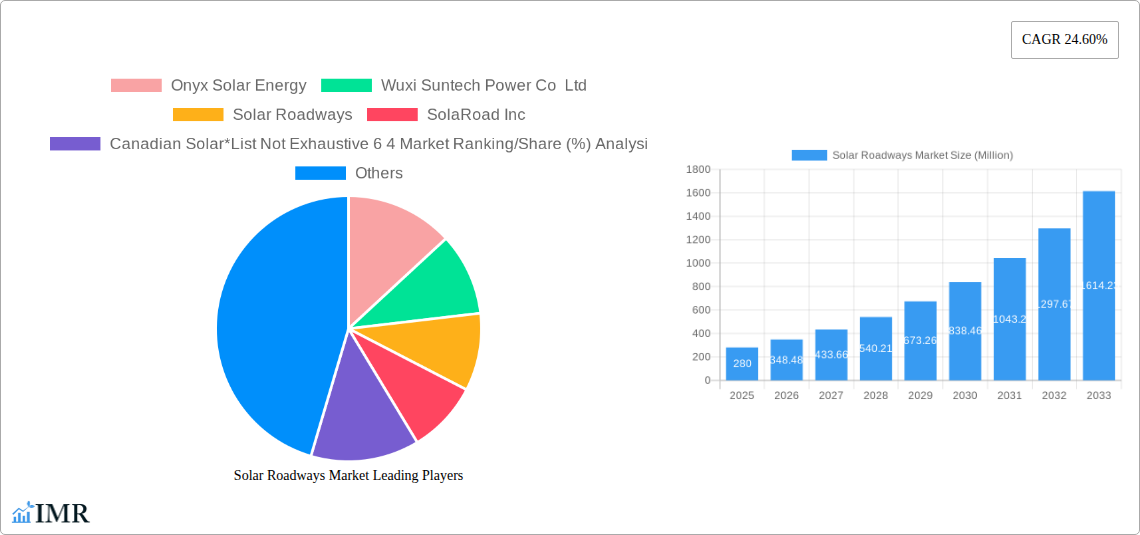
The solar roadways market, currently valued at $280 million in 2025, is projected to experience substantial growth, driven by increasing concerns about climate change and the urgent need for sustainable energy solutions. A Compound Annual Growth Rate (CAGR) of 24.60% from 2025 to 2033 indicates a rapidly expanding market, poised to reach significant scale within the forecast period. Key drivers include government initiatives promoting renewable energy infrastructure, technological advancements leading to improved efficiency and cost reductions in solar panel technology specifically designed for roadways, and the growing demand for sustainable transportation solutions in urban and suburban areas. The market segmentation reveals a preference for monocrystalline silicon materials due to their higher efficiency compared to polycrystalline silicon, while applications predominantly focus on driveways and parking lots, reflecting an initial phase of market penetration. Leading companies like Onyx Solar Energy, Wuxi Suntech Power Co Ltd, and Solar Roadways are at the forefront of innovation, constantly striving to improve the durability, longevity, and cost-effectiveness of solar roadways. However, challenges remain, including high initial investment costs, potential maintenance issues, and the need for robust infrastructure to support widespread adoption. Overcoming these restraints will be crucial for unlocking the full potential of this rapidly evolving market.
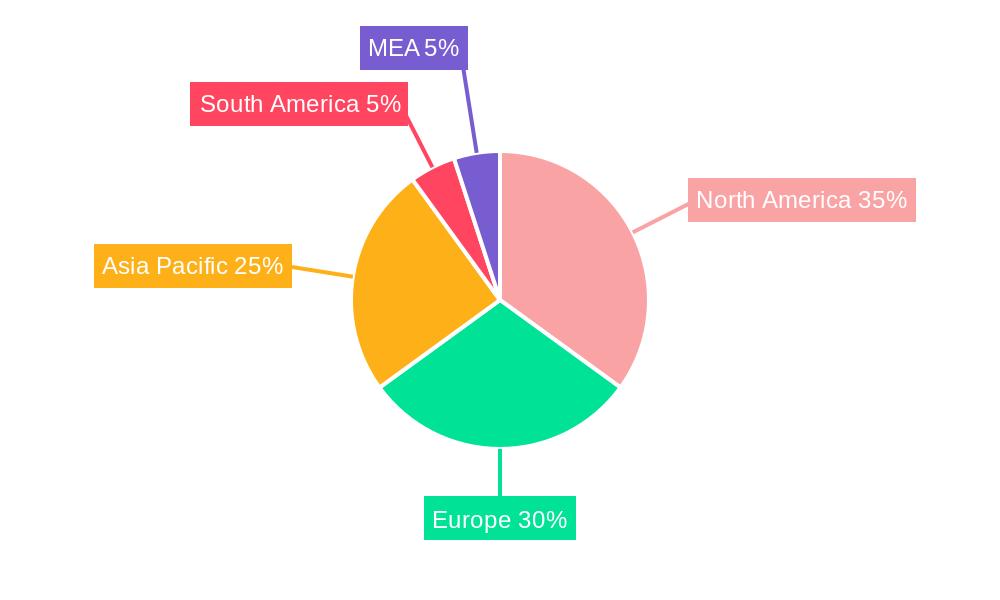
The geographical distribution of the market is expected to be diverse, with North America, Europe, and Asia Pacific representing major regions contributing significantly to overall market growth. North America benefits from strong government support and early adoption of innovative technologies. Europe, with its focus on green initiatives, also displays considerable potential. Asia Pacific, particularly China and India, is anticipated to experience significant growth due to rapid urbanization and increasing investments in renewable energy projects. Continuous technological innovation, focusing on improving energy conversion efficiency, reducing production costs, and developing more durable and weather-resistant solar road materials, will be key to driving future expansion. Furthermore, collaborations between governments, private companies, and research institutions are critical to overcoming existing challenges and fostering wider adoption of solar roadways.
Solar Roadways Market: A Comprehensive Market Report (2019-2033)
This in-depth report provides a comprehensive analysis of the Solar Roadways market, encompassing market dynamics, growth trends, regional segmentation, product landscape, key players, and future outlook. The study period covers 2019-2033, with a base year of 2025 and a forecast period of 2025-2033. The report leverages extensive primary and secondary research to deliver actionable insights for industry professionals, investors, and strategic decision-makers. The parent market is the broader renewable energy sector, while the child market is specifically solar energy infrastructure. The total market value in 2025 is estimated at xx Million.
Solar Roadways Market Dynamics & Structure
The Solar Roadways market is characterized by moderate concentration, with key players such as Onyx Solar Energy, Wuxi Suntech Power Co Ltd, Solar Roadways, SolaRoad Inc, and Canadian Solar holding significant market share (estimated at 64% combined in 2025). Technological innovation, driven by advancements in PV cell efficiency and durable road materials, is a primary growth driver. However, high initial investment costs and regulatory complexities pose significant barriers. The market is also influenced by government incentives and environmental regulations promoting renewable energy adoption. Mergers and acquisitions (M&A) activity remains relatively low, with an estimated xx M&A deals in the past five years.
- Market Concentration: Moderately concentrated, with top 5 players holding 64% market share (2025).
- Technological Innovation: Focus on improving PV cell efficiency, durability, and integration with road infrastructure.
- Regulatory Framework: Government incentives and regulations play a crucial role in market growth.
- Competitive Substitutes: Traditional asphalt and concrete remain primary substitutes.
- End-User Demographics: Primarily government agencies, municipalities, and private developers.
- M&A Trends: Low M&A activity, with an estimated xx deals in the past 5 years.
Solar Roadways Market Growth Trends & Insights
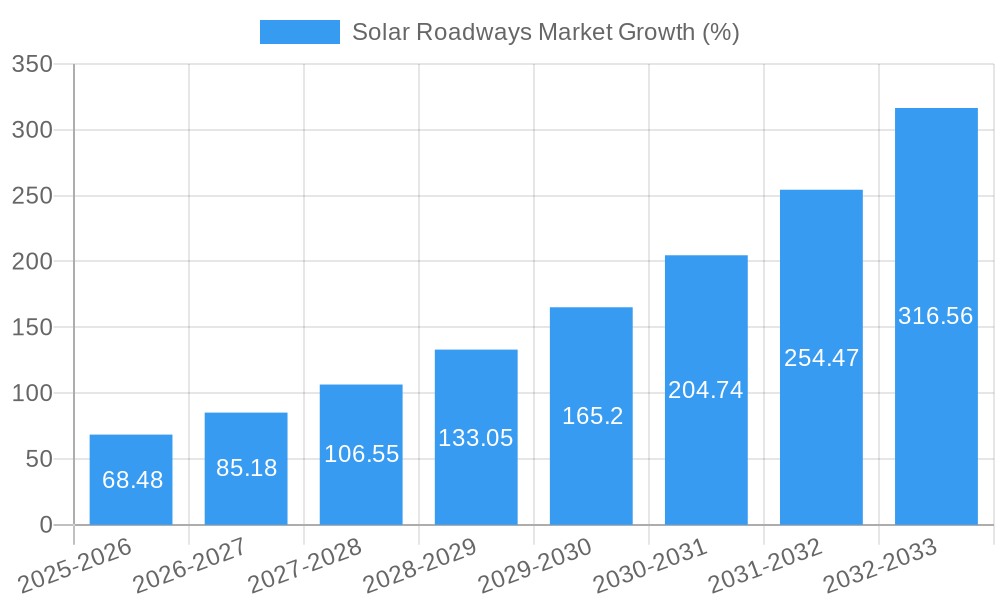
The Solar Roadways market is experiencing significant growth, driven by increasing demand for sustainable energy solutions and the rising adoption of renewable energy technologies across various applications. The market size is projected to reach xx Million by 2033, exhibiting a CAGR of xx% during the forecast period (2025-2033). This growth is attributed to factors such as favorable government policies, technological advancements, and increasing consumer awareness of environmental sustainability. The market penetration rate is currently at xx% and is projected to reach xx% by 2033. Technological disruptions, such as the development of more efficient and cost-effective solar cells, are further accelerating market expansion.
Dominant Regions, Countries, or Segments in Solar Roadways Market
The North American region is currently the dominant market for Solar Roadways, driven by strong government support for renewable energy initiatives and a high level of infrastructure development. Within materials, Monocrystalline Silicon holds a larger market share due to its higher efficiency compared to Polycrystalline Silicon. Driveways, currently, represent the largest application segment, followed by parking lots.
- Key Drivers (North America): Strong government support for renewable energy, advanced infrastructure development, and early adoption by municipalities.
- Materials Segment Dominance: Monocrystalline Silicon (higher efficiency, higher market share).
- Application Segment Dominance: Driveways (larger initial market, easier implementation).
- Growth Potential: Significant growth potential exists in European and Asian markets with supportive government policies and expanding infrastructure projects.
Solar Roadways Market Product Landscape
Solar roadways integrate photovoltaic (PV) cells directly into pavement materials, converting sunlight into electricity. Product innovations focus on enhancing durability, efficiency, and aesthetic appeal. Key performance metrics include power output per square meter, lifespan, and resistance to mechanical stress. Unique selling propositions include energy generation while providing essential road infrastructure, contributing to carbon footprint reduction and sustainability goals. Recent technological advancements concentrate on improving the efficiency and longevity of embedded solar cells within road surfaces, increasing their resistance to traffic loads and weathering.
Key Drivers, Barriers & Challenges in Solar Roadways Market
Key Drivers:
- Increasing demand for renewable energy sources.
- Government incentives and supportive policies.
- Technological advancements leading to cost reduction and efficiency improvements.
- Growing environmental awareness among consumers and businesses.
Challenges and Restraints:
- High initial investment costs.
- Limited scalability and complex implementation.
- Concerns about durability and maintenance requirements.
- Potential for damage from heavy vehicles and extreme weather conditions. This contributes to a xx% reduction in projected growth annually.
Emerging Opportunities in Solar Roadways Market
- Expanding into new applications, such as pedestrian walkways and bicycle paths.
- Development of more aesthetically pleasing and customizable road surfaces.
- Integration with smart city infrastructure for enhanced energy management.
- Exploring opportunities in emerging markets with growing infrastructure needs.
Growth Accelerators in the Solar Roadways Market Industry
Technological breakthroughs in PV cell efficiency and material science are key growth accelerators. Strategic partnerships between solar energy companies and road construction firms are fostering market expansion. Government initiatives focused on promoting renewable energy integration within infrastructure projects are further driving growth. Furthermore, the increasing awareness of environmental sustainability is motivating consumers and businesses to support and adopt sustainable infrastructure solutions.
Key Players Shaping the Solar Roadways Market Market
- Onyx Solar Energy
- Wuxi Suntech Power Co Ltd
- Solar Roadways
- SolaRoad Inc
- Canadian Solar
- Wattway
- Colas Group
- PLATIO Solar
Notable Milestones in Solar Roadways Market Sector
- May 2023: The Dutch province of North Brabant initiated the construction of a 500-meter solar cycle path, integrating 600 solar panels into the asphalt. This project serves as a significant pilot study evaluating the long-term viability and performance of solar roadways in high-traffic pedestrian and bicycle areas.
In-Depth Solar Roadways Market Market Outlook
The Solar Roadways market holds immense potential for future growth, driven by technological advancements, supportive government policies, and increasing environmental consciousness. Strategic partnerships and market expansion into untapped regions will play a crucial role in shaping the market's trajectory. The market is expected to witness substantial expansion over the forecast period, offering significant opportunities for investors and industry players. The continued development and implementation of innovative solar roadway technologies will be vital in driving long-term growth and adoption.
Solar Roadways Market Segmentation
-
1. Materials
- 1.1. Monocrystalline Silicon
- 1.2. Polycrystalline Silicon
-
2. Applications
- 2.1. Driveways
- 2.2. Parking Lots
Solar Roadways Market Segmentation By Geography
-
1. North America
- 1.1. United States
- 1.2. Canada
- 1.3. Rest of North America
-
2. Europe
- 2.1. Germany
- 2.2. France
- 2.3. United Kingdom
- 2.4. Italy
- 2.5. Spain
- 2.6. NORDIC
- 2.7. Turkey
- 2.8. Russia
- 2.9. Rest of Europe
-
3. Asia Pacific
- 3.1. China
- 3.2. India
- 3.3. Japan
- 3.4. Malaysia
- 3.5. Thailand
- 3.6. Indonesia
- 3.7. Vietnam
- 3.8. Rest of Asia Pacific
-
4. Middle East and Africa
- 4.1. Saudi Arabia
- 4.2. United Arab Emirates
- 4.3. South Africa
- 4.4. Qatar
- 4.5. Egypt
- 4.6. Nigeria
- 4.7. Rest of Middle East and Africa
-
5. South America
- 5.1. Brazil
- 5.2. Argentina
- 5.3. Colombia
- 5.4. Rest of South America
Solar Roadways Market REPORT HIGHLIGHTS
| Aspects | Details |
|---|---|
| Study Period | 2019-2033 |
| Base Year | 2024 |
| Estimated Year | 2025 |
| Forecast Period | 2025-2033 |
| Historical Period | 2019-2024 |
| Growth Rate | CAGR of 24.60% from 2019-2033 |
| Segmentation |
|
Table of Contents
- 1. Introduction
- 1.1. Research Scope
- 1.2. Market Segmentation
- 1.3. Research Methodology
- 1.4. Definitions and Assumptions
- 2. Executive Summary
- 2.1. Introduction
- 3. Market Dynamics
- 3.1. Introduction
- 3.2. Market Drivers
- 3.2.1. 4.; Growing Adoption of Renewable Energy4.; Efforts in Sustainable Infrastructure to Reduce Carbon Footprints
- 3.3. Market Restrains
- 3.3.1. 4.; High Initial Cost Associated With Developing the Infrastructure
- 3.4. Market Trends
- 3.4.1. The Driveways Segment is Expected to Witness Significant Growth
- 4. Market Factor Analysis
- 4.1. Porters Five Forces
- 4.2. Supply/Value Chain
- 4.3. PESTEL analysis
- 4.4. Market Entropy
- 4.5. Patent/Trademark Analysis
- 5. Global Solar Roadways Market Analysis, Insights and Forecast, 2019-2031
- 5.1. Market Analysis, Insights and Forecast - by Materials
- 5.1.1. Monocrystalline Silicon
- 5.1.2. Polycrystalline Silicon
- 5.2. Market Analysis, Insights and Forecast - by Applications
- 5.2.1. Driveways
- 5.2.2. Parking Lots
- 5.3. Market Analysis, Insights and Forecast - by Region
- 5.3.1. North America
- 5.3.2. Europe
- 5.3.3. Asia Pacific
- 5.3.4. Middle East and Africa
- 5.3.5. South America
- 5.1. Market Analysis, Insights and Forecast - by Materials
- 6. North America Solar Roadways Market Analysis, Insights and Forecast, 2019-2031
- 6.1. Market Analysis, Insights and Forecast - by Materials
- 6.1.1. Monocrystalline Silicon
- 6.1.2. Polycrystalline Silicon
- 6.2. Market Analysis, Insights and Forecast - by Applications
- 6.2.1. Driveways
- 6.2.2. Parking Lots
- 6.1. Market Analysis, Insights and Forecast - by Materials
- 7. Europe Solar Roadways Market Analysis, Insights and Forecast, 2019-2031
- 7.1. Market Analysis, Insights and Forecast - by Materials
- 7.1.1. Monocrystalline Silicon
- 7.1.2. Polycrystalline Silicon
- 7.2. Market Analysis, Insights and Forecast - by Applications
- 7.2.1. Driveways
- 7.2.2. Parking Lots
- 7.1. Market Analysis, Insights and Forecast - by Materials
- 8. Asia Pacific Solar Roadways Market Analysis, Insights and Forecast, 2019-2031
- 8.1. Market Analysis, Insights and Forecast - by Materials
- 8.1.1. Monocrystalline Silicon
- 8.1.2. Polycrystalline Silicon
- 8.2. Market Analysis, Insights and Forecast - by Applications
- 8.2.1. Driveways
- 8.2.2. Parking Lots
- 8.1. Market Analysis, Insights and Forecast - by Materials
- 9. Middle East and Africa Solar Roadways Market Analysis, Insights and Forecast, 2019-2031
- 9.1. Market Analysis, Insights and Forecast - by Materials
- 9.1.1. Monocrystalline Silicon
- 9.1.2. Polycrystalline Silicon
- 9.2. Market Analysis, Insights and Forecast - by Applications
- 9.2.1. Driveways
- 9.2.2. Parking Lots
- 9.1. Market Analysis, Insights and Forecast - by Materials
- 10. South America Solar Roadways Market Analysis, Insights and Forecast, 2019-2031
- 10.1. Market Analysis, Insights and Forecast - by Materials
- 10.1.1. Monocrystalline Silicon
- 10.1.2. Polycrystalline Silicon
- 10.2. Market Analysis, Insights and Forecast - by Applications
- 10.2.1. Driveways
- 10.2.2. Parking Lots
- 10.1. Market Analysis, Insights and Forecast - by Materials
- 11. North America Solar Roadways Market Analysis, Insights and Forecast, 2019-2031
- 11.1. Market Analysis, Insights and Forecast - By Country/Sub-region
- 11.1.1 United States
- 11.1.2 Canada
- 11.1.3 Mexico
- 12. Europe Solar Roadways Market Analysis, Insights and Forecast, 2019-2031
- 12.1. Market Analysis, Insights and Forecast - By Country/Sub-region
- 12.1.1 Germany
- 12.1.2 United Kingdom
- 12.1.3 France
- 12.1.4 Spain
- 12.1.5 Italy
- 12.1.6 Spain
- 12.1.7 Belgium
- 12.1.8 Netherland
- 12.1.9 Nordics
- 12.1.10 Rest of Europe
- 13. Asia Pacific Solar Roadways Market Analysis, Insights and Forecast, 2019-2031
- 13.1. Market Analysis, Insights and Forecast - By Country/Sub-region
- 13.1.1 China
- 13.1.2 Japan
- 13.1.3 India
- 13.1.4 South Korea
- 13.1.5 Southeast Asia
- 13.1.6 Australia
- 13.1.7 Indonesia
- 13.1.8 Phillipes
- 13.1.9 Singapore
- 13.1.10 Thailandc
- 13.1.11 Rest of Asia Pacific
- 14. South America Solar Roadways Market Analysis, Insights and Forecast, 2019-2031
- 14.1. Market Analysis, Insights and Forecast - By Country/Sub-region
- 14.1.1 Brazil
- 14.1.2 Argentina
- 14.1.3 Peru
- 14.1.4 Chile
- 14.1.5 Colombia
- 14.1.6 Ecuador
- 14.1.7 Venezuela
- 14.1.8 Rest of South America
- 15. North America Solar Roadways Market Analysis, Insights and Forecast, 2019-2031
- 15.1. Market Analysis, Insights and Forecast - By Country/Sub-region
- 15.1.1 United States
- 15.1.2 Canada
- 15.1.3 Mexico
- 16. MEA Solar Roadways Market Analysis, Insights and Forecast, 2019-2031
- 16.1. Market Analysis, Insights and Forecast - By Country/Sub-region
- 16.1.1 United Arab Emirates
- 16.1.2 Saudi Arabia
- 16.1.3 South Africa
- 16.1.4 Rest of Middle East and Africa
- 17. Competitive Analysis
- 17.1. Global Market Share Analysis 2024
- 17.2. Company Profiles
- 17.2.1 Onyx Solar Energy
- 17.2.1.1. Overview
- 17.2.1.2. Products
- 17.2.1.3. SWOT Analysis
- 17.2.1.4. Recent Developments
- 17.2.1.5. Financials (Based on Availability)
- 17.2.2 Wuxi Suntech Power Co Ltd
- 17.2.2.1. Overview
- 17.2.2.2. Products
- 17.2.2.3. SWOT Analysis
- 17.2.2.4. Recent Developments
- 17.2.2.5. Financials (Based on Availability)
- 17.2.3 Solar Roadways
- 17.2.3.1. Overview
- 17.2.3.2. Products
- 17.2.3.3. SWOT Analysis
- 17.2.3.4. Recent Developments
- 17.2.3.5. Financials (Based on Availability)
- 17.2.4 SolaRoad Inc
- 17.2.4.1. Overview
- 17.2.4.2. Products
- 17.2.4.3. SWOT Analysis
- 17.2.4.4. Recent Developments
- 17.2.4.5. Financials (Based on Availability)
- 17.2.5 Canadian Solar*List Not Exhaustive 6 4 Market Ranking/Share (%) Analysi
- 17.2.5.1. Overview
- 17.2.5.2. Products
- 17.2.5.3. SWOT Analysis
- 17.2.5.4. Recent Developments
- 17.2.5.5. Financials (Based on Availability)
- 17.2.6 Wattway
- 17.2.6.1. Overview
- 17.2.6.2. Products
- 17.2.6.3. SWOT Analysis
- 17.2.6.4. Recent Developments
- 17.2.6.5. Financials (Based on Availability)
- 17.2.7 Colas Group
- 17.2.7.1. Overview
- 17.2.7.2. Products
- 17.2.7.3. SWOT Analysis
- 17.2.7.4. Recent Developments
- 17.2.7.5. Financials (Based on Availability)
- 17.2.8 PLATIO Solar
- 17.2.8.1. Overview
- 17.2.8.2. Products
- 17.2.8.3. SWOT Analysis
- 17.2.8.4. Recent Developments
- 17.2.8.5. Financials (Based on Availability)
- 17.2.1 Onyx Solar Energy
List of Figures
- Figure 1: Global Solar Roadways Market Revenue Breakdown (Million, %) by Region 2024 & 2032
- Figure 2: North America Solar Roadways Market Revenue (Million), by Country 2024 & 2032
- Figure 3: North America Solar Roadways Market Revenue Share (%), by Country 2024 & 2032
- Figure 4: Europe Solar Roadways Market Revenue (Million), by Country 2024 & 2032
- Figure 5: Europe Solar Roadways Market Revenue Share (%), by Country 2024 & 2032
- Figure 6: Asia Pacific Solar Roadways Market Revenue (Million), by Country 2024 & 2032
- Figure 7: Asia Pacific Solar Roadways Market Revenue Share (%), by Country 2024 & 2032
- Figure 8: South America Solar Roadways Market Revenue (Million), by Country 2024 & 2032
- Figure 9: South America Solar Roadways Market Revenue Share (%), by Country 2024 & 2032
- Figure 10: North America Solar Roadways Market Revenue (Million), by Country 2024 & 2032
- Figure 11: North America Solar Roadways Market Revenue Share (%), by Country 2024 & 2032
- Figure 12: MEA Solar Roadways Market Revenue (Million), by Country 2024 & 2032
- Figure 13: MEA Solar Roadways Market Revenue Share (%), by Country 2024 & 2032
- Figure 14: North America Solar Roadways Market Revenue (Million), by Materials 2024 & 2032
- Figure 15: North America Solar Roadways Market Revenue Share (%), by Materials 2024 & 2032
- Figure 16: North America Solar Roadways Market Revenue (Million), by Applications 2024 & 2032
- Figure 17: North America Solar Roadways Market Revenue Share (%), by Applications 2024 & 2032
- Figure 18: North America Solar Roadways Market Revenue (Million), by Country 2024 & 2032
- Figure 19: North America Solar Roadways Market Revenue Share (%), by Country 2024 & 2032
- Figure 20: Europe Solar Roadways Market Revenue (Million), by Materials 2024 & 2032
- Figure 21: Europe Solar Roadways Market Revenue Share (%), by Materials 2024 & 2032
- Figure 22: Europe Solar Roadways Market Revenue (Million), by Applications 2024 & 2032
- Figure 23: Europe Solar Roadways Market Revenue Share (%), by Applications 2024 & 2032
- Figure 24: Europe Solar Roadways Market Revenue (Million), by Country 2024 & 2032
- Figure 25: Europe Solar Roadways Market Revenue Share (%), by Country 2024 & 2032
- Figure 26: Asia Pacific Solar Roadways Market Revenue (Million), by Materials 2024 & 2032
- Figure 27: Asia Pacific Solar Roadways Market Revenue Share (%), by Materials 2024 & 2032
- Figure 28: Asia Pacific Solar Roadways Market Revenue (Million), by Applications 2024 & 2032
- Figure 29: Asia Pacific Solar Roadways Market Revenue Share (%), by Applications 2024 & 2032
- Figure 30: Asia Pacific Solar Roadways Market Revenue (Million), by Country 2024 & 2032
- Figure 31: Asia Pacific Solar Roadways Market Revenue Share (%), by Country 2024 & 2032
- Figure 32: Middle East and Africa Solar Roadways Market Revenue (Million), by Materials 2024 & 2032
- Figure 33: Middle East and Africa Solar Roadways Market Revenue Share (%), by Materials 2024 & 2032
- Figure 34: Middle East and Africa Solar Roadways Market Revenue (Million), by Applications 2024 & 2032
- Figure 35: Middle East and Africa Solar Roadways Market Revenue Share (%), by Applications 2024 & 2032
- Figure 36: Middle East and Africa Solar Roadways Market Revenue (Million), by Country 2024 & 2032
- Figure 37: Middle East and Africa Solar Roadways Market Revenue Share (%), by Country 2024 & 2032
- Figure 38: South America Solar Roadways Market Revenue (Million), by Materials 2024 & 2032
- Figure 39: South America Solar Roadways Market Revenue Share (%), by Materials 2024 & 2032
- Figure 40: South America Solar Roadways Market Revenue (Million), by Applications 2024 & 2032
- Figure 41: South America Solar Roadways Market Revenue Share (%), by Applications 2024 & 2032
- Figure 42: South America Solar Roadways Market Revenue (Million), by Country 2024 & 2032
- Figure 43: South America Solar Roadways Market Revenue Share (%), by Country 2024 & 2032
List of Tables
- Table 1: Global Solar Roadways Market Revenue Million Forecast, by Region 2019 & 2032
- Table 2: Global Solar Roadways Market Revenue Million Forecast, by Materials 2019 & 2032
- Table 3: Global Solar Roadways Market Revenue Million Forecast, by Applications 2019 & 2032
- Table 4: Global Solar Roadways Market Revenue Million Forecast, by Region 2019 & 2032
- Table 5: Global Solar Roadways Market Revenue Million Forecast, by Country 2019 & 2032
- Table 6: United States Solar Roadways Market Revenue (Million) Forecast, by Application 2019 & 2032
- Table 7: Canada Solar Roadways Market Revenue (Million) Forecast, by Application 2019 & 2032
- Table 8: Mexico Solar Roadways Market Revenue (Million) Forecast, by Application 2019 & 2032
- Table 9: Global Solar Roadways Market Revenue Million Forecast, by Country 2019 & 2032
- Table 10: Germany Solar Roadways Market Revenue (Million) Forecast, by Application 2019 & 2032
- Table 11: United Kingdom Solar Roadways Market Revenue (Million) Forecast, by Application 2019 & 2032
- Table 12: France Solar Roadways Market Revenue (Million) Forecast, by Application 2019 & 2032
- Table 13: Spain Solar Roadways Market Revenue (Million) Forecast, by Application 2019 & 2032
- Table 14: Italy Solar Roadways Market Revenue (Million) Forecast, by Application 2019 & 2032
- Table 15: Spain Solar Roadways Market Revenue (Million) Forecast, by Application 2019 & 2032
- Table 16: Belgium Solar Roadways Market Revenue (Million) Forecast, by Application 2019 & 2032
- Table 17: Netherland Solar Roadways Market Revenue (Million) Forecast, by Application 2019 & 2032
- Table 18: Nordics Solar Roadways Market Revenue (Million) Forecast, by Application 2019 & 2032
- Table 19: Rest of Europe Solar Roadways Market Revenue (Million) Forecast, by Application 2019 & 2032
- Table 20: Global Solar Roadways Market Revenue Million Forecast, by Country 2019 & 2032
- Table 21: China Solar Roadways Market Revenue (Million) Forecast, by Application 2019 & 2032
- Table 22: Japan Solar Roadways Market Revenue (Million) Forecast, by Application 2019 & 2032
- Table 23: India Solar Roadways Market Revenue (Million) Forecast, by Application 2019 & 2032
- Table 24: South Korea Solar Roadways Market Revenue (Million) Forecast, by Application 2019 & 2032
- Table 25: Southeast Asia Solar Roadways Market Revenue (Million) Forecast, by Application 2019 & 2032
- Table 26: Australia Solar Roadways Market Revenue (Million) Forecast, by Application 2019 & 2032
- Table 27: Indonesia Solar Roadways Market Revenue (Million) Forecast, by Application 2019 & 2032
- Table 28: Phillipes Solar Roadways Market Revenue (Million) Forecast, by Application 2019 & 2032
- Table 29: Singapore Solar Roadways Market Revenue (Million) Forecast, by Application 2019 & 2032
- Table 30: Thailandc Solar Roadways Market Revenue (Million) Forecast, by Application 2019 & 2032
- Table 31: Rest of Asia Pacific Solar Roadways Market Revenue (Million) Forecast, by Application 2019 & 2032
- Table 32: Global Solar Roadways Market Revenue Million Forecast, by Country 2019 & 2032
- Table 33: Brazil Solar Roadways Market Revenue (Million) Forecast, by Application 2019 & 2032
- Table 34: Argentina Solar Roadways Market Revenue (Million) Forecast, by Application 2019 & 2032
- Table 35: Peru Solar Roadways Market Revenue (Million) Forecast, by Application 2019 & 2032
- Table 36: Chile Solar Roadways Market Revenue (Million) Forecast, by Application 2019 & 2032
- Table 37: Colombia Solar Roadways Market Revenue (Million) Forecast, by Application 2019 & 2032
- Table 38: Ecuador Solar Roadways Market Revenue (Million) Forecast, by Application 2019 & 2032
- Table 39: Venezuela Solar Roadways Market Revenue (Million) Forecast, by Application 2019 & 2032
- Table 40: Rest of South America Solar Roadways Market Revenue (Million) Forecast, by Application 2019 & 2032
- Table 41: Global Solar Roadways Market Revenue Million Forecast, by Country 2019 & 2032
- Table 42: United States Solar Roadways Market Revenue (Million) Forecast, by Application 2019 & 2032
- Table 43: Canada Solar Roadways Market Revenue (Million) Forecast, by Application 2019 & 2032
- Table 44: Mexico Solar Roadways Market Revenue (Million) Forecast, by Application 2019 & 2032
- Table 45: Global Solar Roadways Market Revenue Million Forecast, by Country 2019 & 2032
- Table 46: United Arab Emirates Solar Roadways Market Revenue (Million) Forecast, by Application 2019 & 2032
- Table 47: Saudi Arabia Solar Roadways Market Revenue (Million) Forecast, by Application 2019 & 2032
- Table 48: South Africa Solar Roadways Market Revenue (Million) Forecast, by Application 2019 & 2032
- Table 49: Rest of Middle East and Africa Solar Roadways Market Revenue (Million) Forecast, by Application 2019 & 2032
- Table 50: Global Solar Roadways Market Revenue Million Forecast, by Materials 2019 & 2032
- Table 51: Global Solar Roadways Market Revenue Million Forecast, by Applications 2019 & 2032
- Table 52: Global Solar Roadways Market Revenue Million Forecast, by Country 2019 & 2032
- Table 53: United States Solar Roadways Market Revenue (Million) Forecast, by Application 2019 & 2032
- Table 54: Canada Solar Roadways Market Revenue (Million) Forecast, by Application 2019 & 2032
- Table 55: Rest of North America Solar Roadways Market Revenue (Million) Forecast, by Application 2019 & 2032
- Table 56: Global Solar Roadways Market Revenue Million Forecast, by Materials 2019 & 2032
- Table 57: Global Solar Roadways Market Revenue Million Forecast, by Applications 2019 & 2032
- Table 58: Global Solar Roadways Market Revenue Million Forecast, by Country 2019 & 2032
- Table 59: Germany Solar Roadways Market Revenue (Million) Forecast, by Application 2019 & 2032
- Table 60: France Solar Roadways Market Revenue (Million) Forecast, by Application 2019 & 2032
- Table 61: United Kingdom Solar Roadways Market Revenue (Million) Forecast, by Application 2019 & 2032
- Table 62: Italy Solar Roadways Market Revenue (Million) Forecast, by Application 2019 & 2032
- Table 63: Spain Solar Roadways Market Revenue (Million) Forecast, by Application 2019 & 2032
- Table 64: NORDIC Solar Roadways Market Revenue (Million) Forecast, by Application 2019 & 2032
- Table 65: Turkey Solar Roadways Market Revenue (Million) Forecast, by Application 2019 & 2032
- Table 66: Russia Solar Roadways Market Revenue (Million) Forecast, by Application 2019 & 2032
- Table 67: Rest of Europe Solar Roadways Market Revenue (Million) Forecast, by Application 2019 & 2032
- Table 68: Global Solar Roadways Market Revenue Million Forecast, by Materials 2019 & 2032
- Table 69: Global Solar Roadways Market Revenue Million Forecast, by Applications 2019 & 2032
- Table 70: Global Solar Roadways Market Revenue Million Forecast, by Country 2019 & 2032
- Table 71: China Solar Roadways Market Revenue (Million) Forecast, by Application 2019 & 2032
- Table 72: India Solar Roadways Market Revenue (Million) Forecast, by Application 2019 & 2032
- Table 73: Japan Solar Roadways Market Revenue (Million) Forecast, by Application 2019 & 2032
- Table 74: Malaysia Solar Roadways Market Revenue (Million) Forecast, by Application 2019 & 2032
- Table 75: Thailand Solar Roadways Market Revenue (Million) Forecast, by Application 2019 & 2032
- Table 76: Indonesia Solar Roadways Market Revenue (Million) Forecast, by Application 2019 & 2032
- Table 77: Vietnam Solar Roadways Market Revenue (Million) Forecast, by Application 2019 & 2032
- Table 78: Rest of Asia Pacific Solar Roadways Market Revenue (Million) Forecast, by Application 2019 & 2032
- Table 79: Global Solar Roadways Market Revenue Million Forecast, by Materials 2019 & 2032
- Table 80: Global Solar Roadways Market Revenue Million Forecast, by Applications 2019 & 2032
- Table 81: Global Solar Roadways Market Revenue Million Forecast, by Country 2019 & 2032
- Table 82: Saudi Arabia Solar Roadways Market Revenue (Million) Forecast, by Application 2019 & 2032
- Table 83: United Arab Emirates Solar Roadways Market Revenue (Million) Forecast, by Application 2019 & 2032
- Table 84: South Africa Solar Roadways Market Revenue (Million) Forecast, by Application 2019 & 2032
- Table 85: Qatar Solar Roadways Market Revenue (Million) Forecast, by Application 2019 & 2032
- Table 86: Egypt Solar Roadways Market Revenue (Million) Forecast, by Application 2019 & 2032
- Table 87: Nigeria Solar Roadways Market Revenue (Million) Forecast, by Application 2019 & 2032
- Table 88: Rest of Middle East and Africa Solar Roadways Market Revenue (Million) Forecast, by Application 2019 & 2032
- Table 89: Global Solar Roadways Market Revenue Million Forecast, by Materials 2019 & 2032
- Table 90: Global Solar Roadways Market Revenue Million Forecast, by Applications 2019 & 2032
- Table 91: Global Solar Roadways Market Revenue Million Forecast, by Country 2019 & 2032
- Table 92: Brazil Solar Roadways Market Revenue (Million) Forecast, by Application 2019 & 2032
- Table 93: Argentina Solar Roadways Market Revenue (Million) Forecast, by Application 2019 & 2032
- Table 94: Colombia Solar Roadways Market Revenue (Million) Forecast, by Application 2019 & 2032
- Table 95: Rest of South America Solar Roadways Market Revenue (Million) Forecast, by Application 2019 & 2032
Frequently Asked Questions
1. What is the projected Compound Annual Growth Rate (CAGR) of the Solar Roadways Market?
The projected CAGR is approximately 24.60%.
2. Which companies are prominent players in the Solar Roadways Market?
Key companies in the market include Onyx Solar Energy, Wuxi Suntech Power Co Ltd, Solar Roadways, SolaRoad Inc, Canadian Solar*List Not Exhaustive 6 4 Market Ranking/Share (%) Analysi, Wattway, Colas Group, PLATIO Solar.
3. What are the main segments of the Solar Roadways Market?
The market segments include Materials, Applications.
4. Can you provide details about the market size?
The market size is estimated to be USD 280 Million as of 2022.
5. What are some drivers contributing to market growth?
4.; Growing Adoption of Renewable Energy4.; Efforts in Sustainable Infrastructure to Reduce Carbon Footprints.
6. What are the notable trends driving market growth?
The Driveways Segment is Expected to Witness Significant Growth.
7. Are there any restraints impacting market growth?
4.; High Initial Cost Associated With Developing the Infrastructure.
8. Can you provide examples of recent developments in the market?
May 2023: The Dutch province of North Brabant started constructing a 500-meter-long ground-mounted solar cycle path along the provincial N285 road near Wagenberg. The PV system will be integrated into the asphalt top layer and comprise 600 unspecified solar panels. As per the government, the project is mainly intended to gain experience deploying solar cells on bicycle paths. During five years, government experts will assess the resistance of the solar modules to the mechanical stress applied by the presence of pedestrians and bikers, the costs for their maintenance, and the PV system energy yield.
9. What pricing options are available for accessing the report?
Pricing options include single-user, multi-user, and enterprise licenses priced at USD 4750, USD 5250, and USD 8750 respectively.
10. Is the market size provided in terms of value or volume?
The market size is provided in terms of value, measured in Million.
11. Are there any specific market keywords associated with the report?
Yes, the market keyword associated with the report is "Solar Roadways Market," which aids in identifying and referencing the specific market segment covered.
12. How do I determine which pricing option suits my needs best?
The pricing options vary based on user requirements and access needs. Individual users may opt for single-user licenses, while businesses requiring broader access may choose multi-user or enterprise licenses for cost-effective access to the report.
13. Are there any additional resources or data provided in the Solar Roadways Market report?
While the report offers comprehensive insights, it's advisable to review the specific contents or supplementary materials provided to ascertain if additional resources or data are available.
14. How can I stay updated on further developments or reports in the Solar Roadways Market?
To stay informed about further developments, trends, and reports in the Solar Roadways Market, consider subscribing to industry newsletters, following relevant companies and organizations, or regularly checking reputable industry news sources and publications.
Methodology
Step 1 - Identification of Relevant Samples Size from Population Database


Step 2 - Approaches for Defining Global Market Size (Value, Volume* & Price*)

Note*: In applicable scenarios
Step 3 - Data Sources
Primary Research
- Web Analytics
- Survey Reports
- Research Institute
- Latest Research Reports
- Opinion Leaders
Secondary Research
- Annual Reports
- White Paper
- Latest Press Release
- Industry Association
- Paid Database
- Investor Presentations

Step 4 - Data Triangulation
Involves using different sources of information in order to increase the validity of a study
These sources are likely to be stakeholders in a program - participants, other researchers, program staff, other community members, and so on.
Then we put all data in single framework & apply various statistical tools to find out the dynamic on the market.
During the analysis stage, feedback from the stakeholder groups would be compared to determine areas of agreement as well as areas of divergence
