

Key Insights
The global switchgear market, valued at $122.24 billion in 2025, is projected to experience robust growth, driven by the increasing demand for reliable power distribution across various sectors. A Compound Annual Growth Rate (CAGR) of 6.10% from 2025 to 2033 indicates a significant expansion in market size, reaching an estimated $200 billion by 2033. Key drivers include the burgeoning renewable energy sector, the rise of smart grids and automation in power distribution, and stringent government regulations for improved grid safety and efficiency. Growth is particularly strong in the high-voltage insulation segment within the switchgear type category, fueled by the increasing adoption of high-voltage transmission lines and substation upgrades. The industrial end-user segment is a major contributor, driven by the expansion of manufacturing and industrial automation globally. However, market growth may face some restraints, including supply chain disruptions, material cost fluctuations, and potential labor shortages in specialized installation roles. Regionally, North America and Europe are currently leading, but Asia-Pacific is anticipated to witness the fastest growth due to rapid industrialization and infrastructure development. Competitive landscape is dominated by established players such as ABB, Siemens, and Schneider Electric, alongside regional players focused on specific market segments.
The market segmentation reveals important trends. High-voltage insulation within the switchgear type category is anticipated to dominate the market due to its application in large-scale power transmission and distribution systems. This segment is expected to experience higher growth rates compared to other insulation types or lower-voltage switchgear. Within the end-user segment, the industrial sector will likely maintain its leading position, followed by the commercial sector. The residential sector shows steady growth driven by the increasing electrification of homes and smart home technologies. Strategic partnerships, technological advancements in areas such as digitalization and condition monitoring, and mergers and acquisitions are expected to shape the future competitive landscape and drive innovation within the industry. Companies are focusing on developing energy-efficient and sustainable switchgear solutions to meet environmental concerns and contribute to a greener energy future.

Switchgear Industry Market Report: 2019-2033
This comprehensive report provides a detailed analysis of the global switchgear industry, encompassing market dynamics, growth trends, regional dominance, product landscapes, key players, and future outlook. The study period covers 2019-2033, with 2025 as the base and estimated year. The report caters to industry professionals, investors, and researchers seeking in-depth insights into this crucial sector. The parent market is the Electrical Equipment market, while the child market is specifically the switchgear segment.
Switchgear Industry Market Dynamics & Structure
The global switchgear market, valued at xx Million units in 2024, exhibits a moderately consolidated structure with key players like ABB, Siemens, Schneider Electric, and Eaton holding significant market shares. Technological innovation, particularly in areas like digitalization and sustainability, is a primary growth driver. Stringent regulatory frameworks concerning safety and environmental compliance further shape market dynamics. Competitive pressure from alternative technologies and the increasing demand for energy-efficient solutions are significant considerations. Mergers and acquisitions (M&A) activity remains robust, with an estimated xx number of deals recorded in the past five years, primarily aimed at expanding market reach and technological capabilities.
- Market Concentration: Moderately consolidated, with top players holding xx% market share.
- Technological Innovation: Focus on digital switchgear, smart grids, and eco-friendly designs.
- Regulatory Landscape: Stringent safety and environmental standards driving innovation.
- Competitive Substitutes: Emerging technologies like solid-state circuit breakers pose a challenge.
- End-User Demographics: Growing industrialization and urbanization fuel demand.
- M&A Activity: xx deals in the last five years, focusing on expansion and technology acquisition.
Switchgear Industry Growth Trends & Insights
The switchgear market has experienced a Compound Annual Growth Rate (CAGR) of xx% during the historical period (2019-2024), driven by increasing energy demands across various sectors. Market penetration in developing economies is particularly high, while developed markets show steady, albeit slower, growth rates. The adoption of smart grid technologies and the integration of renewable energy sources are key drivers of market evolution. Consumer behavior shifts toward energy efficiency and sustainability are also significantly impacting market growth. The market is expected to maintain a CAGR of xx% during the forecast period (2025-2033), reaching an estimated value of xx Million units by 2033. Technological disruptions, particularly in areas like digitalization and IoT integration, are reshaping market dynamics, creating both opportunities and challenges for established players. The rising adoption of high-voltage switchgear in power transmission and distribution networks further contributes to the market's growth trajectory.

Dominant Regions, Countries, or Segments in Switchgear Industry
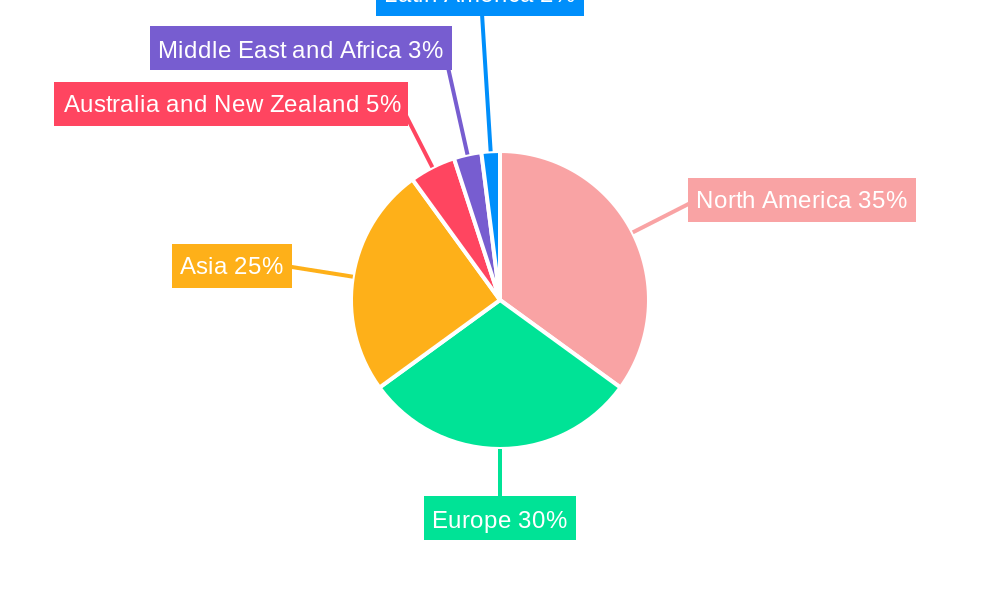
The industrial sector accounts for the largest share of the switchgear market, followed by the commercial and residential sectors. Within the "By Type" segmentation, high-voltage switchgear dominates, driven by large-scale power transmission and distribution projects. Among insulation types, other insulation types show faster growth compared to high-voltage insulation due to improved performance characteristics and cost-effectiveness in specific applications. Geographically, North America and Europe hold significant market share, driven by well-established grids and robust industrial sectors. However, Asia-Pacific shows the highest growth potential due to rapid industrialization and infrastructure development.
Key Drivers:
- Industrial Sector: High demand for reliable power in manufacturing and heavy industries.
- High-Voltage Switchgear: Growth in power transmission and distribution projects.
- Asia-Pacific Region: Rapid industrialization and infrastructure development.
- Other Insulation Types: Cost-effectiveness and improved performance characteristics.
Dominance Factors:
- Market Share: Industrial sector commands the largest share (xx%), followed by commercial (xx%) and residential (xx%).
- Growth Potential: Asia-Pacific demonstrates the highest growth potential due to rapid industrialization.
Switchgear Industry Product Landscape
The switchgear market offers a wide range of products, including air-insulated switchgear (AIS), gas-insulated switchgear (GIS), and solid-state switchgear. Recent innovations focus on improved safety features, enhanced reliability, digitalization capabilities, and reduced environmental impact. Products are designed to meet specific application needs, ranging from low-voltage distribution systems to high-voltage transmission lines. Key performance indicators include voltage ratings, current carrying capacity, interrupting capacity, and environmental resilience. Unique selling propositions often center on improved efficiency, reduced maintenance requirements, and advanced monitoring capabilities, enhanced by digital technologies like IoT integration and remote diagnostics.
Key Drivers, Barriers & Challenges in Switchgear Industry
Key Drivers:
- Increasing demand for reliable power across all sectors.
- Growing adoption of renewable energy sources.
- Expansion of smart grid infrastructure.
- Stringent environmental regulations promoting sustainable solutions.
Challenges:
- Intense competition among established players and emerging entrants.
- Supply chain disruptions impacting raw material availability and production timelines.
- High initial investment costs for advanced switchgear technologies.
- Regulatory hurdles and compliance requirements varying across regions.
Emerging Opportunities in Switchgear Industry
- Growing adoption of smart grid technologies opens opportunities for advanced switchgear systems with enhanced monitoring and control capabilities.
- Demand for renewable energy integration is driving the need for switchgear solutions compatible with various renewable sources.
- Emerging markets in developing economies present untapped potential for switchgear manufacturers.
- Development of compact and lightweight switchgear for distributed generation applications.
Growth Accelerators in the Switchgear Industry
Technological advancements, strategic collaborations, and market expansion into developing economies are significant growth accelerators for the switchgear industry. The integration of digital technologies, such as IoT and AI, enables predictive maintenance, optimizing operational efficiency, and reducing downtime. Strategic partnerships, including collaborations between switchgear manufacturers and energy providers, are fostering innovation and market penetration. Expanding into regions with rapid industrialization and infrastructure development creates significant market opportunities.
Key Players Shaping the Switchgear Industry Market
- ZPUE S
- Eaton Corporation
- Switchgear Company
- ABB Ltd
- General Electric
- Orecco Electric
- Fuji Electric Co Ltd
- Crompton Greaves Power and Industrial Solutions Limited
- Toshiba International Corporation
- Hubbell Incorporated
- Hitachi Ltd
- Mitsubishi Electric Corporation
- Siemens AG
- Schneider Electric SE
- Powell Industries Inc
- Meidensha Corporation
- Havells India Limited
Notable Milestones in Switchgear Industry Sector
- February 2024: Schneider Electric launches SureSeT Medium Voltage (MV) switchgear in Canada, featuring the EvoPacT circuit breaker and digital capabilities for improved efficiency and monitoring.
- October 2023: Siemens expands its eco-friendly, digital medium-voltage switchgear portfolio with the F-gas-free blue GIS primary switchgear, supporting sustainable grid development.
In-Depth Switchgear Industry Market Outlook
The switchgear market is poised for robust growth, driven by continued investment in power infrastructure, the integration of renewable energy, and the increasing demand for digitalized and sustainable solutions. Strategic partnerships, technological breakthroughs, and expansion into new markets will be key to success in this dynamic sector. The market's future potential lies in the development of innovative, efficient, and environmentally friendly switchgear technologies that address the challenges of a rapidly changing energy landscape.
Switchgear Industry Segmentation
-
1. Type
-
1.1. Voltage
- 1.1.1. Low-voltage
- 1.1.2. Medium-voltage
- 1.1.3. High-voltage
-
1.2. Insulation
- 1.2.1. Gas -insulated Switchgear (GIS)
- 1.2.2. Air-insulated Switchgear (AIS)
- 1.2.3. Other Insulation Types
-
1.3. Installation
- 1.3.1. Indoor
- 1.3.2. Outdoor
-
1.1. Voltage
-
2. End-user Industry
- 2.1. Commercial
- 2.2. Residential
- 2.3. Industrial
Switchgear Industry Segmentation By Geography
- 1. North America
- 2. Europe
- 3. Asia
- 4. Australia and New Zealand
- 5. Middle East and Africa
- 6. Latin America
Switchgear Industry REPORT HIGHLIGHTS
| Aspects | Details |
|---|---|
| Study Period | 2019-2033 |
| Base Year | 2024 |
| Estimated Year | 2025 |
| Forecast Period | 2025-2033 |
| Historical Period | 2019-2024 |
| Growth Rate | CAGR of 6.10% from 2019-2033 |
| Segmentation |
|
Table of Contents
- 1. Introduction
- 1.1. Research Scope
- 1.2. Market Segmentation
- 1.3. Research Methodology
- 1.4. Definitions and Assumptions
- 2. Executive Summary
- 2.1. Introduction
- 3. Market Dynamics
- 3.1. Introduction
- 3.2. Market Drivers
- 3.2.1. Growth of Smart Electricity Grid Infrastructure; Growing Focus on Infrastructure and Renewable Energy Sources; Increased Investment in Industrial Production
- 3.3. Market Restrains
- 3.3.1. Stringent Environmental and Safety Regulations; Increasing Competition from the Unorganized Sectors
- 3.4. Market Trends
- 3.4.1. The Residential Segment to Witness a Significant Growth
- 4. Market Factor Analysis
- 4.1. Porters Five Forces
- 4.2. Supply/Value Chain
- 4.3. PESTEL analysis
- 4.4. Market Entropy
- 4.5. Patent/Trademark Analysis
- 5. Global Switchgear Industry Analysis, Insights and Forecast, 2019-2031
- 5.1. Market Analysis, Insights and Forecast - by Type
- 5.1.1. Voltage
- 5.1.1.1. Low-voltage
- 5.1.1.2. Medium-voltage
- 5.1.1.3. High-voltage
- 5.1.2. Insulation
- 5.1.2.1. Gas -insulated Switchgear (GIS)
- 5.1.2.2. Air-insulated Switchgear (AIS)
- 5.1.2.3. Other Insulation Types
- 5.1.3. Installation
- 5.1.3.1. Indoor
- 5.1.3.2. Outdoor
- 5.1.1. Voltage
- 5.2. Market Analysis, Insights and Forecast - by End-user Industry
- 5.2.1. Commercial
- 5.2.2. Residential
- 5.2.3. Industrial
- 5.3. Market Analysis, Insights and Forecast - by Region
- 5.3.1. North America
- 5.3.2. Europe
- 5.3.3. Asia
- 5.3.4. Australia and New Zealand
- 5.3.5. Middle East and Africa
- 5.3.6. Latin America
- 5.1. Market Analysis, Insights and Forecast - by Type
- 6. North America Switchgear Industry Analysis, Insights and Forecast, 2019-2031
- 6.1. Market Analysis, Insights and Forecast - by Type
- 6.1.1. Voltage
- 6.1.1.1. Low-voltage
- 6.1.1.2. Medium-voltage
- 6.1.1.3. High-voltage
- 6.1.2. Insulation
- 6.1.2.1. Gas -insulated Switchgear (GIS)
- 6.1.2.2. Air-insulated Switchgear (AIS)
- 6.1.2.3. Other Insulation Types
- 6.1.3. Installation
- 6.1.3.1. Indoor
- 6.1.3.2. Outdoor
- 6.1.1. Voltage
- 6.2. Market Analysis, Insights and Forecast - by End-user Industry
- 6.2.1. Commercial
- 6.2.2. Residential
- 6.2.3. Industrial
- 6.1. Market Analysis, Insights and Forecast - by Type
- 7. Europe Switchgear Industry Analysis, Insights and Forecast, 2019-2031
- 7.1. Market Analysis, Insights and Forecast - by Type
- 7.1.1. Voltage
- 7.1.1.1. Low-voltage
- 7.1.1.2. Medium-voltage
- 7.1.1.3. High-voltage
- 7.1.2. Insulation
- 7.1.2.1. Gas -insulated Switchgear (GIS)
- 7.1.2.2. Air-insulated Switchgear (AIS)
- 7.1.2.3. Other Insulation Types
- 7.1.3. Installation
- 7.1.3.1. Indoor
- 7.1.3.2. Outdoor
- 7.1.1. Voltage
- 7.2. Market Analysis, Insights and Forecast - by End-user Industry
- 7.2.1. Commercial
- 7.2.2. Residential
- 7.2.3. Industrial
- 7.1. Market Analysis, Insights and Forecast - by Type
- 8. Asia Switchgear Industry Analysis, Insights and Forecast, 2019-2031
- 8.1. Market Analysis, Insights and Forecast - by Type
- 8.1.1. Voltage
- 8.1.1.1. Low-voltage
- 8.1.1.2. Medium-voltage
- 8.1.1.3. High-voltage
- 8.1.2. Insulation
- 8.1.2.1. Gas -insulated Switchgear (GIS)
- 8.1.2.2. Air-insulated Switchgear (AIS)
- 8.1.2.3. Other Insulation Types
- 8.1.3. Installation
- 8.1.3.1. Indoor
- 8.1.3.2. Outdoor
- 8.1.1. Voltage
- 8.2. Market Analysis, Insights and Forecast - by End-user Industry
- 8.2.1. Commercial
- 8.2.2. Residential
- 8.2.3. Industrial
- 8.1. Market Analysis, Insights and Forecast - by Type
- 9. Australia and New Zealand Switchgear Industry Analysis, Insights and Forecast, 2019-2031
- 9.1. Market Analysis, Insights and Forecast - by Type
- 9.1.1. Voltage
- 9.1.1.1. Low-voltage
- 9.1.1.2. Medium-voltage
- 9.1.1.3. High-voltage
- 9.1.2. Insulation
- 9.1.2.1. Gas -insulated Switchgear (GIS)
- 9.1.2.2. Air-insulated Switchgear (AIS)
- 9.1.2.3. Other Insulation Types
- 9.1.3. Installation
- 9.1.3.1. Indoor
- 9.1.3.2. Outdoor
- 9.1.1. Voltage
- 9.2. Market Analysis, Insights and Forecast - by End-user Industry
- 9.2.1. Commercial
- 9.2.2. Residential
- 9.2.3. Industrial
- 9.1. Market Analysis, Insights and Forecast - by Type
- 10. Middle East and Africa Switchgear Industry Analysis, Insights and Forecast, 2019-2031
- 10.1. Market Analysis, Insights and Forecast - by Type
- 10.1.1. Voltage
- 10.1.1.1. Low-voltage
- 10.1.1.2. Medium-voltage
- 10.1.1.3. High-voltage
- 10.1.2. Insulation
- 10.1.2.1. Gas -insulated Switchgear (GIS)
- 10.1.2.2. Air-insulated Switchgear (AIS)
- 10.1.2.3. Other Insulation Types
- 10.1.3. Installation
- 10.1.3.1. Indoor
- 10.1.3.2. Outdoor
- 10.1.1. Voltage
- 10.2. Market Analysis, Insights and Forecast - by End-user Industry
- 10.2.1. Commercial
- 10.2.2. Residential
- 10.2.3. Industrial
- 10.1. Market Analysis, Insights and Forecast - by Type
- 11. Latin America Switchgear Industry Analysis, Insights and Forecast, 2019-2031
- 11.1. Market Analysis, Insights and Forecast - by Type
- 11.1.1. Voltage
- 11.1.1.1. Low-voltage
- 11.1.1.2. Medium-voltage
- 11.1.1.3. High-voltage
- 11.1.2. Insulation
- 11.1.2.1. Gas -insulated Switchgear (GIS)
- 11.1.2.2. Air-insulated Switchgear (AIS)
- 11.1.2.3. Other Insulation Types
- 11.1.3. Installation
- 11.1.3.1. Indoor
- 11.1.3.2. Outdoor
- 11.1.1. Voltage
- 11.2. Market Analysis, Insights and Forecast - by End-user Industry
- 11.2.1. Commercial
- 11.2.2. Residential
- 11.2.3. Industrial
- 11.1. Market Analysis, Insights and Forecast - by Type
- 12. North America Switchgear Industry Analysis, Insights and Forecast, 2019-2031
- 12.1. Market Analysis, Insights and Forecast - By Country/Sub-region
- 12.1.1.
- 13. Europe Switchgear Industry Analysis, Insights and Forecast, 2019-2031
- 13.1. Market Analysis, Insights and Forecast - By Country/Sub-region
- 13.1.1.
- 14. Asia Switchgear Industry Analysis, Insights and Forecast, 2019-2031
- 14.1. Market Analysis, Insights and Forecast - By Country/Sub-region
- 14.1.1.
- 15. Australia and New Zealand Switchgear Industry Analysis, Insights and Forecast, 2019-2031
- 15.1. Market Analysis, Insights and Forecast - By Country/Sub-region
- 15.1.1.
- 16. Middle East and Africa Switchgear Industry Analysis, Insights and Forecast, 2019-2031
- 16.1. Market Analysis, Insights and Forecast - By Country/Sub-region
- 16.1.1.
- 17. Latin America Switchgear Industry Analysis, Insights and Forecast, 2019-2031
- 17.1. Market Analysis, Insights and Forecast - By Country/Sub-region
- 17.1.1.
- 18. Competitive Analysis
- 18.1. Global Market Share Analysis 2024
- 18.2. Company Profiles
- 18.2.1 ZPUE S
- 18.2.1.1. Overview
- 18.2.1.2. Products
- 18.2.1.3. SWOT Analysis
- 18.2.1.4. Recent Developments
- 18.2.1.5. Financials (Based on Availability)
- 18.2.2 Eaton Corporation
- 18.2.2.1. Overview
- 18.2.2.2. Products
- 18.2.2.3. SWOT Analysis
- 18.2.2.4. Recent Developments
- 18.2.2.5. Financials (Based on Availability)
- 18.2.3 Switchgear Company
- 18.2.3.1. Overview
- 18.2.3.2. Products
- 18.2.3.3. SWOT Analysis
- 18.2.3.4. Recent Developments
- 18.2.3.5. Financials (Based on Availability)
- 18.2.4 ABB Ltd
- 18.2.4.1. Overview
- 18.2.4.2. Products
- 18.2.4.3. SWOT Analysis
- 18.2.4.4. Recent Developments
- 18.2.4.5. Financials (Based on Availability)
- 18.2.5 General Electric
- 18.2.5.1. Overview
- 18.2.5.2. Products
- 18.2.5.3. SWOT Analysis
- 18.2.5.4. Recent Developments
- 18.2.5.5. Financials (Based on Availability)
- 18.2.6 Orecco Electric
- 18.2.6.1. Overview
- 18.2.6.2. Products
- 18.2.6.3. SWOT Analysis
- 18.2.6.4. Recent Developments
- 18.2.6.5. Financials (Based on Availability)
- 18.2.7 Fuji Electric Co Ltd
- 18.2.7.1. Overview
- 18.2.7.2. Products
- 18.2.7.3. SWOT Analysis
- 18.2.7.4. Recent Developments
- 18.2.7.5. Financials (Based on Availability)
- 18.2.8 Crompton Greaves Power and Industrial Solutions Limited
- 18.2.8.1. Overview
- 18.2.8.2. Products
- 18.2.8.3. SWOT Analysis
- 18.2.8.4. Recent Developments
- 18.2.8.5. Financials (Based on Availability)
- 18.2.9 Toshiba International Corporation
- 18.2.9.1. Overview
- 18.2.9.2. Products
- 18.2.9.3. SWOT Analysis
- 18.2.9.4. Recent Developments
- 18.2.9.5. Financials (Based on Availability)
- 18.2.10 Hubbell Incorporated
- 18.2.10.1. Overview
- 18.2.10.2. Products
- 18.2.10.3. SWOT Analysis
- 18.2.10.4. Recent Developments
- 18.2.10.5. Financials (Based on Availability)
- 18.2.11 Hitachi Ltd
- 18.2.11.1. Overview
- 18.2.11.2. Products
- 18.2.11.3. SWOT Analysis
- 18.2.11.4. Recent Developments
- 18.2.11.5. Financials (Based on Availability)
- 18.2.12 Mitsubishi Electric Corporation
- 18.2.12.1. Overview
- 18.2.12.2. Products
- 18.2.12.3. SWOT Analysis
- 18.2.12.4. Recent Developments
- 18.2.12.5. Financials (Based on Availability)
- 18.2.13 Siemens AG
- 18.2.13.1. Overview
- 18.2.13.2. Products
- 18.2.13.3. SWOT Analysis
- 18.2.13.4. Recent Developments
- 18.2.13.5. Financials (Based on Availability)
- 18.2.14 Schneider Electric SE
- 18.2.14.1. Overview
- 18.2.14.2. Products
- 18.2.14.3. SWOT Analysis
- 18.2.14.4. Recent Developments
- 18.2.14.5. Financials (Based on Availability)
- 18.2.15 Powell Industries Inc
- 18.2.15.1. Overview
- 18.2.15.2. Products
- 18.2.15.3. SWOT Analysis
- 18.2.15.4. Recent Developments
- 18.2.15.5. Financials (Based on Availability)
- 18.2.16 Meidensha Corporation
- 18.2.16.1. Overview
- 18.2.16.2. Products
- 18.2.16.3. SWOT Analysis
- 18.2.16.4. Recent Developments
- 18.2.16.5. Financials (Based on Availability)
- 18.2.17 Havells India Limited
- 18.2.17.1. Overview
- 18.2.17.2. Products
- 18.2.17.3. SWOT Analysis
- 18.2.17.4. Recent Developments
- 18.2.17.5. Financials (Based on Availability)
- 18.2.1 ZPUE S
List of Figures
- Figure 1: Global Switchgear Industry Revenue Breakdown (Million, %) by Region 2024 & 2032
- Figure 2: North America Switchgear Industry Revenue (Million), by Country 2024 & 2032
- Figure 3: North America Switchgear Industry Revenue Share (%), by Country 2024 & 2032
- Figure 4: Europe Switchgear Industry Revenue (Million), by Country 2024 & 2032
- Figure 5: Europe Switchgear Industry Revenue Share (%), by Country 2024 & 2032
- Figure 6: Asia Switchgear Industry Revenue (Million), by Country 2024 & 2032
- Figure 7: Asia Switchgear Industry Revenue Share (%), by Country 2024 & 2032
- Figure 8: Australia and New Zealand Switchgear Industry Revenue (Million), by Country 2024 & 2032
- Figure 9: Australia and New Zealand Switchgear Industry Revenue Share (%), by Country 2024 & 2032
- Figure 10: Middle East and Africa Switchgear Industry Revenue (Million), by Country 2024 & 2032
- Figure 11: Middle East and Africa Switchgear Industry Revenue Share (%), by Country 2024 & 2032
- Figure 12: Latin America Switchgear Industry Revenue (Million), by Country 2024 & 2032
- Figure 13: Latin America Switchgear Industry Revenue Share (%), by Country 2024 & 2032
- Figure 14: North America Switchgear Industry Revenue (Million), by Type 2024 & 2032
- Figure 15: North America Switchgear Industry Revenue Share (%), by Type 2024 & 2032
- Figure 16: North America Switchgear Industry Revenue (Million), by End-user Industry 2024 & 2032
- Figure 17: North America Switchgear Industry Revenue Share (%), by End-user Industry 2024 & 2032
- Figure 18: North America Switchgear Industry Revenue (Million), by Country 2024 & 2032
- Figure 19: North America Switchgear Industry Revenue Share (%), by Country 2024 & 2032
- Figure 20: Europe Switchgear Industry Revenue (Million), by Type 2024 & 2032
- Figure 21: Europe Switchgear Industry Revenue Share (%), by Type 2024 & 2032
- Figure 22: Europe Switchgear Industry Revenue (Million), by End-user Industry 2024 & 2032
- Figure 23: Europe Switchgear Industry Revenue Share (%), by End-user Industry 2024 & 2032
- Figure 24: Europe Switchgear Industry Revenue (Million), by Country 2024 & 2032
- Figure 25: Europe Switchgear Industry Revenue Share (%), by Country 2024 & 2032
- Figure 26: Asia Switchgear Industry Revenue (Million), by Type 2024 & 2032
- Figure 27: Asia Switchgear Industry Revenue Share (%), by Type 2024 & 2032
- Figure 28: Asia Switchgear Industry Revenue (Million), by End-user Industry 2024 & 2032
- Figure 29: Asia Switchgear Industry Revenue Share (%), by End-user Industry 2024 & 2032
- Figure 30: Asia Switchgear Industry Revenue (Million), by Country 2024 & 2032
- Figure 31: Asia Switchgear Industry Revenue Share (%), by Country 2024 & 2032
- Figure 32: Australia and New Zealand Switchgear Industry Revenue (Million), by Type 2024 & 2032
- Figure 33: Australia and New Zealand Switchgear Industry Revenue Share (%), by Type 2024 & 2032
- Figure 34: Australia and New Zealand Switchgear Industry Revenue (Million), by End-user Industry 2024 & 2032
- Figure 35: Australia and New Zealand Switchgear Industry Revenue Share (%), by End-user Industry 2024 & 2032
- Figure 36: Australia and New Zealand Switchgear Industry Revenue (Million), by Country 2024 & 2032
- Figure 37: Australia and New Zealand Switchgear Industry Revenue Share (%), by Country 2024 & 2032
- Figure 38: Middle East and Africa Switchgear Industry Revenue (Million), by Type 2024 & 2032
- Figure 39: Middle East and Africa Switchgear Industry Revenue Share (%), by Type 2024 & 2032
- Figure 40: Middle East and Africa Switchgear Industry Revenue (Million), by End-user Industry 2024 & 2032
- Figure 41: Middle East and Africa Switchgear Industry Revenue Share (%), by End-user Industry 2024 & 2032
- Figure 42: Middle East and Africa Switchgear Industry Revenue (Million), by Country 2024 & 2032
- Figure 43: Middle East and Africa Switchgear Industry Revenue Share (%), by Country 2024 & 2032
- Figure 44: Latin America Switchgear Industry Revenue (Million), by Type 2024 & 2032
- Figure 45: Latin America Switchgear Industry Revenue Share (%), by Type 2024 & 2032
- Figure 46: Latin America Switchgear Industry Revenue (Million), by End-user Industry 2024 & 2032
- Figure 47: Latin America Switchgear Industry Revenue Share (%), by End-user Industry 2024 & 2032
- Figure 48: Latin America Switchgear Industry Revenue (Million), by Country 2024 & 2032
- Figure 49: Latin America Switchgear Industry Revenue Share (%), by Country 2024 & 2032
List of Tables
- Table 1: Global Switchgear Industry Revenue Million Forecast, by Region 2019 & 2032
- Table 2: Global Switchgear Industry Revenue Million Forecast, by Type 2019 & 2032
- Table 3: Global Switchgear Industry Revenue Million Forecast, by End-user Industry 2019 & 2032
- Table 4: Global Switchgear Industry Revenue Million Forecast, by Region 2019 & 2032
- Table 5: Global Switchgear Industry Revenue Million Forecast, by Country 2019 & 2032
- Table 6: Switchgear Industry Revenue (Million) Forecast, by Application 2019 & 2032
- Table 7: Global Switchgear Industry Revenue Million Forecast, by Country 2019 & 2032
- Table 8: Switchgear Industry Revenue (Million) Forecast, by Application 2019 & 2032
- Table 9: Global Switchgear Industry Revenue Million Forecast, by Country 2019 & 2032
- Table 10: Switchgear Industry Revenue (Million) Forecast, by Application 2019 & 2032
- Table 11: Global Switchgear Industry Revenue Million Forecast, by Country 2019 & 2032
- Table 12: Switchgear Industry Revenue (Million) Forecast, by Application 2019 & 2032
- Table 13: Global Switchgear Industry Revenue Million Forecast, by Country 2019 & 2032
- Table 14: Switchgear Industry Revenue (Million) Forecast, by Application 2019 & 2032
- Table 15: Global Switchgear Industry Revenue Million Forecast, by Country 2019 & 2032
- Table 16: Switchgear Industry Revenue (Million) Forecast, by Application 2019 & 2032
- Table 17: Global Switchgear Industry Revenue Million Forecast, by Type 2019 & 2032
- Table 18: Global Switchgear Industry Revenue Million Forecast, by End-user Industry 2019 & 2032
- Table 19: Global Switchgear Industry Revenue Million Forecast, by Country 2019 & 2032
- Table 20: Global Switchgear Industry Revenue Million Forecast, by Type 2019 & 2032
- Table 21: Global Switchgear Industry Revenue Million Forecast, by End-user Industry 2019 & 2032
- Table 22: Global Switchgear Industry Revenue Million Forecast, by Country 2019 & 2032
- Table 23: Global Switchgear Industry Revenue Million Forecast, by Type 2019 & 2032
- Table 24: Global Switchgear Industry Revenue Million Forecast, by End-user Industry 2019 & 2032
- Table 25: Global Switchgear Industry Revenue Million Forecast, by Country 2019 & 2032
- Table 26: Global Switchgear Industry Revenue Million Forecast, by Type 2019 & 2032
- Table 27: Global Switchgear Industry Revenue Million Forecast, by End-user Industry 2019 & 2032
- Table 28: Global Switchgear Industry Revenue Million Forecast, by Country 2019 & 2032
- Table 29: Global Switchgear Industry Revenue Million Forecast, by Type 2019 & 2032
- Table 30: Global Switchgear Industry Revenue Million Forecast, by End-user Industry 2019 & 2032
- Table 31: Global Switchgear Industry Revenue Million Forecast, by Country 2019 & 2032
- Table 32: Global Switchgear Industry Revenue Million Forecast, by Type 2019 & 2032
- Table 33: Global Switchgear Industry Revenue Million Forecast, by End-user Industry 2019 & 2032
- Table 34: Global Switchgear Industry Revenue Million Forecast, by Country 2019 & 2032
Frequently Asked Questions
1. What is the projected Compound Annual Growth Rate (CAGR) of the Switchgear Industry?
The projected CAGR is approximately 6.10%.
2. Which companies are prominent players in the Switchgear Industry?
Key companies in the market include ZPUE S, Eaton Corporation, Switchgear Company, ABB Ltd, General Electric, Orecco Electric, Fuji Electric Co Ltd, Crompton Greaves Power and Industrial Solutions Limited, Toshiba International Corporation, Hubbell Incorporated, Hitachi Ltd, Mitsubishi Electric Corporation, Siemens AG, Schneider Electric SE, Powell Industries Inc, Meidensha Corporation, Havells India Limited.
3. What are the main segments of the Switchgear Industry?
The market segments include Type, End-user Industry.
4. Can you provide details about the market size?
The market size is estimated to be USD 122.24 Million as of 2022.
5. What are some drivers contributing to market growth?
Growth of Smart Electricity Grid Infrastructure; Growing Focus on Infrastructure and Renewable Energy Sources; Increased Investment in Industrial Production.
6. What are the notable trends driving market growth?
The Residential Segment to Witness a Significant Growth.
7. Are there any restraints impacting market growth?
Stringent Environmental and Safety Regulations; Increasing Competition from the Unorganized Sectors.
8. Can you provide examples of recent developments in the market?
February 2024: Schneider Electric introduced a new product called SureSeT Medium Voltage (MV) switchgear for the Canadian market. This innovative solution, which features the EvoPacT circuit breaker, aims to provide a more efficient and advanced option for primary switchgear applications that can handle digital operations effectively. SureSeT thoroughly monitors thermal, environmental, and circuit breaker health and is durable and compact. SureSeT can minimize downtime and enable faster detection of problems for quicker repairs by offering features like remote control and digital services utilizing real-time data.
9. What pricing options are available for accessing the report?
Pricing options include single-user, multi-user, and enterprise licenses priced at USD 4750, USD 5250, and USD 8750 respectively.
10. Is the market size provided in terms of value or volume?
The market size is provided in terms of value, measured in Million.
11. Are there any specific market keywords associated with the report?
Yes, the market keyword associated with the report is "Switchgear Industry," which aids in identifying and referencing the specific market segment covered.
12. How do I determine which pricing option suits my needs best?
The pricing options vary based on user requirements and access needs. Individual users may opt for single-user licenses, while businesses requiring broader access may choose multi-user or enterprise licenses for cost-effective access to the report.
13. Are there any additional resources or data provided in the Switchgear Industry report?
While the report offers comprehensive insights, it's advisable to review the specific contents or supplementary materials provided to ascertain if additional resources or data are available.
14. How can I stay updated on further developments or reports in the Switchgear Industry?
To stay informed about further developments, trends, and reports in the Switchgear Industry, consider subscribing to industry newsletters, following relevant companies and organizations, or regularly checking reputable industry news sources and publications.
Methodology
Step 1 - Identification of Relevant Samples Size from Population Database


Step 2 - Approaches for Defining Global Market Size (Value, Volume* & Price*)

Note*: In applicable scenarios
Step 3 - Data Sources
Primary Research
- Web Analytics
- Survey Reports
- Research Institute
- Latest Research Reports
- Opinion Leaders
Secondary Research
- Annual Reports
- White Paper
- Latest Press Release
- Industry Association
- Paid Database
- Investor Presentations

Step 4 - Data Triangulation
Involves using different sources of information in order to increase the validity of a study
These sources are likely to be stakeholders in a program - participants, other researchers, program staff, other community members, and so on.
Then we put all data in single framework & apply various statistical tools to find out the dynamic on the market.
During the analysis stage, feedback from the stakeholder groups would be compared to determine areas of agreement as well as areas of divergence
