

Key Insights
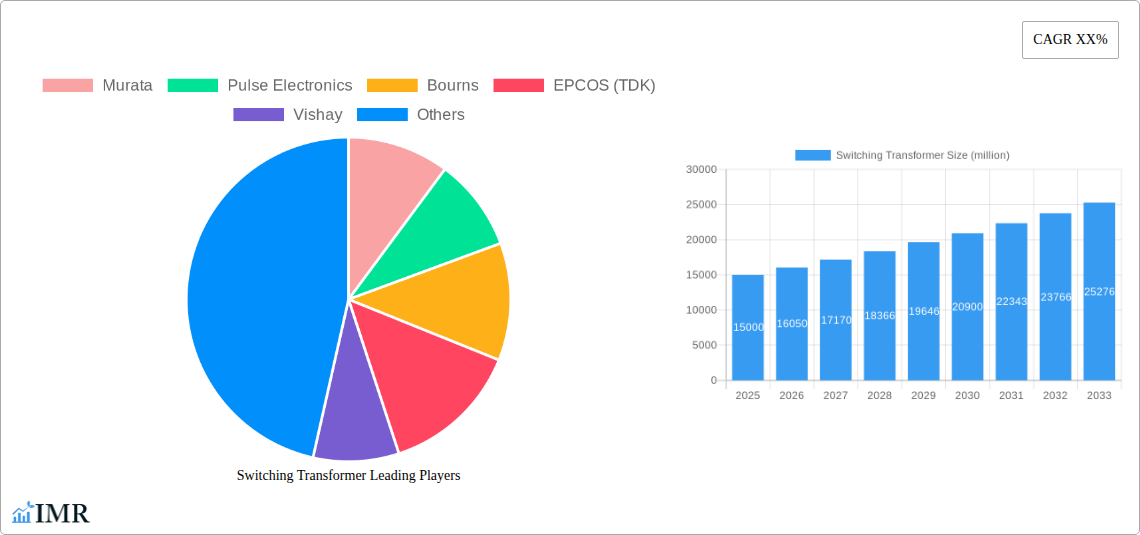
The switching transformer market is experiencing robust growth, driven by the increasing demand for efficient power conversion in various applications. The market's expansion is fueled by the proliferation of electronic devices across sectors like consumer electronics, automotive, industrial automation, and renewable energy. Miniaturization trends, coupled with the need for higher power density and improved energy efficiency, are key drivers pushing innovation within the switching transformer segment. Furthermore, the rise of electric vehicles (EVs) and the growing adoption of renewable energy sources, such as solar and wind power, are significantly contributing to market expansion. We project a Compound Annual Growth Rate (CAGR) of 7% for the global switching transformer market from 2025 to 2033, based on observed market trends and technological advancements. This growth will be underpinned by ongoing advancements in materials science, leading to smaller, more efficient transformers.
However, challenges remain. Cost pressures, particularly regarding raw materials like copper and magnetic cores, represent a significant restraint. Furthermore, the stringent regulatory requirements for electromagnetic interference (EMI) and safety compliance necessitate continuous technological upgrades and increased manufacturing costs. Despite these restraints, the long-term outlook for switching transformers remains positive, driven by the overarching trends in electronic device miniaturization, higher power demands, and the continued growth of key end-use markets. Major players like Murata, Pulse Electronics, Bourns, TDK, Vishay, and others are actively engaged in research and development, fostering innovation and competition within the sector, and ensuring the market's sustained expansion.
Switching Transformer Market Report: 2019-2033
This comprehensive report provides an in-depth analysis of the global switching transformer market, offering invaluable insights for industry professionals, investors, and strategic decision-makers. The study covers the period 2019-2033, with a focus on the forecast period 2025-2033 (Base Year: 2025, Estimated Year: 2025). The report meticulously examines market dynamics, growth trends, regional performance, key players, and emerging opportunities within the parent market of power electronics and the child market of power supplies. With detailed quantitative and qualitative data, this report empowers you to navigate the complexities of this evolving market and make informed strategic choices. Expected market size in 2025 is estimated at xx million units.
Switching Transformer Market Dynamics & Structure
This section analyzes the competitive landscape, technological advancements, and regulatory influences shaping the switching transformer market. We delve into market concentration, exploring the market share held by key players like Murata, Pulse Electronics, Bourns, EPCOS (TDK), Vishay, and others. The report also examines the impact of technological innovations, such as the development of higher-efficiency transformers and miniaturization techniques, on market growth. Regulatory frameworks, including safety standards and environmental regulations, are thoroughly assessed. Furthermore, we investigate the impact of competitive product substitutes and analyze M&A activities within the industry, quantifying deal volumes over the historical period (2019-2024) and projecting future trends. The analysis considers end-user demographics across various sectors and their influence on market demand.
- Market Concentration: High (xx%), with top 5 players holding xx% market share in 2025.
- Technological Innovation: Significant advancements in miniaturization, efficiency, and material science are driving market growth.
- Regulatory Frameworks: Compliance with safety and environmental standards is a key factor influencing product design and market access.
- M&A Activity: xx major M&A deals observed between 2019-2024, with an expected increase in the forecast period.
- Innovation Barriers: High initial investment costs and complex design processes can hinder innovation.
Switching Transformer Growth Trends & Insights
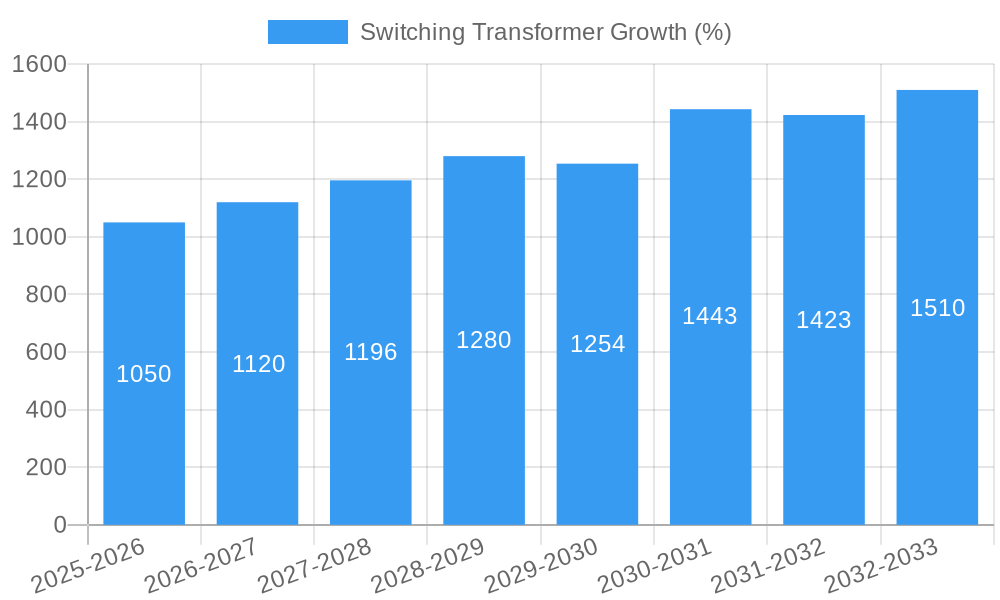
Utilizing a robust analytical methodology (XXX), this section details the evolution of the switching transformer market size from 2019 to 2033. We provide a comprehensive analysis of adoption rates across various end-user segments, highlighting the impact of technological disruptions and shifts in consumer behavior. Key metrics such as Compound Annual Growth Rate (CAGR) and market penetration are provided, offering detailed insights into past performance and future projections. The influence of macroeconomic factors and emerging applications will also be addressed. The report projects a CAGR of xx% from 2025 to 2033, resulting in a market size of xx million units by 2033.
Dominant Regions, Countries, or Segments in Switching Transformer
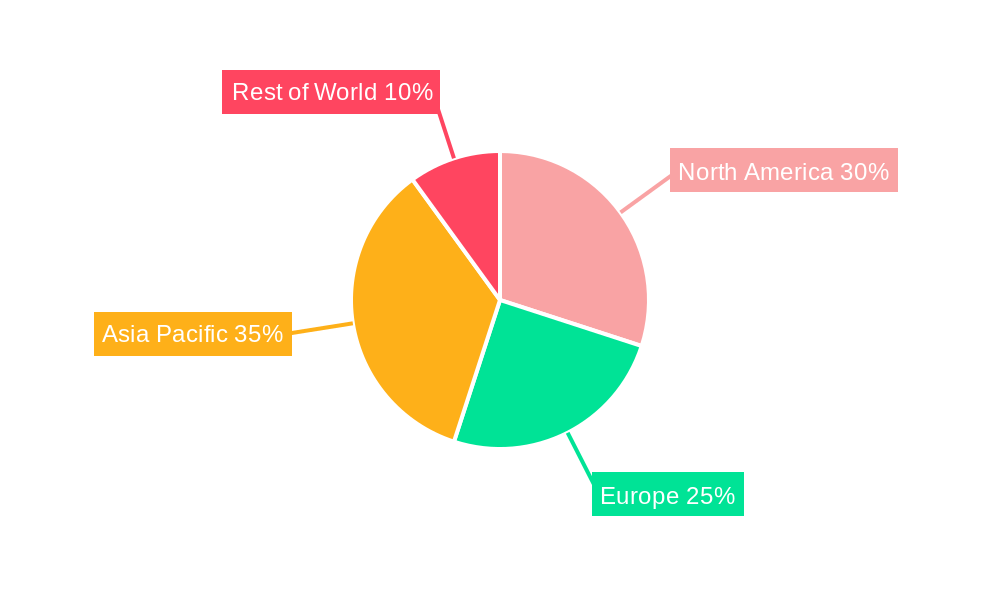
This section pinpoints the leading regions, countries, and segments driving market growth. We analyze the factors contributing to their dominance, including economic policies, infrastructure development, and consumer preferences. Market share and growth potential are assessed for each prominent region and segment. We identify key drivers specific to each leading region, examining the interplay of economic strength, industrial activity, and technological adoption. The report will highlight the strongest regions (e.g., North America, Asia-Pacific etc.) and their respective growth drivers and market share.
- North America: Strong growth driven by robust industrial output and advancements in renewable energy technologies.
- Asia-Pacific: High growth potential driven by rapid industrialization and increasing demand for consumer electronics.
- Europe: Steady growth driven by adoption in industrial automation and smart grid initiatives.
Switching Transformer Product Landscape
This section examines the diverse range of switching transformers available, emphasizing their applications and performance metrics. We highlight product innovations, such as the integration of advanced materials and improved thermal management systems, and their impact on market trends. The unique selling propositions (USPs) of various product types are discussed, along with technological advancements that are reshaping the product landscape. The section will also highlight the various power ratings, packaging, and efficiency levels available.
Key Drivers, Barriers & Challenges in Switching Transformer
This section identifies the key drivers propelling the growth of the switching transformer market, including technological advancements, favorable economic conditions, and supportive government policies. Examples of specific drivers will be provided. We then analyze the key challenges and restraints, such as supply chain disruptions, regulatory hurdles, and competitive pressures, quantifying their impact on market growth.
- Key Drivers: Miniaturization trends, increasing demand for energy-efficient devices, and growth in renewable energy.
- Key Challenges: Fluctuations in raw material prices, stringent regulatory compliance, and intense competition.
Emerging Opportunities in Switching Transformer
This section explores the emerging trends and opportunities within the switching transformer market, focusing on untapped markets, innovative applications, and evolving consumer preferences. We identify potential growth areas and assess their market potential. The report will highlight areas like electric vehicles, smart grids, and industrial automation as significant opportunities.
Growth Accelerators in the Switching Transformer Industry
This section identifies the key factors that will accelerate long-term growth in the switching transformer market. This includes technological breakthroughs, strategic partnerships, and market expansion strategies. The analysis emphasizes how these factors will shape the future of the industry.
Key Players Shaping the Switching Transformer Market
- Murata
- Pulse Electronics
- Bourns
- EPCOS (TDK)
- Vishay
- Sumida
- HALO Electronics
- TE Connectivity
- Eaton
- Omron Electronic
- Hammond Manufacturing
- CHINT Electri
Notable Milestones in Switching Transformer Sector
- 2020: Introduction of a highly efficient switching transformer by Murata.
- 2022: Acquisition of a smaller transformer manufacturer by Vishay.
- 2023: Launch of a new miniaturized switching transformer by Pulse Electronics.
- (Further milestones will be detailed in the full report)
In-Depth Switching Transformer Market Outlook
The switching transformer market is poised for significant growth in the coming years, driven by technological advancements, increasing demand in various end-use sectors, and strategic initiatives by key players. The market's future potential is substantial, presenting significant opportunities for both established players and new entrants. The report highlights strategies for capitalizing on these opportunities and navigating the challenges that lie ahead, leading to a robust and future-proof market presence.
Switching Transformer Segmentation
-
1. Application
- 1.1. Electronics
- 1.2. Power Industry
- 1.3. Industrial
- 1.4. Others
-
2. Types
- 2.1. Push/Pull Switching Transformer
- 2.2. Half Bridge Switching Transformer
- 2.3. Full Bridge Switching Transformer
Switching Transformer Segmentation By Geography
-
1. North America
- 1.1. United States
- 1.2. Canada
- 1.3. Mexico
-
2. South America
- 2.1. Brazil
- 2.2. Argentina
- 2.3. Rest of South America
-
3. Europe
- 3.1. United Kingdom
- 3.2. Germany
- 3.3. France
- 3.4. Italy
- 3.5. Spain
- 3.6. Russia
- 3.7. Benelux
- 3.8. Nordics
- 3.9. Rest of Europe
-
4. Middle East & Africa
- 4.1. Turkey
- 4.2. Israel
- 4.3. GCC
- 4.4. North Africa
- 4.5. South Africa
- 4.6. Rest of Middle East & Africa
-
5. Asia Pacific
- 5.1. China
- 5.2. India
- 5.3. Japan
- 5.4. South Korea
- 5.5. ASEAN
- 5.6. Oceania
- 5.7. Rest of Asia Pacific
Switching Transformer REPORT HIGHLIGHTS
| Aspects | Details |
|---|---|
| Study Period | 2019-2033 |
| Base Year | 2024 |
| Estimated Year | 2025 |
| Forecast Period | 2025-2033 |
| Historical Period | 2019-2024 |
| Growth Rate | CAGR of XX% from 2019-2033 |
| Segmentation |
|
Table of Contents
- 1. Introduction
- 1.1. Research Scope
- 1.2. Market Segmentation
- 1.3. Research Methodology
- 1.4. Definitions and Assumptions
- 2. Executive Summary
- 2.1. Introduction
- 3. Market Dynamics
- 3.1. Introduction
- 3.2. Market Drivers
- 3.3. Market Restrains
- 3.4. Market Trends
- 4. Market Factor Analysis
- 4.1. Porters Five Forces
- 4.2. Supply/Value Chain
- 4.3. PESTEL analysis
- 4.4. Market Entropy
- 4.5. Patent/Trademark Analysis
- 5. Global Switching Transformer Analysis, Insights and Forecast, 2019-2031
- 5.1. Market Analysis, Insights and Forecast - by Application
- 5.1.1. Electronics
- 5.1.2. Power Industry
- 5.1.3. Industrial
- 5.1.4. Others
- 5.2. Market Analysis, Insights and Forecast - by Types
- 5.2.1. Push/Pull Switching Transformer
- 5.2.2. Half Bridge Switching Transformer
- 5.2.3. Full Bridge Switching Transformer
- 5.3. Market Analysis, Insights and Forecast - by Region
- 5.3.1. North America
- 5.3.2. South America
- 5.3.3. Europe
- 5.3.4. Middle East & Africa
- 5.3.5. Asia Pacific
- 5.1. Market Analysis, Insights and Forecast - by Application
- 6. North America Switching Transformer Analysis, Insights and Forecast, 2019-2031
- 6.1. Market Analysis, Insights and Forecast - by Application
- 6.1.1. Electronics
- 6.1.2. Power Industry
- 6.1.3. Industrial
- 6.1.4. Others
- 6.2. Market Analysis, Insights and Forecast - by Types
- 6.2.1. Push/Pull Switching Transformer
- 6.2.2. Half Bridge Switching Transformer
- 6.2.3. Full Bridge Switching Transformer
- 6.1. Market Analysis, Insights and Forecast - by Application
- 7. South America Switching Transformer Analysis, Insights and Forecast, 2019-2031
- 7.1. Market Analysis, Insights and Forecast - by Application
- 7.1.1. Electronics
- 7.1.2. Power Industry
- 7.1.3. Industrial
- 7.1.4. Others
- 7.2. Market Analysis, Insights and Forecast - by Types
- 7.2.1. Push/Pull Switching Transformer
- 7.2.2. Half Bridge Switching Transformer
- 7.2.3. Full Bridge Switching Transformer
- 7.1. Market Analysis, Insights and Forecast - by Application
- 8. Europe Switching Transformer Analysis, Insights and Forecast, 2019-2031
- 8.1. Market Analysis, Insights and Forecast - by Application
- 8.1.1. Electronics
- 8.1.2. Power Industry
- 8.1.3. Industrial
- 8.1.4. Others
- 8.2. Market Analysis, Insights and Forecast - by Types
- 8.2.1. Push/Pull Switching Transformer
- 8.2.2. Half Bridge Switching Transformer
- 8.2.3. Full Bridge Switching Transformer
- 8.1. Market Analysis, Insights and Forecast - by Application
- 9. Middle East & Africa Switching Transformer Analysis, Insights and Forecast, 2019-2031
- 9.1. Market Analysis, Insights and Forecast - by Application
- 9.1.1. Electronics
- 9.1.2. Power Industry
- 9.1.3. Industrial
- 9.1.4. Others
- 9.2. Market Analysis, Insights and Forecast - by Types
- 9.2.1. Push/Pull Switching Transformer
- 9.2.2. Half Bridge Switching Transformer
- 9.2.3. Full Bridge Switching Transformer
- 9.1. Market Analysis, Insights and Forecast - by Application
- 10. Asia Pacific Switching Transformer Analysis, Insights and Forecast, 2019-2031
- 10.1. Market Analysis, Insights and Forecast - by Application
- 10.1.1. Electronics
- 10.1.2. Power Industry
- 10.1.3. Industrial
- 10.1.4. Others
- 10.2. Market Analysis, Insights and Forecast - by Types
- 10.2.1. Push/Pull Switching Transformer
- 10.2.2. Half Bridge Switching Transformer
- 10.2.3. Full Bridge Switching Transformer
- 10.1. Market Analysis, Insights and Forecast - by Application
- 11. Competitive Analysis
- 11.1. Global Market Share Analysis 2024
- 11.2. Company Profiles
- 11.2.1 Murata
- 11.2.1.1. Overview
- 11.2.1.2. Products
- 11.2.1.3. SWOT Analysis
- 11.2.1.4. Recent Developments
- 11.2.1.5. Financials (Based on Availability)
- 11.2.2 Pulse Electronics
- 11.2.2.1. Overview
- 11.2.2.2. Products
- 11.2.2.3. SWOT Analysis
- 11.2.2.4. Recent Developments
- 11.2.2.5. Financials (Based on Availability)
- 11.2.3 Bourns
- 11.2.3.1. Overview
- 11.2.3.2. Products
- 11.2.3.3. SWOT Analysis
- 11.2.3.4. Recent Developments
- 11.2.3.5. Financials (Based on Availability)
- 11.2.4 EPCOS (TDK)
- 11.2.4.1. Overview
- 11.2.4.2. Products
- 11.2.4.3. SWOT Analysis
- 11.2.4.4. Recent Developments
- 11.2.4.5. Financials (Based on Availability)
- 11.2.5 Vishay
- 11.2.5.1. Overview
- 11.2.5.2. Products
- 11.2.5.3. SWOT Analysis
- 11.2.5.4. Recent Developments
- 11.2.5.5. Financials (Based on Availability)
- 11.2.6 Sumida
- 11.2.6.1. Overview
- 11.2.6.2. Products
- 11.2.6.3. SWOT Analysis
- 11.2.6.4. Recent Developments
- 11.2.6.5. Financials (Based on Availability)
- 11.2.7 HALO Electronics
- 11.2.7.1. Overview
- 11.2.7.2. Products
- 11.2.7.3. SWOT Analysis
- 11.2.7.4. Recent Developments
- 11.2.7.5. Financials (Based on Availability)
- 11.2.8 TE Connectivity
- 11.2.8.1. Overview
- 11.2.8.2. Products
- 11.2.8.3. SWOT Analysis
- 11.2.8.4. Recent Developments
- 11.2.8.5. Financials (Based on Availability)
- 11.2.9 Eaton
- 11.2.9.1. Overview
- 11.2.9.2. Products
- 11.2.9.3. SWOT Analysis
- 11.2.9.4. Recent Developments
- 11.2.9.5. Financials (Based on Availability)
- 11.2.10 Omron Electronic
- 11.2.10.1. Overview
- 11.2.10.2. Products
- 11.2.10.3. SWOT Analysis
- 11.2.10.4. Recent Developments
- 11.2.10.5. Financials (Based on Availability)
- 11.2.11 Hammond Manufacturing
- 11.2.11.1. Overview
- 11.2.11.2. Products
- 11.2.11.3. SWOT Analysis
- 11.2.11.4. Recent Developments
- 11.2.11.5. Financials (Based on Availability)
- 11.2.12 CHINT Electri
- 11.2.12.1. Overview
- 11.2.12.2. Products
- 11.2.12.3. SWOT Analysis
- 11.2.12.4. Recent Developments
- 11.2.12.5. Financials (Based on Availability)
- 11.2.1 Murata
List of Figures
- Figure 1: Global Switching Transformer Revenue Breakdown (million, %) by Region 2024 & 2032
- Figure 2: Global Switching Transformer Volume Breakdown (K, %) by Region 2024 & 2032
- Figure 3: North America Switching Transformer Revenue (million), by Application 2024 & 2032
- Figure 4: North America Switching Transformer Volume (K), by Application 2024 & 2032
- Figure 5: North America Switching Transformer Revenue Share (%), by Application 2024 & 2032
- Figure 6: North America Switching Transformer Volume Share (%), by Application 2024 & 2032
- Figure 7: North America Switching Transformer Revenue (million), by Types 2024 & 2032
- Figure 8: North America Switching Transformer Volume (K), by Types 2024 & 2032
- Figure 9: North America Switching Transformer Revenue Share (%), by Types 2024 & 2032
- Figure 10: North America Switching Transformer Volume Share (%), by Types 2024 & 2032
- Figure 11: North America Switching Transformer Revenue (million), by Country 2024 & 2032
- Figure 12: North America Switching Transformer Volume (K), by Country 2024 & 2032
- Figure 13: North America Switching Transformer Revenue Share (%), by Country 2024 & 2032
- Figure 14: North America Switching Transformer Volume Share (%), by Country 2024 & 2032
- Figure 15: South America Switching Transformer Revenue (million), by Application 2024 & 2032
- Figure 16: South America Switching Transformer Volume (K), by Application 2024 & 2032
- Figure 17: South America Switching Transformer Revenue Share (%), by Application 2024 & 2032
- Figure 18: South America Switching Transformer Volume Share (%), by Application 2024 & 2032
- Figure 19: South America Switching Transformer Revenue (million), by Types 2024 & 2032
- Figure 20: South America Switching Transformer Volume (K), by Types 2024 & 2032
- Figure 21: South America Switching Transformer Revenue Share (%), by Types 2024 & 2032
- Figure 22: South America Switching Transformer Volume Share (%), by Types 2024 & 2032
- Figure 23: South America Switching Transformer Revenue (million), by Country 2024 & 2032
- Figure 24: South America Switching Transformer Volume (K), by Country 2024 & 2032
- Figure 25: South America Switching Transformer Revenue Share (%), by Country 2024 & 2032
- Figure 26: South America Switching Transformer Volume Share (%), by Country 2024 & 2032
- Figure 27: Europe Switching Transformer Revenue (million), by Application 2024 & 2032
- Figure 28: Europe Switching Transformer Volume (K), by Application 2024 & 2032
- Figure 29: Europe Switching Transformer Revenue Share (%), by Application 2024 & 2032
- Figure 30: Europe Switching Transformer Volume Share (%), by Application 2024 & 2032
- Figure 31: Europe Switching Transformer Revenue (million), by Types 2024 & 2032
- Figure 32: Europe Switching Transformer Volume (K), by Types 2024 & 2032
- Figure 33: Europe Switching Transformer Revenue Share (%), by Types 2024 & 2032
- Figure 34: Europe Switching Transformer Volume Share (%), by Types 2024 & 2032
- Figure 35: Europe Switching Transformer Revenue (million), by Country 2024 & 2032
- Figure 36: Europe Switching Transformer Volume (K), by Country 2024 & 2032
- Figure 37: Europe Switching Transformer Revenue Share (%), by Country 2024 & 2032
- Figure 38: Europe Switching Transformer Volume Share (%), by Country 2024 & 2032
- Figure 39: Middle East & Africa Switching Transformer Revenue (million), by Application 2024 & 2032
- Figure 40: Middle East & Africa Switching Transformer Volume (K), by Application 2024 & 2032
- Figure 41: Middle East & Africa Switching Transformer Revenue Share (%), by Application 2024 & 2032
- Figure 42: Middle East & Africa Switching Transformer Volume Share (%), by Application 2024 & 2032
- Figure 43: Middle East & Africa Switching Transformer Revenue (million), by Types 2024 & 2032
- Figure 44: Middle East & Africa Switching Transformer Volume (K), by Types 2024 & 2032
- Figure 45: Middle East & Africa Switching Transformer Revenue Share (%), by Types 2024 & 2032
- Figure 46: Middle East & Africa Switching Transformer Volume Share (%), by Types 2024 & 2032
- Figure 47: Middle East & Africa Switching Transformer Revenue (million), by Country 2024 & 2032
- Figure 48: Middle East & Africa Switching Transformer Volume (K), by Country 2024 & 2032
- Figure 49: Middle East & Africa Switching Transformer Revenue Share (%), by Country 2024 & 2032
- Figure 50: Middle East & Africa Switching Transformer Volume Share (%), by Country 2024 & 2032
- Figure 51: Asia Pacific Switching Transformer Revenue (million), by Application 2024 & 2032
- Figure 52: Asia Pacific Switching Transformer Volume (K), by Application 2024 & 2032
- Figure 53: Asia Pacific Switching Transformer Revenue Share (%), by Application 2024 & 2032
- Figure 54: Asia Pacific Switching Transformer Volume Share (%), by Application 2024 & 2032
- Figure 55: Asia Pacific Switching Transformer Revenue (million), by Types 2024 & 2032
- Figure 56: Asia Pacific Switching Transformer Volume (K), by Types 2024 & 2032
- Figure 57: Asia Pacific Switching Transformer Revenue Share (%), by Types 2024 & 2032
- Figure 58: Asia Pacific Switching Transformer Volume Share (%), by Types 2024 & 2032
- Figure 59: Asia Pacific Switching Transformer Revenue (million), by Country 2024 & 2032
- Figure 60: Asia Pacific Switching Transformer Volume (K), by Country 2024 & 2032
- Figure 61: Asia Pacific Switching Transformer Revenue Share (%), by Country 2024 & 2032
- Figure 62: Asia Pacific Switching Transformer Volume Share (%), by Country 2024 & 2032
List of Tables
- Table 1: Global Switching Transformer Revenue million Forecast, by Region 2019 & 2032
- Table 2: Global Switching Transformer Volume K Forecast, by Region 2019 & 2032
- Table 3: Global Switching Transformer Revenue million Forecast, by Application 2019 & 2032
- Table 4: Global Switching Transformer Volume K Forecast, by Application 2019 & 2032
- Table 5: Global Switching Transformer Revenue million Forecast, by Types 2019 & 2032
- Table 6: Global Switching Transformer Volume K Forecast, by Types 2019 & 2032
- Table 7: Global Switching Transformer Revenue million Forecast, by Region 2019 & 2032
- Table 8: Global Switching Transformer Volume K Forecast, by Region 2019 & 2032
- Table 9: Global Switching Transformer Revenue million Forecast, by Application 2019 & 2032
- Table 10: Global Switching Transformer Volume K Forecast, by Application 2019 & 2032
- Table 11: Global Switching Transformer Revenue million Forecast, by Types 2019 & 2032
- Table 12: Global Switching Transformer Volume K Forecast, by Types 2019 & 2032
- Table 13: Global Switching Transformer Revenue million Forecast, by Country 2019 & 2032
- Table 14: Global Switching Transformer Volume K Forecast, by Country 2019 & 2032
- Table 15: United States Switching Transformer Revenue (million) Forecast, by Application 2019 & 2032
- Table 16: United States Switching Transformer Volume (K) Forecast, by Application 2019 & 2032
- Table 17: Canada Switching Transformer Revenue (million) Forecast, by Application 2019 & 2032
- Table 18: Canada Switching Transformer Volume (K) Forecast, by Application 2019 & 2032
- Table 19: Mexico Switching Transformer Revenue (million) Forecast, by Application 2019 & 2032
- Table 20: Mexico Switching Transformer Volume (K) Forecast, by Application 2019 & 2032
- Table 21: Global Switching Transformer Revenue million Forecast, by Application 2019 & 2032
- Table 22: Global Switching Transformer Volume K Forecast, by Application 2019 & 2032
- Table 23: Global Switching Transformer Revenue million Forecast, by Types 2019 & 2032
- Table 24: Global Switching Transformer Volume K Forecast, by Types 2019 & 2032
- Table 25: Global Switching Transformer Revenue million Forecast, by Country 2019 & 2032
- Table 26: Global Switching Transformer Volume K Forecast, by Country 2019 & 2032
- Table 27: Brazil Switching Transformer Revenue (million) Forecast, by Application 2019 & 2032
- Table 28: Brazil Switching Transformer Volume (K) Forecast, by Application 2019 & 2032
- Table 29: Argentina Switching Transformer Revenue (million) Forecast, by Application 2019 & 2032
- Table 30: Argentina Switching Transformer Volume (K) Forecast, by Application 2019 & 2032
- Table 31: Rest of South America Switching Transformer Revenue (million) Forecast, by Application 2019 & 2032
- Table 32: Rest of South America Switching Transformer Volume (K) Forecast, by Application 2019 & 2032
- Table 33: Global Switching Transformer Revenue million Forecast, by Application 2019 & 2032
- Table 34: Global Switching Transformer Volume K Forecast, by Application 2019 & 2032
- Table 35: Global Switching Transformer Revenue million Forecast, by Types 2019 & 2032
- Table 36: Global Switching Transformer Volume K Forecast, by Types 2019 & 2032
- Table 37: Global Switching Transformer Revenue million Forecast, by Country 2019 & 2032
- Table 38: Global Switching Transformer Volume K Forecast, by Country 2019 & 2032
- Table 39: United Kingdom Switching Transformer Revenue (million) Forecast, by Application 2019 & 2032
- Table 40: United Kingdom Switching Transformer Volume (K) Forecast, by Application 2019 & 2032
- Table 41: Germany Switching Transformer Revenue (million) Forecast, by Application 2019 & 2032
- Table 42: Germany Switching Transformer Volume (K) Forecast, by Application 2019 & 2032
- Table 43: France Switching Transformer Revenue (million) Forecast, by Application 2019 & 2032
- Table 44: France Switching Transformer Volume (K) Forecast, by Application 2019 & 2032
- Table 45: Italy Switching Transformer Revenue (million) Forecast, by Application 2019 & 2032
- Table 46: Italy Switching Transformer Volume (K) Forecast, by Application 2019 & 2032
- Table 47: Spain Switching Transformer Revenue (million) Forecast, by Application 2019 & 2032
- Table 48: Spain Switching Transformer Volume (K) Forecast, by Application 2019 & 2032
- Table 49: Russia Switching Transformer Revenue (million) Forecast, by Application 2019 & 2032
- Table 50: Russia Switching Transformer Volume (K) Forecast, by Application 2019 & 2032
- Table 51: Benelux Switching Transformer Revenue (million) Forecast, by Application 2019 & 2032
- Table 52: Benelux Switching Transformer Volume (K) Forecast, by Application 2019 & 2032
- Table 53: Nordics Switching Transformer Revenue (million) Forecast, by Application 2019 & 2032
- Table 54: Nordics Switching Transformer Volume (K) Forecast, by Application 2019 & 2032
- Table 55: Rest of Europe Switching Transformer Revenue (million) Forecast, by Application 2019 & 2032
- Table 56: Rest of Europe Switching Transformer Volume (K) Forecast, by Application 2019 & 2032
- Table 57: Global Switching Transformer Revenue million Forecast, by Application 2019 & 2032
- Table 58: Global Switching Transformer Volume K Forecast, by Application 2019 & 2032
- Table 59: Global Switching Transformer Revenue million Forecast, by Types 2019 & 2032
- Table 60: Global Switching Transformer Volume K Forecast, by Types 2019 & 2032
- Table 61: Global Switching Transformer Revenue million Forecast, by Country 2019 & 2032
- Table 62: Global Switching Transformer Volume K Forecast, by Country 2019 & 2032
- Table 63: Turkey Switching Transformer Revenue (million) Forecast, by Application 2019 & 2032
- Table 64: Turkey Switching Transformer Volume (K) Forecast, by Application 2019 & 2032
- Table 65: Israel Switching Transformer Revenue (million) Forecast, by Application 2019 & 2032
- Table 66: Israel Switching Transformer Volume (K) Forecast, by Application 2019 & 2032
- Table 67: GCC Switching Transformer Revenue (million) Forecast, by Application 2019 & 2032
- Table 68: GCC Switching Transformer Volume (K) Forecast, by Application 2019 & 2032
- Table 69: North Africa Switching Transformer Revenue (million) Forecast, by Application 2019 & 2032
- Table 70: North Africa Switching Transformer Volume (K) Forecast, by Application 2019 & 2032
- Table 71: South Africa Switching Transformer Revenue (million) Forecast, by Application 2019 & 2032
- Table 72: South Africa Switching Transformer Volume (K) Forecast, by Application 2019 & 2032
- Table 73: Rest of Middle East & Africa Switching Transformer Revenue (million) Forecast, by Application 2019 & 2032
- Table 74: Rest of Middle East & Africa Switching Transformer Volume (K) Forecast, by Application 2019 & 2032
- Table 75: Global Switching Transformer Revenue million Forecast, by Application 2019 & 2032
- Table 76: Global Switching Transformer Volume K Forecast, by Application 2019 & 2032
- Table 77: Global Switching Transformer Revenue million Forecast, by Types 2019 & 2032
- Table 78: Global Switching Transformer Volume K Forecast, by Types 2019 & 2032
- Table 79: Global Switching Transformer Revenue million Forecast, by Country 2019 & 2032
- Table 80: Global Switching Transformer Volume K Forecast, by Country 2019 & 2032
- Table 81: China Switching Transformer Revenue (million) Forecast, by Application 2019 & 2032
- Table 82: China Switching Transformer Volume (K) Forecast, by Application 2019 & 2032
- Table 83: India Switching Transformer Revenue (million) Forecast, by Application 2019 & 2032
- Table 84: India Switching Transformer Volume (K) Forecast, by Application 2019 & 2032
- Table 85: Japan Switching Transformer Revenue (million) Forecast, by Application 2019 & 2032
- Table 86: Japan Switching Transformer Volume (K) Forecast, by Application 2019 & 2032
- Table 87: South Korea Switching Transformer Revenue (million) Forecast, by Application 2019 & 2032
- Table 88: South Korea Switching Transformer Volume (K) Forecast, by Application 2019 & 2032
- Table 89: ASEAN Switching Transformer Revenue (million) Forecast, by Application 2019 & 2032
- Table 90: ASEAN Switching Transformer Volume (K) Forecast, by Application 2019 & 2032
- Table 91: Oceania Switching Transformer Revenue (million) Forecast, by Application 2019 & 2032
- Table 92: Oceania Switching Transformer Volume (K) Forecast, by Application 2019 & 2032
- Table 93: Rest of Asia Pacific Switching Transformer Revenue (million) Forecast, by Application 2019 & 2032
- Table 94: Rest of Asia Pacific Switching Transformer Volume (K) Forecast, by Application 2019 & 2032
Frequently Asked Questions
1. What is the projected Compound Annual Growth Rate (CAGR) of the Switching Transformer?
The projected CAGR is approximately XX%.
2. Which companies are prominent players in the Switching Transformer?
Key companies in the market include Murata, Pulse Electronics, Bourns, EPCOS (TDK), Vishay, Sumida, HALO Electronics, TE Connectivity, Eaton, Omron Electronic, Hammond Manufacturing, CHINT Electri.
3. What are the main segments of the Switching Transformer?
The market segments include Application, Types.
4. Can you provide details about the market size?
The market size is estimated to be USD XXX million as of 2022.
5. What are some drivers contributing to market growth?
N/A
6. What are the notable trends driving market growth?
N/A
7. Are there any restraints impacting market growth?
N/A
8. Can you provide examples of recent developments in the market?
N/A
9. What pricing options are available for accessing the report?
Pricing options include single-user, multi-user, and enterprise licenses priced at USD 3350.00, USD 5025.00, and USD 6700.00 respectively.
10. Is the market size provided in terms of value or volume?
The market size is provided in terms of value, measured in million and volume, measured in K.
11. Are there any specific market keywords associated with the report?
Yes, the market keyword associated with the report is "Switching Transformer," which aids in identifying and referencing the specific market segment covered.
12. How do I determine which pricing option suits my needs best?
The pricing options vary based on user requirements and access needs. Individual users may opt for single-user licenses, while businesses requiring broader access may choose multi-user or enterprise licenses for cost-effective access to the report.
13. Are there any additional resources or data provided in the Switching Transformer report?
While the report offers comprehensive insights, it's advisable to review the specific contents or supplementary materials provided to ascertain if additional resources or data are available.
14. How can I stay updated on further developments or reports in the Switching Transformer?
To stay informed about further developments, trends, and reports in the Switching Transformer, consider subscribing to industry newsletters, following relevant companies and organizations, or regularly checking reputable industry news sources and publications.
Methodology
Step 1 - Identification of Relevant Samples Size from Population Database


Step 2 - Approaches for Defining Global Market Size (Value, Volume* & Price*)

Note*: In applicable scenarios
Step 3 - Data Sources
Primary Research
- Web Analytics
- Survey Reports
- Research Institute
- Latest Research Reports
- Opinion Leaders
Secondary Research
- Annual Reports
- White Paper
- Latest Press Release
- Industry Association
- Paid Database
- Investor Presentations

Step 4 - Data Triangulation
Involves using different sources of information in order to increase the validity of a study
These sources are likely to be stakeholders in a program - participants, other researchers, program staff, other community members, and so on.
Then we put all data in single framework & apply various statistical tools to find out the dynamic on the market.
During the analysis stage, feedback from the stakeholder groups would be compared to determine areas of agreement as well as areas of divergence
