

Key Insights
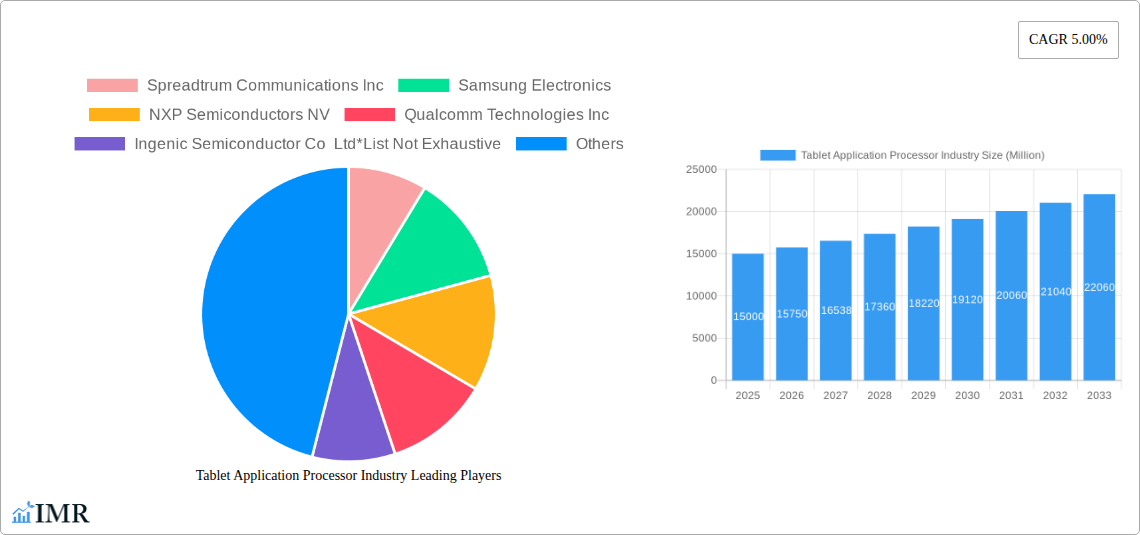
The tablet application processor (AP) market, valued at approximately $XX million in 2025, is projected to experience a Compound Annual Growth Rate (CAGR) of 5% from 2025 to 2033. This growth is driven by several factors, including the increasing demand for high-performance tablets for both personal and commercial use, advancements in processor technology enabling enhanced multimedia capabilities and improved battery life, and the rising adoption of tablets in education and healthcare sectors. The market is segmented by operating system (Android, iOS, Windows), end-user (household, commercial), type (32-bit, 64-bit), and core type (single-core, multi-core). The Android operating system currently dominates the market share, fueled by its open-source nature and affordability, while the demand for high-performance processors in commercial applications is driving growth in the multi-core segment. Key players such as Qualcomm, MediaTek, Apple, and Samsung Electronics are driving innovation and competition within the market, continuously releasing updated processors with improved performance and features. Regional analysis shows that North America and Asia-Pacific are currently the largest markets, driven by high consumer spending and significant manufacturing hubs, respectively. However, emerging markets in regions like Latin America and Africa are expected to demonstrate robust growth in the coming years.
While the market exhibits significant potential, certain restraints exist. The increasing saturation of the tablet market in developed regions and the price sensitivity of consumers in emerging markets present challenges to sustained high growth. Furthermore, competition from other mobile computing devices such as laptops and smartphones could influence the overall market demand for tablets. However, the ongoing development of specialized tablet applications, such as augmented reality and virtual reality applications, and the continued integration of advanced technologies such as 5G connectivity and AI capabilities into tablets, are expected to mitigate these challenges and drive sustained growth in the forecast period. The diversification of applications and the incorporation of new technologies into tablets will be critical in shaping the future trajectory of the tablet application processor market.
Tablet Application Processor Industry Market Report: 2019-2033
This comprehensive report provides a detailed analysis of the Tablet Application Processor industry, covering market dynamics, growth trends, regional dominance, product landscape, key players, and future outlook. The study period spans from 2019 to 2033, with a base year of 2025 and a forecast period from 2025 to 2033. The report utilizes data from 2019-2024 as the historical period and leverages extensive research to provide in-depth insights into this rapidly evolving market, valued at xx million units in 2025.
Tablet Application Processor Industry Market Dynamics & Structure
The tablet application processor market is characterized by a moderately concentrated landscape, with key players like Qualcomm Technologies Inc, MediaTek Inc, and Apple Inc holding significant market share. Technological innovation, particularly in areas such as AI processing and 5G connectivity, are major drivers. Regulatory frameworks concerning data privacy and security significantly influence market dynamics. Competition from alternative technologies, such as cloud-based processing, presents a challenge. The market is segmented by operating system (Android, Apple iOS, Windows), end-user (household, commercial, other), type (32-bit, 64-bit, other), and core type (single-core, multi-core). M&A activity has been relatively moderate in recent years, with xx deals recorded between 2019 and 2024.
- Market Concentration: Moderately concentrated, with top 5 players holding approximately xx% market share in 2025.
- Technological Innovation: Focus on AI, 5G, and improved power efficiency are key drivers.
- Regulatory Frameworks: Data privacy regulations impact processor design and data handling.
- Competitive Substitutes: Cloud-based processing and other computing paradigms pose a threat.
- End-User Demographics: Household users dominate, followed by commercial and other end-users.
- M&A Trends: xx M&A deals from 2019-2024, indicating moderate consolidation.
Tablet Application Processor Industry Growth Trends & Insights
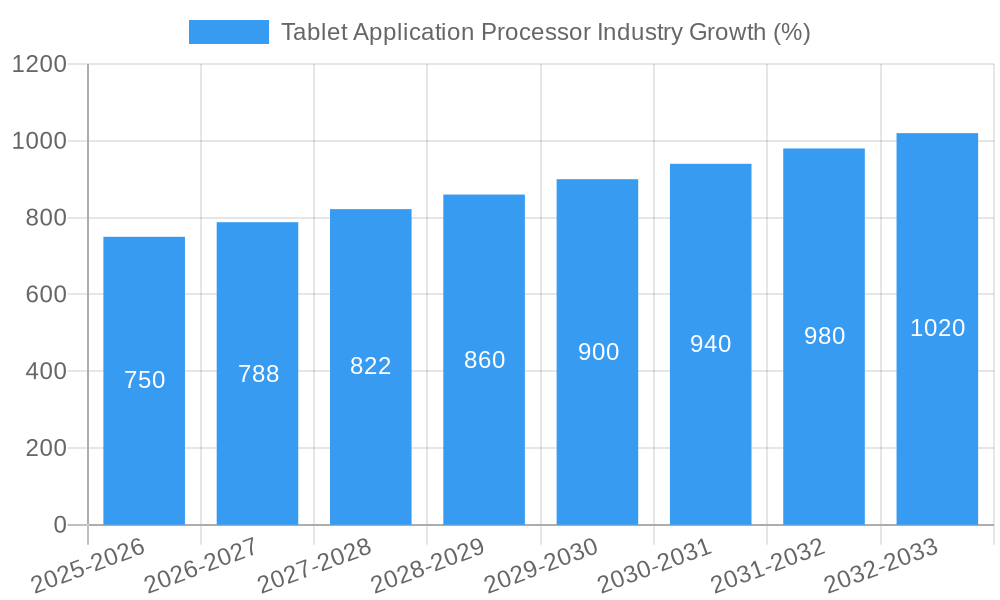
The tablet application processor market experienced a CAGR of xx% during the historical period (2019-2024), driven primarily by the increasing adoption of tablets across various segments. The market is expected to continue its growth trajectory, reaching xx million units by 2033 with a projected CAGR of xx% during the forecast period (2025-2033). This growth is fueled by advancements in processor technology, declining prices, and increasing demand for high-performance tablets in education, entertainment, and professional sectors. The shift towards higher-resolution displays and more power-efficient processors is also contributing to market expansion. Consumer behavior changes, such as increased mobile productivity needs, further support market growth. Technological disruptions, particularly the integration of AI and 5G capabilities, are poised to accelerate market expansion in the coming years.
Dominant Regions, Countries, or Segments in Tablet Application Processor Industry
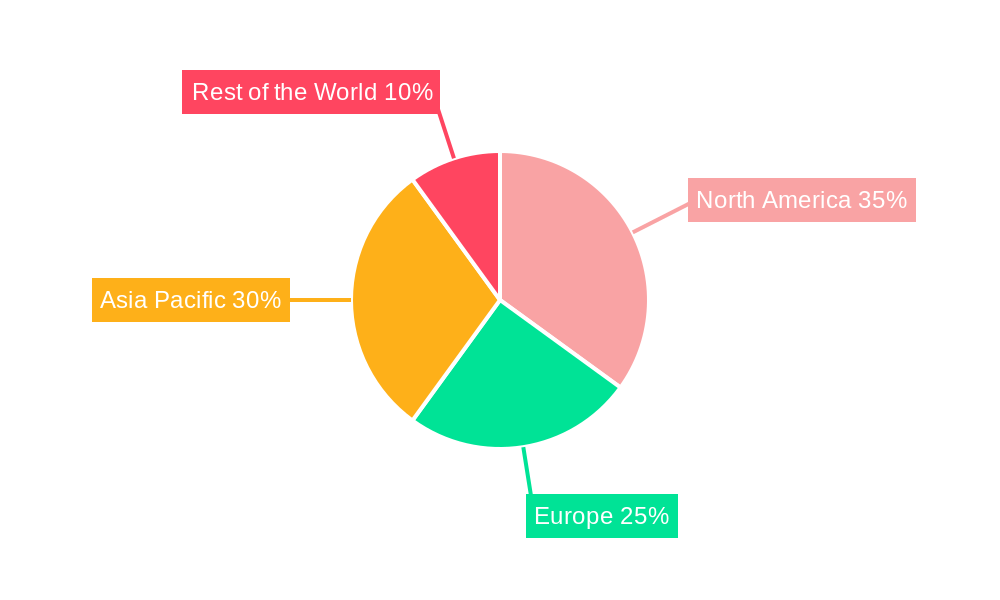
The North American region currently holds the largest market share, followed by Asia-Pacific, driven by strong demand from household consumers and robust commercial deployment. Within operating systems, Android dominates with xx% market share in 2025, followed by Apple iOS at xx%. The household segment dominates end-user applications. The 64-bit processor type is gaining traction, while multi-core processors are the industry standard.
- Key Drivers (North America): Strong consumer demand, high disposable income, robust technological infrastructure.
- Key Drivers (Asia-Pacific): Rapid urbanization, increasing smartphone penetration, rising middle class.
- Segment Dominance: Android OS, Household End-User, 64-bit processors, Multi-core processors.
- Growth Potential: Asia-Pacific presents significant long-term growth opportunities.
Tablet Application Processor Industry Product Landscape
The tablet application processor market features a diverse range of products, categorized by core count, clock speed, and integrated features. Recent innovations include advanced AI processing capabilities, integrated 5G modems, and improved power efficiency. Manufacturers are focusing on differentiating their products through unique selling propositions, such as enhanced graphics processing, improved battery life, and enhanced security features. The focus is on delivering high-performance processors at competitive price points to cater to diverse market needs.
Key Drivers, Barriers & Challenges in Tablet Application Processor Industry
Key Drivers: Increasing demand for high-performance tablets, technological advancements (AI, 5G), decreasing component costs, and growing adoption in education and professional sectors.
Challenges: Intense competition, supply chain disruptions (semiconductor shortages), regulatory hurdles related to data privacy, and the need for continuous innovation to maintain a competitive edge. These challenges have impacted production and resulted in an estimated xx% decrease in projected output in 2024.
Emerging Opportunities in Tablet Application Processor Industry
Emerging opportunities lie in the development of specialized processors for niche markets, such as augmented reality (AR) and virtual reality (VR) applications, as well as the integration of advanced features like biometric security. The increasing demand for lightweight and power-efficient processors for foldable tablets and other emerging form factors presents a significant opportunity. Expansion into untapped markets, such as developing economies, also presents strong potential.
Growth Accelerators in the Tablet Application Processor Industry
Long-term growth will be driven by technological breakthroughs such as more energy-efficient designs and the integration of advanced AI features. Strategic partnerships between processor manufacturers and tablet OEMs will further accelerate market expansion. Market expansion into new geographic regions and the development of innovative applications will also contribute to future growth.
Key Players Shaping the Tablet Application Processor Industry Market
- Spreadtrum Communications Inc
- Samsung Electronics
- NXP Semiconductors NV
- Qualcomm Technologies Inc
- Ingenic Semiconductor Co Ltd
- Texas Instruments Incorporated
- MediaTek Inc
- Nvidia Corporation
- Apple Inc
- HiSilicon Technologies Co Ltd
Notable Milestones in Tablet Application Processor Industry Sector
- 2021 Q3: Qualcomm announces Snapdragon 8cx Gen 3, focusing on AI and improved battery life.
- 2022 Q1: MediaTek launches the Dimensity 9000, targeting high-end tablet applications.
- 2023 Q2: Apple releases the M2 chip, setting a new benchmark in tablet processor performance. (Further milestones to be added based on available data)
In-Depth Tablet Application Processor Industry Market Outlook
The tablet application processor market is poised for sustained growth driven by ongoing technological innovations, increasing demand for powerful and energy-efficient processors, and expanding market penetration across diverse segments. Strategic alliances and expansion into untapped markets will be crucial for companies seeking to capitalize on future opportunities. The market is projected to reach xx million units by 2033, indicating a significant potential for growth and investment in this dynamic sector.
Tablet Application Processor Industry Segmentation
-
1. Type
- 1.1. 32 Bit
- 1.2. 64 Bit
- 1.3. Other Types
-
2. Core Type
- 2.1. Single Core
- 2.2. Multi-core
-
3. Operating System
- 3.1. Android
- 3.2. Apple iOS
- 3.3. Windows
-
4. End User
- 4.1. Household
- 4.2. Commercial
- 4.3. Other End Users
Tablet Application Processor Industry Segmentation By Geography
-
1. North America
- 1.1. United States
- 1.2. Canada
-
2. Europe
- 2.1. Germany
- 2.2. United Kingdom
- 2.3. France
- 2.4. Italy
- 2.5. Rest of Europe
-
3. Asia Pacific
- 3.1. India
- 3.2. China
- 3.3. Japan
- 3.4. South Korea
- 3.5. Rest of Asia Pacific
-
4. Rest of the World
- 4.1. Latin America
- 4.2. Middle East and Africa
Tablet Application Processor Industry REPORT HIGHLIGHTS
| Aspects | Details |
|---|---|
| Study Period | 2019-2033 |
| Base Year | 2024 |
| Estimated Year | 2025 |
| Forecast Period | 2025-2033 |
| Historical Period | 2019-2024 |
| Growth Rate | CAGR of 5.00% from 2019-2033 |
| Segmentation |
|
Table of Contents
- 1. Introduction
- 1.1. Research Scope
- 1.2. Market Segmentation
- 1.3. Research Methodology
- 1.4. Definitions and Assumptions
- 2. Executive Summary
- 2.1. Introduction
- 3. Market Dynamics
- 3.1. Introduction
- 3.2. Market Drivers
- 3.2.1. High Adoption of Octa-Core Application Processors; Increasing Adoption of Navigation Application in Automotive
- 3.3. Market Restrains
- 3.3.1. Concerns Regarding the Impact of COVID-19 On Supply Chain
- 3.4. Market Trends
- 3.4.1. Apple iOS to Witness Significant Growth Rate
- 4. Market Factor Analysis
- 4.1. Porters Five Forces
- 4.2. Supply/Value Chain
- 4.3. PESTEL analysis
- 4.4. Market Entropy
- 4.5. Patent/Trademark Analysis
- 5. Global Tablet Application Processor Industry Analysis, Insights and Forecast, 2019-2031
- 5.1. Market Analysis, Insights and Forecast - by Type
- 5.1.1. 32 Bit
- 5.1.2. 64 Bit
- 5.1.3. Other Types
- 5.2. Market Analysis, Insights and Forecast - by Core Type
- 5.2.1. Single Core
- 5.2.2. Multi-core
- 5.3. Market Analysis, Insights and Forecast - by Operating System
- 5.3.1. Android
- 5.3.2. Apple iOS
- 5.3.3. Windows
- 5.4. Market Analysis, Insights and Forecast - by End User
- 5.4.1. Household
- 5.4.2. Commercial
- 5.4.3. Other End Users
- 5.5. Market Analysis, Insights and Forecast - by Region
- 5.5.1. North America
- 5.5.2. Europe
- 5.5.3. Asia Pacific
- 5.5.4. Rest of the World
- 5.1. Market Analysis, Insights and Forecast - by Type
- 6. North America Tablet Application Processor Industry Analysis, Insights and Forecast, 2019-2031
- 6.1. Market Analysis, Insights and Forecast - by Type
- 6.1.1. 32 Bit
- 6.1.2. 64 Bit
- 6.1.3. Other Types
- 6.2. Market Analysis, Insights and Forecast - by Core Type
- 6.2.1. Single Core
- 6.2.2. Multi-core
- 6.3. Market Analysis, Insights and Forecast - by Operating System
- 6.3.1. Android
- 6.3.2. Apple iOS
- 6.3.3. Windows
- 6.4. Market Analysis, Insights and Forecast - by End User
- 6.4.1. Household
- 6.4.2. Commercial
- 6.4.3. Other End Users
- 6.1. Market Analysis, Insights and Forecast - by Type
- 7. Europe Tablet Application Processor Industry Analysis, Insights and Forecast, 2019-2031
- 7.1. Market Analysis, Insights and Forecast - by Type
- 7.1.1. 32 Bit
- 7.1.2. 64 Bit
- 7.1.3. Other Types
- 7.2. Market Analysis, Insights and Forecast - by Core Type
- 7.2.1. Single Core
- 7.2.2. Multi-core
- 7.3. Market Analysis, Insights and Forecast - by Operating System
- 7.3.1. Android
- 7.3.2. Apple iOS
- 7.3.3. Windows
- 7.4. Market Analysis, Insights and Forecast - by End User
- 7.4.1. Household
- 7.4.2. Commercial
- 7.4.3. Other End Users
- 7.1. Market Analysis, Insights and Forecast - by Type
- 8. Asia Pacific Tablet Application Processor Industry Analysis, Insights and Forecast, 2019-2031
- 8.1. Market Analysis, Insights and Forecast - by Type
- 8.1.1. 32 Bit
- 8.1.2. 64 Bit
- 8.1.3. Other Types
- 8.2. Market Analysis, Insights and Forecast - by Core Type
- 8.2.1. Single Core
- 8.2.2. Multi-core
- 8.3. Market Analysis, Insights and Forecast - by Operating System
- 8.3.1. Android
- 8.3.2. Apple iOS
- 8.3.3. Windows
- 8.4. Market Analysis, Insights and Forecast - by End User
- 8.4.1. Household
- 8.4.2. Commercial
- 8.4.3. Other End Users
- 8.1. Market Analysis, Insights and Forecast - by Type
- 9. Rest of the World Tablet Application Processor Industry Analysis, Insights and Forecast, 2019-2031
- 9.1. Market Analysis, Insights and Forecast - by Type
- 9.1.1. 32 Bit
- 9.1.2. 64 Bit
- 9.1.3. Other Types
- 9.2. Market Analysis, Insights and Forecast - by Core Type
- 9.2.1. Single Core
- 9.2.2. Multi-core
- 9.3. Market Analysis, Insights and Forecast - by Operating System
- 9.3.1. Android
- 9.3.2. Apple iOS
- 9.3.3. Windows
- 9.4. Market Analysis, Insights and Forecast - by End User
- 9.4.1. Household
- 9.4.2. Commercial
- 9.4.3. Other End Users
- 9.1. Market Analysis, Insights and Forecast - by Type
- 10. North America Tablet Application Processor Industry Analysis, Insights and Forecast, 2019-2031
- 10.1. Market Analysis, Insights and Forecast - By Country/Sub-region
- 10.1.1 United States
- 10.1.2 Canada
- 11. Europe Tablet Application Processor Industry Analysis, Insights and Forecast, 2019-2031
- 11.1. Market Analysis, Insights and Forecast - By Country/Sub-region
- 11.1.1 Germany
- 11.1.2 United Kingdom
- 11.1.3 France
- 11.1.4 Italy
- 11.1.5 Rest of Europe
- 12. Asia Pacific Tablet Application Processor Industry Analysis, Insights and Forecast, 2019-2031
- 12.1. Market Analysis, Insights and Forecast - By Country/Sub-region
- 12.1.1 India
- 12.1.2 China
- 12.1.3 Japan
- 12.1.4 South Korea
- 12.1.5 Rest of Asia Pacific
- 13. Rest of the World Tablet Application Processor Industry Analysis, Insights and Forecast, 2019-2031
- 13.1. Market Analysis, Insights and Forecast - By Country/Sub-region
- 13.1.1 Latin America
- 13.1.2 Middle East and Africa
- 14. Competitive Analysis
- 14.1. Global Market Share Analysis 2024
- 14.2. Company Profiles
- 14.2.1 Spreadtrum Communications Inc
- 14.2.1.1. Overview
- 14.2.1.2. Products
- 14.2.1.3. SWOT Analysis
- 14.2.1.4. Recent Developments
- 14.2.1.5. Financials (Based on Availability)
- 14.2.2 Samsung Electronics
- 14.2.2.1. Overview
- 14.2.2.2. Products
- 14.2.2.3. SWOT Analysis
- 14.2.2.4. Recent Developments
- 14.2.2.5. Financials (Based on Availability)
- 14.2.3 NXP Semiconductors NV
- 14.2.3.1. Overview
- 14.2.3.2. Products
- 14.2.3.3. SWOT Analysis
- 14.2.3.4. Recent Developments
- 14.2.3.5. Financials (Based on Availability)
- 14.2.4 Qualcomm Technologies Inc
- 14.2.4.1. Overview
- 14.2.4.2. Products
- 14.2.4.3. SWOT Analysis
- 14.2.4.4. Recent Developments
- 14.2.4.5. Financials (Based on Availability)
- 14.2.5 Ingenic Semiconductor Co Ltd*List Not Exhaustive
- 14.2.5.1. Overview
- 14.2.5.2. Products
- 14.2.5.3. SWOT Analysis
- 14.2.5.4. Recent Developments
- 14.2.5.5. Financials (Based on Availability)
- 14.2.6 Texas Instruments Incorporated
- 14.2.6.1. Overview
- 14.2.6.2. Products
- 14.2.6.3. SWOT Analysis
- 14.2.6.4. Recent Developments
- 14.2.6.5. Financials (Based on Availability)
- 14.2.7 MediaTek Inc
- 14.2.7.1. Overview
- 14.2.7.2. Products
- 14.2.7.3. SWOT Analysis
- 14.2.7.4. Recent Developments
- 14.2.7.5. Financials (Based on Availability)
- 14.2.8 Nvidia Corporation
- 14.2.8.1. Overview
- 14.2.8.2. Products
- 14.2.8.3. SWOT Analysis
- 14.2.8.4. Recent Developments
- 14.2.8.5. Financials (Based on Availability)
- 14.2.9 Apple Inc
- 14.2.9.1. Overview
- 14.2.9.2. Products
- 14.2.9.3. SWOT Analysis
- 14.2.9.4. Recent Developments
- 14.2.9.5. Financials (Based on Availability)
- 14.2.10 HiSilicon Technologies Co Ltd
- 14.2.10.1. Overview
- 14.2.10.2. Products
- 14.2.10.3. SWOT Analysis
- 14.2.10.4. Recent Developments
- 14.2.10.5. Financials (Based on Availability)
- 14.2.1 Spreadtrum Communications Inc
List of Figures
- Figure 1: Global Tablet Application Processor Industry Revenue Breakdown (Million, %) by Region 2024 & 2032
- Figure 2: North America Tablet Application Processor Industry Revenue (Million), by Country 2024 & 2032
- Figure 3: North America Tablet Application Processor Industry Revenue Share (%), by Country 2024 & 2032
- Figure 4: Europe Tablet Application Processor Industry Revenue (Million), by Country 2024 & 2032
- Figure 5: Europe Tablet Application Processor Industry Revenue Share (%), by Country 2024 & 2032
- Figure 6: Asia Pacific Tablet Application Processor Industry Revenue (Million), by Country 2024 & 2032
- Figure 7: Asia Pacific Tablet Application Processor Industry Revenue Share (%), by Country 2024 & 2032
- Figure 8: Rest of the World Tablet Application Processor Industry Revenue (Million), by Country 2024 & 2032
- Figure 9: Rest of the World Tablet Application Processor Industry Revenue Share (%), by Country 2024 & 2032
- Figure 10: North America Tablet Application Processor Industry Revenue (Million), by Type 2024 & 2032
- Figure 11: North America Tablet Application Processor Industry Revenue Share (%), by Type 2024 & 2032
- Figure 12: North America Tablet Application Processor Industry Revenue (Million), by Core Type 2024 & 2032
- Figure 13: North America Tablet Application Processor Industry Revenue Share (%), by Core Type 2024 & 2032
- Figure 14: North America Tablet Application Processor Industry Revenue (Million), by Operating System 2024 & 2032
- Figure 15: North America Tablet Application Processor Industry Revenue Share (%), by Operating System 2024 & 2032
- Figure 16: North America Tablet Application Processor Industry Revenue (Million), by End User 2024 & 2032
- Figure 17: North America Tablet Application Processor Industry Revenue Share (%), by End User 2024 & 2032
- Figure 18: North America Tablet Application Processor Industry Revenue (Million), by Country 2024 & 2032
- Figure 19: North America Tablet Application Processor Industry Revenue Share (%), by Country 2024 & 2032
- Figure 20: Europe Tablet Application Processor Industry Revenue (Million), by Type 2024 & 2032
- Figure 21: Europe Tablet Application Processor Industry Revenue Share (%), by Type 2024 & 2032
- Figure 22: Europe Tablet Application Processor Industry Revenue (Million), by Core Type 2024 & 2032
- Figure 23: Europe Tablet Application Processor Industry Revenue Share (%), by Core Type 2024 & 2032
- Figure 24: Europe Tablet Application Processor Industry Revenue (Million), by Operating System 2024 & 2032
- Figure 25: Europe Tablet Application Processor Industry Revenue Share (%), by Operating System 2024 & 2032
- Figure 26: Europe Tablet Application Processor Industry Revenue (Million), by End User 2024 & 2032
- Figure 27: Europe Tablet Application Processor Industry Revenue Share (%), by End User 2024 & 2032
- Figure 28: Europe Tablet Application Processor Industry Revenue (Million), by Country 2024 & 2032
- Figure 29: Europe Tablet Application Processor Industry Revenue Share (%), by Country 2024 & 2032
- Figure 30: Asia Pacific Tablet Application Processor Industry Revenue (Million), by Type 2024 & 2032
- Figure 31: Asia Pacific Tablet Application Processor Industry Revenue Share (%), by Type 2024 & 2032
- Figure 32: Asia Pacific Tablet Application Processor Industry Revenue (Million), by Core Type 2024 & 2032
- Figure 33: Asia Pacific Tablet Application Processor Industry Revenue Share (%), by Core Type 2024 & 2032
- Figure 34: Asia Pacific Tablet Application Processor Industry Revenue (Million), by Operating System 2024 & 2032
- Figure 35: Asia Pacific Tablet Application Processor Industry Revenue Share (%), by Operating System 2024 & 2032
- Figure 36: Asia Pacific Tablet Application Processor Industry Revenue (Million), by End User 2024 & 2032
- Figure 37: Asia Pacific Tablet Application Processor Industry Revenue Share (%), by End User 2024 & 2032
- Figure 38: Asia Pacific Tablet Application Processor Industry Revenue (Million), by Country 2024 & 2032
- Figure 39: Asia Pacific Tablet Application Processor Industry Revenue Share (%), by Country 2024 & 2032
- Figure 40: Rest of the World Tablet Application Processor Industry Revenue (Million), by Type 2024 & 2032
- Figure 41: Rest of the World Tablet Application Processor Industry Revenue Share (%), by Type 2024 & 2032
- Figure 42: Rest of the World Tablet Application Processor Industry Revenue (Million), by Core Type 2024 & 2032
- Figure 43: Rest of the World Tablet Application Processor Industry Revenue Share (%), by Core Type 2024 & 2032
- Figure 44: Rest of the World Tablet Application Processor Industry Revenue (Million), by Operating System 2024 & 2032
- Figure 45: Rest of the World Tablet Application Processor Industry Revenue Share (%), by Operating System 2024 & 2032
- Figure 46: Rest of the World Tablet Application Processor Industry Revenue (Million), by End User 2024 & 2032
- Figure 47: Rest of the World Tablet Application Processor Industry Revenue Share (%), by End User 2024 & 2032
- Figure 48: Rest of the World Tablet Application Processor Industry Revenue (Million), by Country 2024 & 2032
- Figure 49: Rest of the World Tablet Application Processor Industry Revenue Share (%), by Country 2024 & 2032
List of Tables
- Table 1: Global Tablet Application Processor Industry Revenue Million Forecast, by Region 2019 & 2032
- Table 2: Global Tablet Application Processor Industry Revenue Million Forecast, by Type 2019 & 2032
- Table 3: Global Tablet Application Processor Industry Revenue Million Forecast, by Core Type 2019 & 2032
- Table 4: Global Tablet Application Processor Industry Revenue Million Forecast, by Operating System 2019 & 2032
- Table 5: Global Tablet Application Processor Industry Revenue Million Forecast, by End User 2019 & 2032
- Table 6: Global Tablet Application Processor Industry Revenue Million Forecast, by Region 2019 & 2032
- Table 7: Global Tablet Application Processor Industry Revenue Million Forecast, by Country 2019 & 2032
- Table 8: United States Tablet Application Processor Industry Revenue (Million) Forecast, by Application 2019 & 2032
- Table 9: Canada Tablet Application Processor Industry Revenue (Million) Forecast, by Application 2019 & 2032
- Table 10: Global Tablet Application Processor Industry Revenue Million Forecast, by Country 2019 & 2032
- Table 11: Germany Tablet Application Processor Industry Revenue (Million) Forecast, by Application 2019 & 2032
- Table 12: United Kingdom Tablet Application Processor Industry Revenue (Million) Forecast, by Application 2019 & 2032
- Table 13: France Tablet Application Processor Industry Revenue (Million) Forecast, by Application 2019 & 2032
- Table 14: Italy Tablet Application Processor Industry Revenue (Million) Forecast, by Application 2019 & 2032
- Table 15: Rest of Europe Tablet Application Processor Industry Revenue (Million) Forecast, by Application 2019 & 2032
- Table 16: Global Tablet Application Processor Industry Revenue Million Forecast, by Country 2019 & 2032
- Table 17: India Tablet Application Processor Industry Revenue (Million) Forecast, by Application 2019 & 2032
- Table 18: China Tablet Application Processor Industry Revenue (Million) Forecast, by Application 2019 & 2032
- Table 19: Japan Tablet Application Processor Industry Revenue (Million) Forecast, by Application 2019 & 2032
- Table 20: South Korea Tablet Application Processor Industry Revenue (Million) Forecast, by Application 2019 & 2032
- Table 21: Rest of Asia Pacific Tablet Application Processor Industry Revenue (Million) Forecast, by Application 2019 & 2032
- Table 22: Global Tablet Application Processor Industry Revenue Million Forecast, by Country 2019 & 2032
- Table 23: Latin America Tablet Application Processor Industry Revenue (Million) Forecast, by Application 2019 & 2032
- Table 24: Middle East and Africa Tablet Application Processor Industry Revenue (Million) Forecast, by Application 2019 & 2032
- Table 25: Global Tablet Application Processor Industry Revenue Million Forecast, by Type 2019 & 2032
- Table 26: Global Tablet Application Processor Industry Revenue Million Forecast, by Core Type 2019 & 2032
- Table 27: Global Tablet Application Processor Industry Revenue Million Forecast, by Operating System 2019 & 2032
- Table 28: Global Tablet Application Processor Industry Revenue Million Forecast, by End User 2019 & 2032
- Table 29: Global Tablet Application Processor Industry Revenue Million Forecast, by Country 2019 & 2032
- Table 30: United States Tablet Application Processor Industry Revenue (Million) Forecast, by Application 2019 & 2032
- Table 31: Canada Tablet Application Processor Industry Revenue (Million) Forecast, by Application 2019 & 2032
- Table 32: Global Tablet Application Processor Industry Revenue Million Forecast, by Type 2019 & 2032
- Table 33: Global Tablet Application Processor Industry Revenue Million Forecast, by Core Type 2019 & 2032
- Table 34: Global Tablet Application Processor Industry Revenue Million Forecast, by Operating System 2019 & 2032
- Table 35: Global Tablet Application Processor Industry Revenue Million Forecast, by End User 2019 & 2032
- Table 36: Global Tablet Application Processor Industry Revenue Million Forecast, by Country 2019 & 2032
- Table 37: Germany Tablet Application Processor Industry Revenue (Million) Forecast, by Application 2019 & 2032
- Table 38: United Kingdom Tablet Application Processor Industry Revenue (Million) Forecast, by Application 2019 & 2032
- Table 39: France Tablet Application Processor Industry Revenue (Million) Forecast, by Application 2019 & 2032
- Table 40: Italy Tablet Application Processor Industry Revenue (Million) Forecast, by Application 2019 & 2032
- Table 41: Rest of Europe Tablet Application Processor Industry Revenue (Million) Forecast, by Application 2019 & 2032
- Table 42: Global Tablet Application Processor Industry Revenue Million Forecast, by Type 2019 & 2032
- Table 43: Global Tablet Application Processor Industry Revenue Million Forecast, by Core Type 2019 & 2032
- Table 44: Global Tablet Application Processor Industry Revenue Million Forecast, by Operating System 2019 & 2032
- Table 45: Global Tablet Application Processor Industry Revenue Million Forecast, by End User 2019 & 2032
- Table 46: Global Tablet Application Processor Industry Revenue Million Forecast, by Country 2019 & 2032
- Table 47: India Tablet Application Processor Industry Revenue (Million) Forecast, by Application 2019 & 2032
- Table 48: China Tablet Application Processor Industry Revenue (Million) Forecast, by Application 2019 & 2032
- Table 49: Japan Tablet Application Processor Industry Revenue (Million) Forecast, by Application 2019 & 2032
- Table 50: South Korea Tablet Application Processor Industry Revenue (Million) Forecast, by Application 2019 & 2032
- Table 51: Rest of Asia Pacific Tablet Application Processor Industry Revenue (Million) Forecast, by Application 2019 & 2032
- Table 52: Global Tablet Application Processor Industry Revenue Million Forecast, by Type 2019 & 2032
- Table 53: Global Tablet Application Processor Industry Revenue Million Forecast, by Core Type 2019 & 2032
- Table 54: Global Tablet Application Processor Industry Revenue Million Forecast, by Operating System 2019 & 2032
- Table 55: Global Tablet Application Processor Industry Revenue Million Forecast, by End User 2019 & 2032
- Table 56: Global Tablet Application Processor Industry Revenue Million Forecast, by Country 2019 & 2032
- Table 57: Latin America Tablet Application Processor Industry Revenue (Million) Forecast, by Application 2019 & 2032
- Table 58: Middle East and Africa Tablet Application Processor Industry Revenue (Million) Forecast, by Application 2019 & 2032
Frequently Asked Questions
1. What is the projected Compound Annual Growth Rate (CAGR) of the Tablet Application Processor Industry?
The projected CAGR is approximately 5.00%.
2. Which companies are prominent players in the Tablet Application Processor Industry?
Key companies in the market include Spreadtrum Communications Inc, Samsung Electronics, NXP Semiconductors NV, Qualcomm Technologies Inc, Ingenic Semiconductor Co Ltd*List Not Exhaustive, Texas Instruments Incorporated, MediaTek Inc, Nvidia Corporation, Apple Inc, HiSilicon Technologies Co Ltd.
3. What are the main segments of the Tablet Application Processor Industry?
The market segments include Type, Core Type, Operating System, End User.
4. Can you provide details about the market size?
The market size is estimated to be USD XX Million as of 2022.
5. What are some drivers contributing to market growth?
High Adoption of Octa-Core Application Processors; Increasing Adoption of Navigation Application in Automotive.
6. What are the notable trends driving market growth?
Apple iOS to Witness Significant Growth Rate.
7. Are there any restraints impacting market growth?
Concerns Regarding the Impact of COVID-19 On Supply Chain.
8. Can you provide examples of recent developments in the market?
N/A
9. What pricing options are available for accessing the report?
Pricing options include single-user, multi-user, and enterprise licenses priced at USD 4750, USD 5250, and USD 8750 respectively.
10. Is the market size provided in terms of value or volume?
The market size is provided in terms of value, measured in Million.
11. Are there any specific market keywords associated with the report?
Yes, the market keyword associated with the report is "Tablet Application Processor Industry," which aids in identifying and referencing the specific market segment covered.
12. How do I determine which pricing option suits my needs best?
The pricing options vary based on user requirements and access needs. Individual users may opt for single-user licenses, while businesses requiring broader access may choose multi-user or enterprise licenses for cost-effective access to the report.
13. Are there any additional resources or data provided in the Tablet Application Processor Industry report?
While the report offers comprehensive insights, it's advisable to review the specific contents or supplementary materials provided to ascertain if additional resources or data are available.
14. How can I stay updated on further developments or reports in the Tablet Application Processor Industry?
To stay informed about further developments, trends, and reports in the Tablet Application Processor Industry, consider subscribing to industry newsletters, following relevant companies and organizations, or regularly checking reputable industry news sources and publications.
Methodology
Step 1 - Identification of Relevant Samples Size from Population Database


Step 2 - Approaches for Defining Global Market Size (Value, Volume* & Price*)

Note*: In applicable scenarios
Step 3 - Data Sources
Primary Research
- Web Analytics
- Survey Reports
- Research Institute
- Latest Research Reports
- Opinion Leaders
Secondary Research
- Annual Reports
- White Paper
- Latest Press Release
- Industry Association
- Paid Database
- Investor Presentations

Step 4 - Data Triangulation
Involves using different sources of information in order to increase the validity of a study
These sources are likely to be stakeholders in a program - participants, other researchers, program staff, other community members, and so on.
Then we put all data in single framework & apply various statistical tools to find out the dynamic on the market.
During the analysis stage, feedback from the stakeholder groups would be compared to determine areas of agreement as well as areas of divergence
