

Key Insights
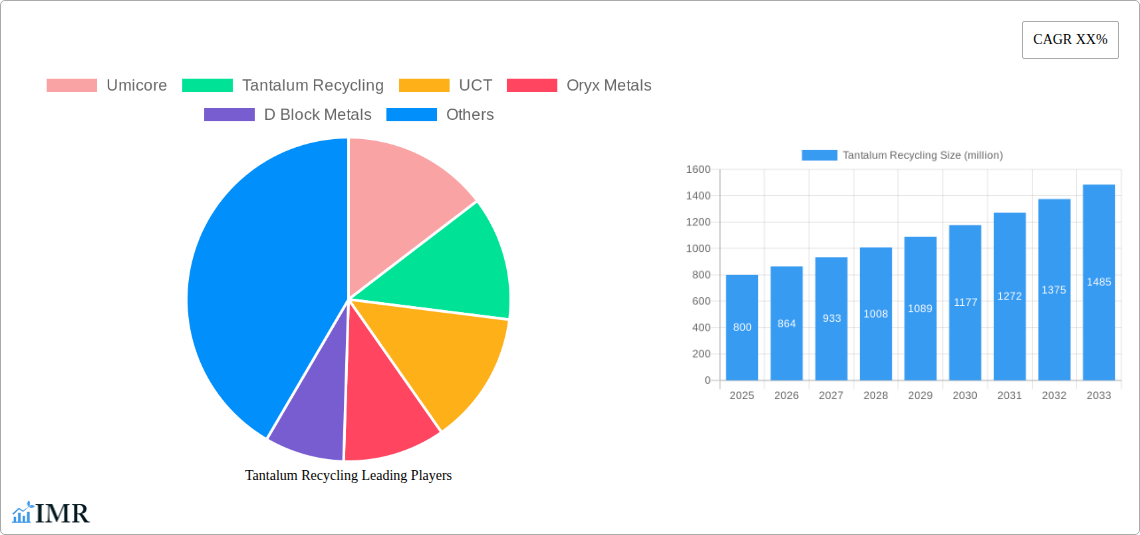
The tantalum recycling market is experiencing robust growth, driven by increasing demand for tantalum in electronics and other high-tech applications coupled with growing environmental concerns regarding tantalum mining's impact. The market's Compound Annual Growth Rate (CAGR) is estimated at 8% from 2025 to 2033, indicating a significant expansion opportunity. This growth is fueled by stricter regulations on e-waste disposal, technological advancements in tantalum recycling processes (improving extraction rates and reducing costs), and rising awareness among manufacturers about the economic and environmental benefits of incorporating recycled tantalum into their supply chains. Major players, such as Umicore, Tantalum Recycling, and others listed, are strategically investing in research and development and expanding their recycling capacities to capitalize on this growing market. The market is segmented geographically, with North America and Europe currently holding significant shares, though emerging economies in Asia are projected to witness faster growth due to rising electronics consumption and supportive government policies promoting sustainable practices.
The restraining factors currently impacting the market include the complex nature of tantalum recycling processes, requiring specialized technology and expertise, and the relatively high initial investment needed to establish efficient recycling facilities. However, continuous technological innovation and increased government support are mitigating these challenges, paving the way for further market expansion. The increasing adoption of circular economy principles across various industries further boosts market prospects, leading to heightened demand for recycled tantalum and making it a more cost-competitive and sustainable alternative to newly mined tantalum. The market is projected to reach a value of approximately $1.5 billion by 2033, showcasing its considerable potential for growth and attracting further investment in the sector.
Tantalum Recycling Market Report: 2019-2033
This comprehensive report provides an in-depth analysis of the tantalum recycling market, offering invaluable insights for industry professionals, investors, and strategic decision-makers. Covering the period from 2019 to 2033, with a base year of 2025 and a forecast period spanning 2025-2033, this report illuminates the market's dynamics, growth trends, key players, and future outlook. The report leverages extensive primary and secondary research, incorporating data from various sources to ensure accuracy and relevance. This analysis delves into both parent and child markets to provide a complete understanding of the tantalum recycling landscape.
Tantalum Recycling Market Dynamics & Structure
This section analyzes the competitive landscape of the tantalum recycling market (valued at $xx million in 2025), focusing on market concentration, technological innovation, regulatory frameworks, and M&A activities. The market is characterized by a moderate level of concentration, with key players such as Umicore, Tantalum Recycling, and others holding significant market shares.
- Market Concentration: The top 5 players account for approximately xx% of the global market share in 2025.
- Technological Innovation: Advancements in hydrometallurgical and pyrometallurgical processes are driving efficiency and cost reductions. However, high capital expenditure requirements present a significant barrier to entry for new players.
- Regulatory Frameworks: Stringent environmental regulations in various regions are influencing recycling practices and driving the adoption of sustainable technologies.
- Competitive Product Substitutes: The availability of tantalum from primary sources creates competitive pressure on recycled tantalum, impacting pricing and market share.
- End-User Demographics: The electronics industry remains the primary end-user, driving demand for recycled tantalum due to growing concerns about resource scarcity and sustainability.
- M&A Trends: The past five years have witnessed xx M&A deals in the tantalum recycling sector, primarily focused on consolidating market share and expanding technological capabilities.
Tantalum Recycling Growth Trends & Insights
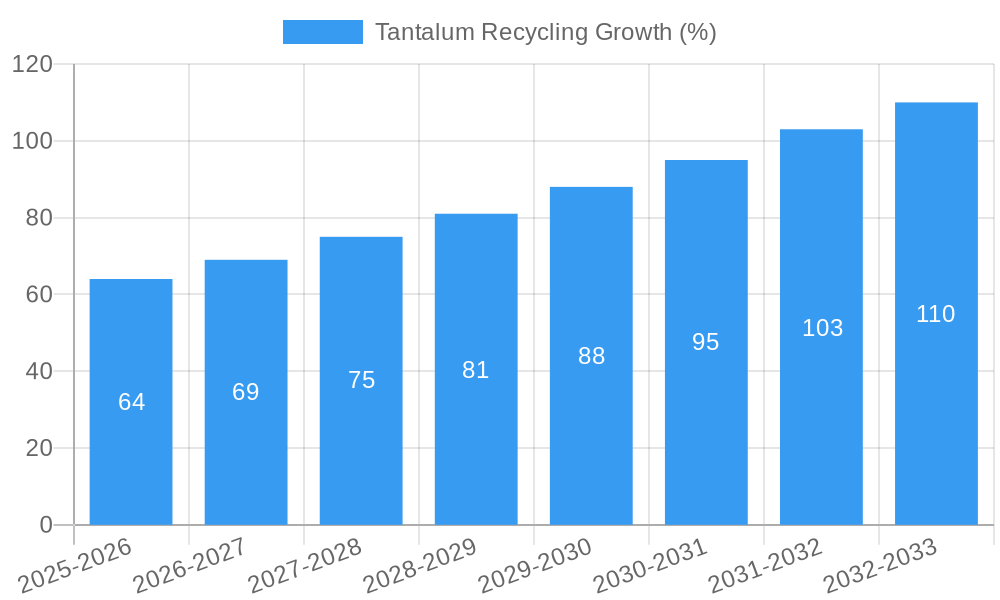
The global tantalum recycling market is projected to witness robust growth, with a CAGR of xx% during the forecast period (2025-2033), driven by increasing demand from the electronics industry and growing awareness of environmental sustainability. Market size is expected to reach $xx million by 2033. Technological advancements in recycling processes, along with supportive government policies promoting resource efficiency, are further fueling market expansion. Consumer preference for environmentally friendly electronics is also a contributing factor. Adoption rates are steadily increasing, driven by higher prices for primary tantalum and stricter regulations on e-waste disposal. Technological disruptions, such as the development of advanced separation and purification techniques, are streamlining the recycling process and enhancing overall efficiency.
Dominant Regions, Countries, or Segments in Tantalum Recycling
The [Region - e.g., Europe] region currently dominates the tantalum recycling market, accounting for xx% of the global market share in 2025. This dominance is attributed to several key factors:
- Stringent Environmental Regulations: Stricter environmental regulations in the region are promoting the recycling of electronic waste, boosting demand for tantalum recycling services.
- Established Recycling Infrastructure: A well-established recycling infrastructure and the presence of key players contribute significantly to the region's leadership.
- High Concentration of Electronics Manufacturing: A high concentration of electronics manufacturing facilities drives demand for recycled tantalum.
Other regions, such as [Region - e.g., North America] and [Region - e.g., Asia-Pacific], are expected to witness significant growth in the coming years, driven by increasing electronic waste generation and government initiatives promoting sustainable practices.
Tantalum Recycling Product Landscape
The tantalum recycling industry offers a range of services, including the processing of tantalum-containing scrap, the recovery of tantalum metal and compounds, and the refining of tantalum products to meet specific purity requirements. Technological advancements in hydrometallurgy and pyrometallurgy have enhanced the efficiency and cost-effectiveness of these processes, resulting in higher recovery rates and improved product quality. Unique selling propositions for recyclers often include certified sustainable sourcing and enhanced supply chain transparency.
Key Drivers, Barriers & Challenges in Tantalum Recycling
Key Drivers:
- Increasing demand for tantalum from the electronics industry.
- Growing awareness of environmental sustainability and resource scarcity.
- Stringent regulations on e-waste disposal.
- Technological advancements in recycling processes.
Key Challenges:
- Fluctuating tantalum prices impacting profitability.
- Complex separation and purification processes increasing costs.
- Limited availability of high-quality tantalum-containing scrap.
- Potential health and environmental risks associated with processing e-waste.
Emerging Opportunities in Tantalum Recycling
Emerging opportunities include expansion into untapped markets (e.g., developing economies with increasing e-waste generation), development of innovative applications for recycled tantalum, and collaboration with original equipment manufacturers (OEMs) to integrate recycled tantalum into their supply chains.
Growth Accelerators in the Tantalum Recycling Industry
Technological advancements, strategic partnerships between recyclers and electronics manufacturers, and government policies promoting resource efficiency and circular economy models are key growth catalysts. Expanding into new geographic markets and developing innovative applications for recycled tantalum will further accelerate market expansion.
Key Players Shaping the Tantalum Recycling Market
- Umicore
- Tantalum Recycling
- UCT
- Oryx Metals
- D Block Metals
- Quest Alloys
- Neo Rare Metals
- Israel Special Metals
- Yano Metals Co., Ltd.
- Buss & Buss Spezialmetalle GmbH
Notable Milestones in Tantalum Recycling Sector
- 2021: Introduction of a new hydrometallurgical process by [Company Name] resulting in a 15% increase in tantalum recovery rate.
- 2022: Partnership between [Company Name] and [Electronics Manufacturer] to integrate recycled tantalum in smartphone production.
- 2023: New regulations implemented in [Region] requiring higher recycling rates for electronic waste.
In-Depth Tantalum Recycling Market Outlook
The tantalum recycling market is poised for significant growth in the coming years, driven by a confluence of factors including increasing demand, stricter environmental regulations, and technological advancements. Strategic partnerships and investments in research and development will be crucial in unlocking the full potential of this market, creating sustainable and efficient recycling solutions. The market presents significant opportunities for players who can effectively navigate the technological, regulatory, and economic challenges inherent in this sector.
Tantalum Recycling Segmentation
-
1. Application
- 1.1. Tantalum Capacitors
- 1.2. Target
- 1.3. Alloy
- 1.4. Others
-
2. Types
- 2.1. Tantalum Capacitors
- 2.2. Electronic Scrap
Tantalum Recycling Segmentation By Geography
-
1. North America
- 1.1. United States
- 1.2. Canada
- 1.3. Mexico
-
2. South America
- 2.1. Brazil
- 2.2. Argentina
- 2.3. Rest of South America
-
3. Europe
- 3.1. United Kingdom
- 3.2. Germany
- 3.3. France
- 3.4. Italy
- 3.5. Spain
- 3.6. Russia
- 3.7. Benelux
- 3.8. Nordics
- 3.9. Rest of Europe
-
4. Middle East & Africa
- 4.1. Turkey
- 4.2. Israel
- 4.3. GCC
- 4.4. North Africa
- 4.5. South Africa
- 4.6. Rest of Middle East & Africa
-
5. Asia Pacific
- 5.1. China
- 5.2. India
- 5.3. Japan
- 5.4. South Korea
- 5.5. ASEAN
- 5.6. Oceania
- 5.7. Rest of Asia Pacific

Tantalum Recycling REPORT HIGHLIGHTS
| Aspects | Details |
|---|---|
| Study Period | 2019-2033 |
| Base Year | 2024 |
| Estimated Year | 2025 |
| Forecast Period | 2025-2033 |
| Historical Period | 2019-2024 |
| Growth Rate | CAGR of XX% from 2019-2033 |
| Segmentation |
|
Table of Contents
- 1. Introduction
- 1.1. Research Scope
- 1.2. Market Segmentation
- 1.3. Research Methodology
- 1.4. Definitions and Assumptions
- 2. Executive Summary
- 2.1. Introduction
- 3. Market Dynamics
- 3.1. Introduction
- 3.2. Market Drivers
- 3.3. Market Restrains
- 3.4. Market Trends
- 4. Market Factor Analysis
- 4.1. Porters Five Forces
- 4.2. Supply/Value Chain
- 4.3. PESTEL analysis
- 4.4. Market Entropy
- 4.5. Patent/Trademark Analysis
- 5. Global Tantalum Recycling Analysis, Insights and Forecast, 2019-2031
- 5.1. Market Analysis, Insights and Forecast - by Application
- 5.1.1. Tantalum Capacitors
- 5.1.2. Target
- 5.1.3. Alloy
- 5.1.4. Others
- 5.2. Market Analysis, Insights and Forecast - by Types
- 5.2.1. Tantalum Capacitors
- 5.2.2. Electronic Scrap
- 5.3. Market Analysis, Insights and Forecast - by Region
- 5.3.1. North America
- 5.3.2. South America
- 5.3.3. Europe
- 5.3.4. Middle East & Africa
- 5.3.5. Asia Pacific
- 5.1. Market Analysis, Insights and Forecast - by Application
- 6. North America Tantalum Recycling Analysis, Insights and Forecast, 2019-2031
- 6.1. Market Analysis, Insights and Forecast - by Application
- 6.1.1. Tantalum Capacitors
- 6.1.2. Target
- 6.1.3. Alloy
- 6.1.4. Others
- 6.2. Market Analysis, Insights and Forecast - by Types
- 6.2.1. Tantalum Capacitors
- 6.2.2. Electronic Scrap
- 6.1. Market Analysis, Insights and Forecast - by Application
- 7. South America Tantalum Recycling Analysis, Insights and Forecast, 2019-2031
- 7.1. Market Analysis, Insights and Forecast - by Application
- 7.1.1. Tantalum Capacitors
- 7.1.2. Target
- 7.1.3. Alloy
- 7.1.4. Others
- 7.2. Market Analysis, Insights and Forecast - by Types
- 7.2.1. Tantalum Capacitors
- 7.2.2. Electronic Scrap
- 7.1. Market Analysis, Insights and Forecast - by Application
- 8. Europe Tantalum Recycling Analysis, Insights and Forecast, 2019-2031
- 8.1. Market Analysis, Insights and Forecast - by Application
- 8.1.1. Tantalum Capacitors
- 8.1.2. Target
- 8.1.3. Alloy
- 8.1.4. Others
- 8.2. Market Analysis, Insights and Forecast - by Types
- 8.2.1. Tantalum Capacitors
- 8.2.2. Electronic Scrap
- 8.1. Market Analysis, Insights and Forecast - by Application
- 9. Middle East & Africa Tantalum Recycling Analysis, Insights and Forecast, 2019-2031
- 9.1. Market Analysis, Insights and Forecast - by Application
- 9.1.1. Tantalum Capacitors
- 9.1.2. Target
- 9.1.3. Alloy
- 9.1.4. Others
- 9.2. Market Analysis, Insights and Forecast - by Types
- 9.2.1. Tantalum Capacitors
- 9.2.2. Electronic Scrap
- 9.1. Market Analysis, Insights and Forecast - by Application
- 10. Asia Pacific Tantalum Recycling Analysis, Insights and Forecast, 2019-2031
- 10.1. Market Analysis, Insights and Forecast - by Application
- 10.1.1. Tantalum Capacitors
- 10.1.2. Target
- 10.1.3. Alloy
- 10.1.4. Others
- 10.2. Market Analysis, Insights and Forecast - by Types
- 10.2.1. Tantalum Capacitors
- 10.2.2. Electronic Scrap
- 10.1. Market Analysis, Insights and Forecast - by Application
- 11. Competitive Analysis
- 11.1. Global Market Share Analysis 2024
- 11.2. Company Profiles
- 11.2.1 Umicore
- 11.2.1.1. Overview
- 11.2.1.2. Products
- 11.2.1.3. SWOT Analysis
- 11.2.1.4. Recent Developments
- 11.2.1.5. Financials (Based on Availability)
- 11.2.2 Tantalum Recycling
- 11.2.2.1. Overview
- 11.2.2.2. Products
- 11.2.2.3. SWOT Analysis
- 11.2.2.4. Recent Developments
- 11.2.2.5. Financials (Based on Availability)
- 11.2.3 UCT
- 11.2.3.1. Overview
- 11.2.3.2. Products
- 11.2.3.3. SWOT Analysis
- 11.2.3.4. Recent Developments
- 11.2.3.5. Financials (Based on Availability)
- 11.2.4 Oryx Metals
- 11.2.4.1. Overview
- 11.2.4.2. Products
- 11.2.4.3. SWOT Analysis
- 11.2.4.4. Recent Developments
- 11.2.4.5. Financials (Based on Availability)
- 11.2.5 D Block Metals
- 11.2.5.1. Overview
- 11.2.5.2. Products
- 11.2.5.3. SWOT Analysis
- 11.2.5.4. Recent Developments
- 11.2.5.5. Financials (Based on Availability)
- 11.2.6 Quest Alloys
- 11.2.6.1. Overview
- 11.2.6.2. Products
- 11.2.6.3. SWOT Analysis
- 11.2.6.4. Recent Developments
- 11.2.6.5. Financials (Based on Availability)
- 11.2.7 Neo Rare Metals
- 11.2.7.1. Overview
- 11.2.7.2. Products
- 11.2.7.3. SWOT Analysis
- 11.2.7.4. Recent Developments
- 11.2.7.5. Financials (Based on Availability)
- 11.2.8 Israel Special Metals
- 11.2.8.1. Overview
- 11.2.8.2. Products
- 11.2.8.3. SWOT Analysis
- 11.2.8.4. Recent Developments
- 11.2.8.5. Financials (Based on Availability)
- 11.2.9 Yano Metals Co.
- 11.2.9.1. Overview
- 11.2.9.2. Products
- 11.2.9.3. SWOT Analysis
- 11.2.9.4. Recent Developments
- 11.2.9.5. Financials (Based on Availability)
- 11.2.10 Ltd.
- 11.2.10.1. Overview
- 11.2.10.2. Products
- 11.2.10.3. SWOT Analysis
- 11.2.10.4. Recent Developments
- 11.2.10.5. Financials (Based on Availability)
- 11.2.11 Buss & Buss Spezialmetalle GmbH
- 11.2.11.1. Overview
- 11.2.11.2. Products
- 11.2.11.3. SWOT Analysis
- 11.2.11.4. Recent Developments
- 11.2.11.5. Financials (Based on Availability)
- 11.2.1 Umicore
List of Figures
- Figure 1: Global Tantalum Recycling Revenue Breakdown (million, %) by Region 2024 & 2032
- Figure 2: North America Tantalum Recycling Revenue (million), by Application 2024 & 2032
- Figure 3: North America Tantalum Recycling Revenue Share (%), by Application 2024 & 2032
- Figure 4: North America Tantalum Recycling Revenue (million), by Types 2024 & 2032
- Figure 5: North America Tantalum Recycling Revenue Share (%), by Types 2024 & 2032
- Figure 6: North America Tantalum Recycling Revenue (million), by Country 2024 & 2032
- Figure 7: North America Tantalum Recycling Revenue Share (%), by Country 2024 & 2032
- Figure 8: South America Tantalum Recycling Revenue (million), by Application 2024 & 2032
- Figure 9: South America Tantalum Recycling Revenue Share (%), by Application 2024 & 2032
- Figure 10: South America Tantalum Recycling Revenue (million), by Types 2024 & 2032
- Figure 11: South America Tantalum Recycling Revenue Share (%), by Types 2024 & 2032
- Figure 12: South America Tantalum Recycling Revenue (million), by Country 2024 & 2032
- Figure 13: South America Tantalum Recycling Revenue Share (%), by Country 2024 & 2032
- Figure 14: Europe Tantalum Recycling Revenue (million), by Application 2024 & 2032
- Figure 15: Europe Tantalum Recycling Revenue Share (%), by Application 2024 & 2032
- Figure 16: Europe Tantalum Recycling Revenue (million), by Types 2024 & 2032
- Figure 17: Europe Tantalum Recycling Revenue Share (%), by Types 2024 & 2032
- Figure 18: Europe Tantalum Recycling Revenue (million), by Country 2024 & 2032
- Figure 19: Europe Tantalum Recycling Revenue Share (%), by Country 2024 & 2032
- Figure 20: Middle East & Africa Tantalum Recycling Revenue (million), by Application 2024 & 2032
- Figure 21: Middle East & Africa Tantalum Recycling Revenue Share (%), by Application 2024 & 2032
- Figure 22: Middle East & Africa Tantalum Recycling Revenue (million), by Types 2024 & 2032
- Figure 23: Middle East & Africa Tantalum Recycling Revenue Share (%), by Types 2024 & 2032
- Figure 24: Middle East & Africa Tantalum Recycling Revenue (million), by Country 2024 & 2032
- Figure 25: Middle East & Africa Tantalum Recycling Revenue Share (%), by Country 2024 & 2032
- Figure 26: Asia Pacific Tantalum Recycling Revenue (million), by Application 2024 & 2032
- Figure 27: Asia Pacific Tantalum Recycling Revenue Share (%), by Application 2024 & 2032
- Figure 28: Asia Pacific Tantalum Recycling Revenue (million), by Types 2024 & 2032
- Figure 29: Asia Pacific Tantalum Recycling Revenue Share (%), by Types 2024 & 2032
- Figure 30: Asia Pacific Tantalum Recycling Revenue (million), by Country 2024 & 2032
- Figure 31: Asia Pacific Tantalum Recycling Revenue Share (%), by Country 2024 & 2032
List of Tables
- Table 1: Global Tantalum Recycling Revenue million Forecast, by Region 2019 & 2032
- Table 2: Global Tantalum Recycling Revenue million Forecast, by Application 2019 & 2032
- Table 3: Global Tantalum Recycling Revenue million Forecast, by Types 2019 & 2032
- Table 4: Global Tantalum Recycling Revenue million Forecast, by Region 2019 & 2032
- Table 5: Global Tantalum Recycling Revenue million Forecast, by Application 2019 & 2032
- Table 6: Global Tantalum Recycling Revenue million Forecast, by Types 2019 & 2032
- Table 7: Global Tantalum Recycling Revenue million Forecast, by Country 2019 & 2032
- Table 8: United States Tantalum Recycling Revenue (million) Forecast, by Application 2019 & 2032
- Table 9: Canada Tantalum Recycling Revenue (million) Forecast, by Application 2019 & 2032
- Table 10: Mexico Tantalum Recycling Revenue (million) Forecast, by Application 2019 & 2032
- Table 11: Global Tantalum Recycling Revenue million Forecast, by Application 2019 & 2032
- Table 12: Global Tantalum Recycling Revenue million Forecast, by Types 2019 & 2032
- Table 13: Global Tantalum Recycling Revenue million Forecast, by Country 2019 & 2032
- Table 14: Brazil Tantalum Recycling Revenue (million) Forecast, by Application 2019 & 2032
- Table 15: Argentina Tantalum Recycling Revenue (million) Forecast, by Application 2019 & 2032
- Table 16: Rest of South America Tantalum Recycling Revenue (million) Forecast, by Application 2019 & 2032
- Table 17: Global Tantalum Recycling Revenue million Forecast, by Application 2019 & 2032
- Table 18: Global Tantalum Recycling Revenue million Forecast, by Types 2019 & 2032
- Table 19: Global Tantalum Recycling Revenue million Forecast, by Country 2019 & 2032
- Table 20: United Kingdom Tantalum Recycling Revenue (million) Forecast, by Application 2019 & 2032
- Table 21: Germany Tantalum Recycling Revenue (million) Forecast, by Application 2019 & 2032
- Table 22: France Tantalum Recycling Revenue (million) Forecast, by Application 2019 & 2032
- Table 23: Italy Tantalum Recycling Revenue (million) Forecast, by Application 2019 & 2032
- Table 24: Spain Tantalum Recycling Revenue (million) Forecast, by Application 2019 & 2032
- Table 25: Russia Tantalum Recycling Revenue (million) Forecast, by Application 2019 & 2032
- Table 26: Benelux Tantalum Recycling Revenue (million) Forecast, by Application 2019 & 2032
- Table 27: Nordics Tantalum Recycling Revenue (million) Forecast, by Application 2019 & 2032
- Table 28: Rest of Europe Tantalum Recycling Revenue (million) Forecast, by Application 2019 & 2032
- Table 29: Global Tantalum Recycling Revenue million Forecast, by Application 2019 & 2032
- Table 30: Global Tantalum Recycling Revenue million Forecast, by Types 2019 & 2032
- Table 31: Global Tantalum Recycling Revenue million Forecast, by Country 2019 & 2032
- Table 32: Turkey Tantalum Recycling Revenue (million) Forecast, by Application 2019 & 2032
- Table 33: Israel Tantalum Recycling Revenue (million) Forecast, by Application 2019 & 2032
- Table 34: GCC Tantalum Recycling Revenue (million) Forecast, by Application 2019 & 2032
- Table 35: North Africa Tantalum Recycling Revenue (million) Forecast, by Application 2019 & 2032
- Table 36: South Africa Tantalum Recycling Revenue (million) Forecast, by Application 2019 & 2032
- Table 37: Rest of Middle East & Africa Tantalum Recycling Revenue (million) Forecast, by Application 2019 & 2032
- Table 38: Global Tantalum Recycling Revenue million Forecast, by Application 2019 & 2032
- Table 39: Global Tantalum Recycling Revenue million Forecast, by Types 2019 & 2032
- Table 40: Global Tantalum Recycling Revenue million Forecast, by Country 2019 & 2032
- Table 41: China Tantalum Recycling Revenue (million) Forecast, by Application 2019 & 2032
- Table 42: India Tantalum Recycling Revenue (million) Forecast, by Application 2019 & 2032
- Table 43: Japan Tantalum Recycling Revenue (million) Forecast, by Application 2019 & 2032
- Table 44: South Korea Tantalum Recycling Revenue (million) Forecast, by Application 2019 & 2032
- Table 45: ASEAN Tantalum Recycling Revenue (million) Forecast, by Application 2019 & 2032
- Table 46: Oceania Tantalum Recycling Revenue (million) Forecast, by Application 2019 & 2032
- Table 47: Rest of Asia Pacific Tantalum Recycling Revenue (million) Forecast, by Application 2019 & 2032
Frequently Asked Questions
1. What is the projected Compound Annual Growth Rate (CAGR) of the Tantalum Recycling?
The projected CAGR is approximately XX%.
2. Which companies are prominent players in the Tantalum Recycling?
Key companies in the market include Umicore, Tantalum Recycling, UCT, Oryx Metals, D Block Metals, Quest Alloys, Neo Rare Metals, Israel Special Metals, Yano Metals Co., Ltd., Buss & Buss Spezialmetalle GmbH.
3. What are the main segments of the Tantalum Recycling?
The market segments include Application, Types.
4. Can you provide details about the market size?
The market size is estimated to be USD XXX million as of 2022.
5. What are some drivers contributing to market growth?
N/A
6. What are the notable trends driving market growth?
N/A
7. Are there any restraints impacting market growth?
N/A
8. Can you provide examples of recent developments in the market?
N/A
9. What pricing options are available for accessing the report?
Pricing options include single-user, multi-user, and enterprise licenses priced at USD 3950.00, USD 5925.00, and USD 7900.00 respectively.
10. Is the market size provided in terms of value or volume?
The market size is provided in terms of value, measured in million.
11. Are there any specific market keywords associated with the report?
Yes, the market keyword associated with the report is "Tantalum Recycling," which aids in identifying and referencing the specific market segment covered.
12. How do I determine which pricing option suits my needs best?
The pricing options vary based on user requirements and access needs. Individual users may opt for single-user licenses, while businesses requiring broader access may choose multi-user or enterprise licenses for cost-effective access to the report.
13. Are there any additional resources or data provided in the Tantalum Recycling report?
While the report offers comprehensive insights, it's advisable to review the specific contents or supplementary materials provided to ascertain if additional resources or data are available.
14. How can I stay updated on further developments or reports in the Tantalum Recycling?
To stay informed about further developments, trends, and reports in the Tantalum Recycling, consider subscribing to industry newsletters, following relevant companies and organizations, or regularly checking reputable industry news sources and publications.
Methodology
Step 1 - Identification of Relevant Samples Size from Population Database


Step 2 - Approaches for Defining Global Market Size (Value, Volume* & Price*)

Note*: In applicable scenarios
Step 3 - Data Sources
Primary Research
- Web Analytics
- Survey Reports
- Research Institute
- Latest Research Reports
- Opinion Leaders
Secondary Research
- Annual Reports
- White Paper
- Latest Press Release
- Industry Association
- Paid Database
- Investor Presentations

Step 4 - Data Triangulation
Involves using different sources of information in order to increase the validity of a study
These sources are likely to be stakeholders in a program - participants, other researchers, program staff, other community members, and so on.
Then we put all data in single framework & apply various statistical tools to find out the dynamic on the market.
During the analysis stage, feedback from the stakeholder groups would be compared to determine areas of agreement as well as areas of divergence
