

Key Insights
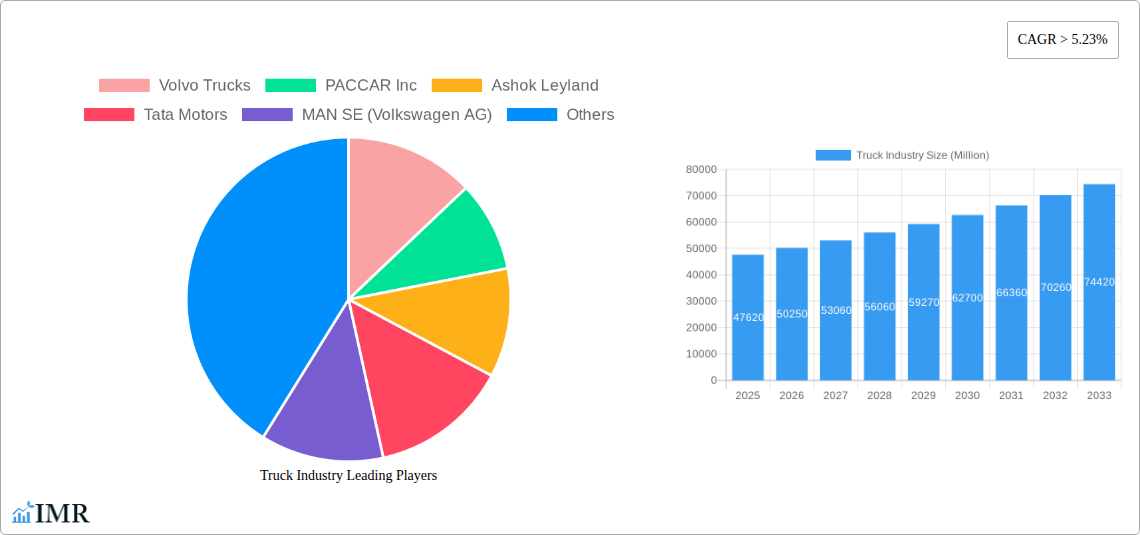
The global used truck market, valued at $47.62 billion in 2025, is projected to experience robust growth, exhibiting a Compound Annual Growth Rate (CAGR) exceeding 5.23% from 2025 to 2033. This expansion is driven by several key factors. The increasing demand for efficient and cost-effective transportation solutions across various industries, particularly logistics and e-commerce, fuels the need for used trucks. Furthermore, stringent emission regulations are pushing companies to upgrade their fleets, leading to a larger supply of used trucks entering the market. Technological advancements, such as telematics and improved engine efficiency in newer models, also contribute to the market's growth by enhancing the appeal of used trucks that are relatively newer and better equipped than older models. The market is segmented by vehicle type (light, medium, and heavy-duty trucks), sales channel (independent and franchised dealers, peer-to-peer), and geography, offering diverse investment and operational strategies. The competitive landscape includes established players like Volvo Trucks, PACCAR Inc., and Daimler AG, alongside regional manufacturers and online marketplaces facilitating peer-to-peer transactions. Growth is expected to be particularly strong in emerging markets in Asia-Pacific and other regions, driven by infrastructural development and economic growth.
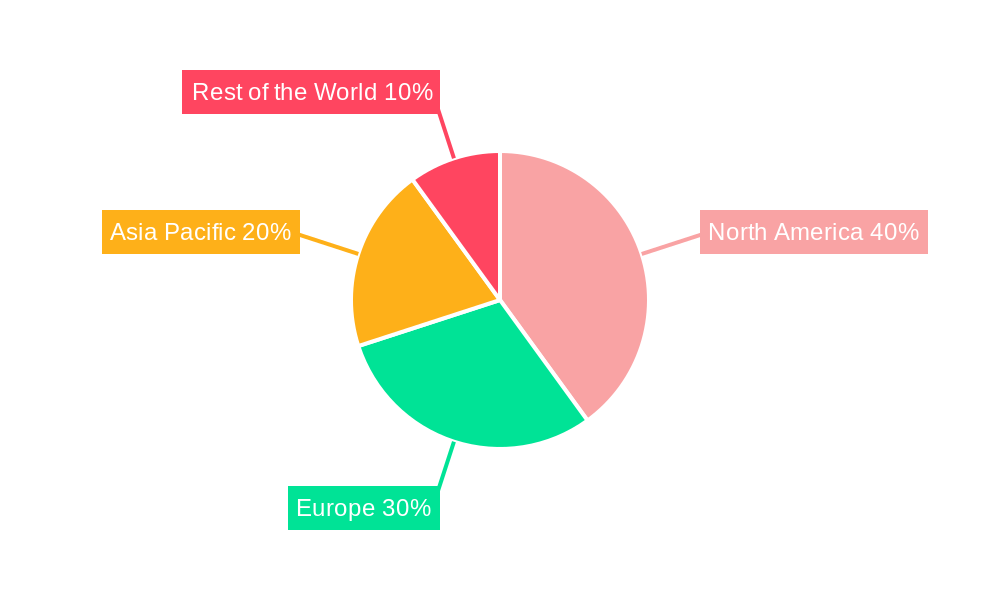
The geographical distribution of the used truck market reveals significant regional variations. North America, particularly the United States, holds a substantial market share due to a large trucking industry and established logistics networks. Europe follows as a major market, driven by robust economic activity and a well-developed transportation infrastructure. The Asia-Pacific region, especially China and India, is expected to witness the fastest growth due to expanding economies and increasing urbanization leading to higher freight demand. Market restraints include fluctuating fuel prices, economic downturns that impact freight volumes, and the availability of financing options for used truck purchases. However, the overall positive outlook stems from the persistent demand for efficient transportation coupled with the availability of reasonably priced, well-maintained used trucks. The long-term forecast indicates continued market expansion driven by technological advancements and sustainable transportation initiatives. The market is likely to see a shift towards online platforms and digital sales channels.
This comprehensive report provides an in-depth analysis of the global truck industry, encompassing market dynamics, growth trends, regional segmentation, product landscape, key players, and future outlook. The study period covers 2019-2033, with 2025 as the base and estimated year. The report segments the market by vehicle type (light, medium, and heavy-duty trucks) and sales channel (independent dealer, franchised dealer, peer-to-peer), offering granular insights into market size (in million units) and future growth projections.
Truck Industry Market Dynamics & Structure
This section analyzes the intricate dynamics of the truck industry, including market concentration, technological advancements, regulatory landscapes, competitive pressures, end-user demographics, and mergers & acquisitions (M&A) activity. The global truck market exhibits a moderately concentrated structure, with several major players commanding significant market share. However, the presence of numerous smaller players, particularly in regional markets, ensures a dynamic competitive environment.
Market Concentration: The top 10 players account for approximately xx% of the global market share in 2025, with Volvo Trucks, PACCAR Inc., and Daimler AG among the leading players.
Technological Innovation: The industry is witnessing rapid technological advancements, driven by the increasing adoption of connected vehicle technology, autonomous driving systems, and alternative fuel vehicles (AFVs). However, high initial investment costs and regulatory uncertainties pose challenges to widespread adoption.
Regulatory Frameworks: Stringent emission regulations (e.g., Euro VI, BS VI) and safety standards are influencing vehicle design and manufacturing processes, driving the need for technological innovation and impacting the cost of production.
Competitive Product Substitutes: Alternative transportation modes like rail and maritime shipping pose competition for long-haul trucking. However, the truck industry's flexibility and accessibility continue to ensure its dominance in certain segments.
End-User Demographics: The trucking industry serves diverse end-users, including logistics companies, freight carriers, construction firms, and retail businesses. Understanding the specific needs of each segment is crucial for targeted product development and marketing.
M&A Trends: The truck industry has witnessed a moderate level of M&A activity in recent years, with strategic acquisitions aimed at expanding market reach, enhancing technological capabilities, and optimizing supply chains. The number of M&A deals in the past five years is estimated at xx.
Truck Industry Growth Trends & Insights
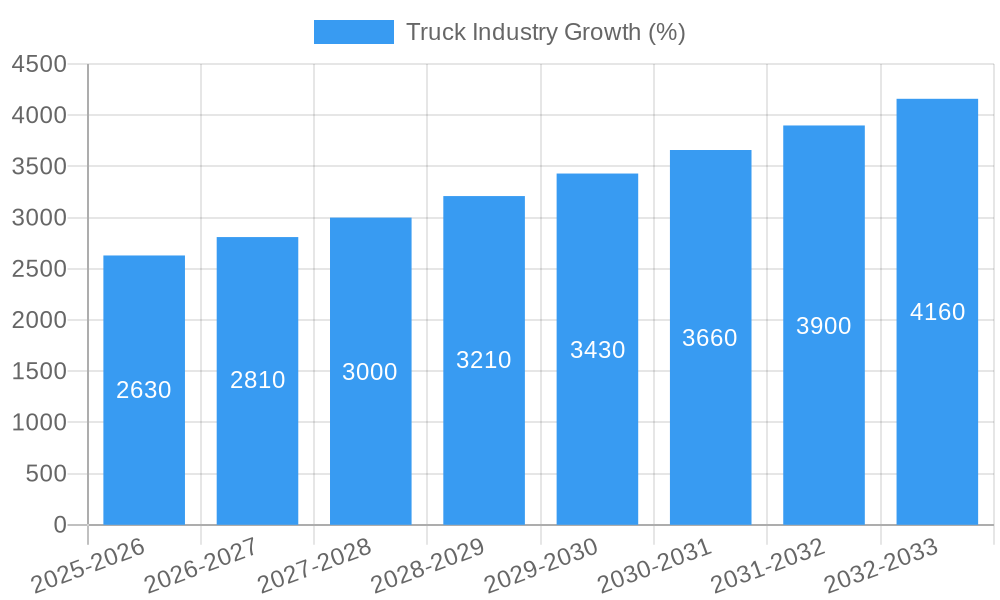
This section utilizes extensive data analysis to present a comprehensive overview of the truck industry's growth trends, including market size evolution, adoption rates across various segments, technological disruptions impacting the industry landscape, and shifts in consumer behavior. The historical period (2019-2024) reveals significant fluctuations influenced by global economic conditions and technological transitions. The forecast period (2025-2033) projects a compound annual growth rate (CAGR) of xx% for the overall market, with variations across different segments.
Market size is expected to reach xx million units by 2033. The increasing adoption of technology, particularly in areas like telematics and driver-assistance systems, has increased the efficiency and safety of trucking operations, leading to a surge in market growth. Furthermore, an overall improvement in global economic health during this period will drive substantial market growth. However, regulatory uncertainties regarding emissions, and technological shifts continue to add a level of volatility to the market. The overall consumer behavior shift is towards environmentally friendly options, which is gradually pushing the market towards electric trucks and sustainable logistic options.
Dominant Regions, Countries, or Segments in Truck Industry
This section pinpoints the leading regions, countries, and segments driving the market's growth.
Vehicle Type: The heavy-duty truck segment is expected to dominate the market throughout the forecast period, driven by increased demand from the construction, logistics, and manufacturing sectors. Heavy-duty trucks accounted for approximately xx% of the total market in 2025.
Sales Channel: Franchised dealers maintain their market dominance, accounting for xx% of sales in 2025. However, the peer-to-peer sales channel is witnessing substantial growth, driven by increased online adoption and digitalization.
Geography: North America and Asia-Pacific are expected to be the leading regions, owing to robust infrastructure development, industrial expansion, and thriving e-commerce activities.
Key Drivers:
- Robust infrastructure development
- Economic growth
- Increasing urbanization
- Rise in e-commerce
- Favorable government policies
Dominance Factors:
- Strong presence of established players
- Developed infrastructure and supply chains
- Large end-user base
Truck Industry Product Landscape
The truck industry showcases constant product innovation, focusing on improving fuel efficiency, safety features, and technological integration. Advanced driver-assistance systems (ADAS), telematics, and connectivity are becoming increasingly common, enhancing operational efficiency and safety. The introduction of electric and alternative fuel trucks is gaining traction, driven by environmental concerns and government regulations. Unique selling propositions include improved payload capacity, enhanced fuel economy, and advanced safety features.
Key Drivers, Barriers & Challenges in Truck Industry
Key Drivers:
- Technological advancements in areas such as electrification, automation, and connectivity are driving demand.
- Growing e-commerce and logistics sectors are fueling demand for efficient and reliable transportation solutions.
- Infrastructure development in emerging economies is creating new market opportunities.
Challenges & Restraints:
- Stringent emission regulations and increasing fuel costs pose significant challenges to the industry.
- Supply chain disruptions and component shortages can severely impact production and delivery timelines. These disruptions are estimated to have caused a xx% reduction in production during 2022.
- Intense competition among established players and the emergence of new entrants keeps profit margins under pressure.
Emerging Opportunities in Truck Industry
Emerging opportunities include the growth of autonomous trucking technology, the rise of the shared economy in the transportation sector, and the expanding market for specialized trucks in niche sectors (e.g., construction, mining). The increasing adoption of telematics and data analytics provides opportunities to optimize fleet management and improve operational efficiency. Untapped markets in developing countries offer significant growth potential.
Growth Accelerators in the Truck Industry Industry
Technological breakthroughs such as the development of electric and autonomous vehicles are key growth catalysts. Strategic partnerships between truck manufacturers, technology companies, and logistics providers are also driving growth. Expansion into new markets and diversification into related services like fleet management and maintenance are further accelerating market growth.
Key Players Shaping the Truck Industry Market
- Volvo Trucks
- PACCAR Inc.
- Ashok Leyland
- Tata Motors
- MAN SE (Volkswagen AG)
- Scania AB (Traton SE)
- Navistar International Corporation
- Eicher
- Renault SA
- Mascus
- Daimler AG (SelecTrucks)
- Enterprise Truck Rental
- AmeriQuest Used Truck
Notable Milestones in Truck Industry Sector
- August 2023: Ashok Leyland launched its e-marketplace 'Re-AL' for used trucks, facilitating vehicle exchange and upgrades.
- June 2023: Daimler launched the "Bharat Benz Certified" platform for pre-owned trucks, focusing on quality assurance and customer trust.
In-Depth Truck Industry Market Outlook
The truck industry is poised for continued growth, driven by technological advancements, increasing demand from key sectors, and expansion into new markets. Strategic investments in research and development, sustainable technologies, and innovative business models will shape the future competitive landscape. The long-term outlook remains positive, with significant potential for market expansion and the emergence of new business opportunities. The market is expected to witness increased consolidation through mergers and acquisitions, leading to a more concentrated landscape in the years to come.
Truck Industry Segmentation
-
1. Vehicle Type
- 1.1. Light Trucks
- 1.2. Medium-duty Trucks
- 1.3. Heavy-duty Trucks
-
2. Sales Channel
- 2.1. Independent Dealer
- 2.2. Franchised Dealer
- 2.3. Peer-to-peer
Truck Industry Segmentation By Geography
-
1. North America
- 1.1. United States
- 1.2. Canada
- 1.3. Rest of North America
-
2. Europe
- 2.1. Germany
- 2.2. United Kingdom
- 2.3. France
- 2.4. Russia
- 2.5. Italy
- 2.6. Rest of Europe
-
3. Asia Pacific
- 3.1. China
- 3.2. Japan
- 3.3. India
- 3.4. South Korea
- 3.5. Rest of Asia Pacific
-
4. Rest of the World
- 4.1. Brazil
- 4.2. South Africa
- 4.3. Other Countries
Truck Industry REPORT HIGHLIGHTS
| Aspects | Details |
|---|---|
| Study Period | 2019-2033 |
| Base Year | 2024 |
| Estimated Year | 2025 |
| Forecast Period | 2025-2033 |
| Historical Period | 2019-2024 |
| Growth Rate | CAGR of > 5.23% from 2019-2033 |
| Segmentation |
|
Table of Contents
- 1. Introduction
- 1.1. Research Scope
- 1.2. Market Segmentation
- 1.3. Research Methodology
- 1.4. Definitions and Assumptions
- 2. Executive Summary
- 2.1. Introduction
- 3. Market Dynamics
- 3.1. Introduction
- 3.2. Market Drivers
- 3.2.1. Increasing Infrastructure and Growing Construction Activities are Driving the Demand for Used Trucks; Cost Effectiveness and Affordability are Fueling the Demand for Used Trucks
- 3.3. Market Restrains
- 3.3.1. Stringent Emission and Safety Standards Present Challenges for the Market
- 3.4. Market Trends
- 3.4.1. Heavy-duty Trucks Will be the Leading Segment
- 4. Market Factor Analysis
- 4.1. Porters Five Forces
- 4.2. Supply/Value Chain
- 4.3. PESTEL analysis
- 4.4. Market Entropy
- 4.5. Patent/Trademark Analysis
- 5. Global Truck Industry Analysis, Insights and Forecast, 2019-2031
- 5.1. Market Analysis, Insights and Forecast - by Vehicle Type
- 5.1.1. Light Trucks
- 5.1.2. Medium-duty Trucks
- 5.1.3. Heavy-duty Trucks
- 5.2. Market Analysis, Insights and Forecast - by Sales Channel
- 5.2.1. Independent Dealer
- 5.2.2. Franchised Dealer
- 5.2.3. Peer-to-peer
- 5.3. Market Analysis, Insights and Forecast - by Region
- 5.3.1. North America
- 5.3.2. Europe
- 5.3.3. Asia Pacific
- 5.3.4. Rest of the World
- 5.1. Market Analysis, Insights and Forecast - by Vehicle Type
- 6. North America Truck Industry Analysis, Insights and Forecast, 2019-2031
- 6.1. Market Analysis, Insights and Forecast - by Vehicle Type
- 6.1.1. Light Trucks
- 6.1.2. Medium-duty Trucks
- 6.1.3. Heavy-duty Trucks
- 6.2. Market Analysis, Insights and Forecast - by Sales Channel
- 6.2.1. Independent Dealer
- 6.2.2. Franchised Dealer
- 6.2.3. Peer-to-peer
- 6.1. Market Analysis, Insights and Forecast - by Vehicle Type
- 7. Europe Truck Industry Analysis, Insights and Forecast, 2019-2031
- 7.1. Market Analysis, Insights and Forecast - by Vehicle Type
- 7.1.1. Light Trucks
- 7.1.2. Medium-duty Trucks
- 7.1.3. Heavy-duty Trucks
- 7.2. Market Analysis, Insights and Forecast - by Sales Channel
- 7.2.1. Independent Dealer
- 7.2.2. Franchised Dealer
- 7.2.3. Peer-to-peer
- 7.1. Market Analysis, Insights and Forecast - by Vehicle Type
- 8. Asia Pacific Truck Industry Analysis, Insights and Forecast, 2019-2031
- 8.1. Market Analysis, Insights and Forecast - by Vehicle Type
- 8.1.1. Light Trucks
- 8.1.2. Medium-duty Trucks
- 8.1.3. Heavy-duty Trucks
- 8.2. Market Analysis, Insights and Forecast - by Sales Channel
- 8.2.1. Independent Dealer
- 8.2.2. Franchised Dealer
- 8.2.3. Peer-to-peer
- 8.1. Market Analysis, Insights and Forecast - by Vehicle Type
- 9. Rest of the World Truck Industry Analysis, Insights and Forecast, 2019-2031
- 9.1. Market Analysis, Insights and Forecast - by Vehicle Type
- 9.1.1. Light Trucks
- 9.1.2. Medium-duty Trucks
- 9.1.3. Heavy-duty Trucks
- 9.2. Market Analysis, Insights and Forecast - by Sales Channel
- 9.2.1. Independent Dealer
- 9.2.2. Franchised Dealer
- 9.2.3. Peer-to-peer
- 9.1. Market Analysis, Insights and Forecast - by Vehicle Type
- 10. North America Truck Industry Analysis, Insights and Forecast, 2019-2031
- 10.1. Market Analysis, Insights and Forecast - By Country/Sub-region
- 10.1.1 United States
- 10.1.2 Canada
- 10.1.3 Rest of North America
- 11. Europe Truck Industry Analysis, Insights and Forecast, 2019-2031
- 11.1. Market Analysis, Insights and Forecast - By Country/Sub-region
- 11.1.1 Germany
- 11.1.2 United Kingdom
- 11.1.3 France
- 11.1.4 Russia
- 11.1.5 Italy
- 11.1.6 Rest of Europe
- 12. Asia Pacific Truck Industry Analysis, Insights and Forecast, 2019-2031
- 12.1. Market Analysis, Insights and Forecast - By Country/Sub-region
- 12.1.1 China
- 12.1.2 Japan
- 12.1.3 India
- 12.1.4 South Korea
- 12.1.5 Rest of Asia Pacific
- 13. Rest of the World Truck Industry Analysis, Insights and Forecast, 2019-2031
- 13.1. Market Analysis, Insights and Forecast - By Country/Sub-region
- 13.1.1 Brazil
- 13.1.2 South Africa
- 13.1.3 Other Countries
- 14. Competitive Analysis
- 14.1. Global Market Share Analysis 2024
- 14.2. Company Profiles
- 14.2.1 Volvo Trucks
- 14.2.1.1. Overview
- 14.2.1.2. Products
- 14.2.1.3. SWOT Analysis
- 14.2.1.4. Recent Developments
- 14.2.1.5. Financials (Based on Availability)
- 14.2.2 PACCAR Inc
- 14.2.2.1. Overview
- 14.2.2.2. Products
- 14.2.2.3. SWOT Analysis
- 14.2.2.4. Recent Developments
- 14.2.2.5. Financials (Based on Availability)
- 14.2.3 Ashok Leyland
- 14.2.3.1. Overview
- 14.2.3.2. Products
- 14.2.3.3. SWOT Analysis
- 14.2.3.4. Recent Developments
- 14.2.3.5. Financials (Based on Availability)
- 14.2.4 Tata Motors
- 14.2.4.1. Overview
- 14.2.4.2. Products
- 14.2.4.3. SWOT Analysis
- 14.2.4.4. Recent Developments
- 14.2.4.5. Financials (Based on Availability)
- 14.2.5 MAN SE (Volkswagen AG)
- 14.2.5.1. Overview
- 14.2.5.2. Products
- 14.2.5.3. SWOT Analysis
- 14.2.5.4. Recent Developments
- 14.2.5.5. Financials (Based on Availability)
- 14.2.6 Scania AB ( Traton SE)
- 14.2.6.1. Overview
- 14.2.6.2. Products
- 14.2.6.3. SWOT Analysis
- 14.2.6.4. Recent Developments
- 14.2.6.5. Financials (Based on Availability)
- 14.2.7 Navistar International Corporation
- 14.2.7.1. Overview
- 14.2.7.2. Products
- 14.2.7.3. SWOT Analysis
- 14.2.7.4. Recent Developments
- 14.2.7.5. Financials (Based on Availability)
- 14.2.8 Eicher
- 14.2.8.1. Overview
- 14.2.8.2. Products
- 14.2.8.3. SWOT Analysis
- 14.2.8.4. Recent Developments
- 14.2.8.5. Financials (Based on Availability)
- 14.2.9 Renault SA
- 14.2.9.1. Overview
- 14.2.9.2. Products
- 14.2.9.3. SWOT Analysis
- 14.2.9.4. Recent Developments
- 14.2.9.5. Financials (Based on Availability)
- 14.2.10 Mascus
- 14.2.10.1. Overview
- 14.2.10.2. Products
- 14.2.10.3. SWOT Analysis
- 14.2.10.4. Recent Developments
- 14.2.10.5. Financials (Based on Availability)
- 14.2.11 Daimler AG (SelecTrucks)
- 14.2.11.1. Overview
- 14.2.11.2. Products
- 14.2.11.3. SWOT Analysis
- 14.2.11.4. Recent Developments
- 14.2.11.5. Financials (Based on Availability)
- 14.2.12 Enterprise Truck Rental
- 14.2.12.1. Overview
- 14.2.12.2. Products
- 14.2.12.3. SWOT Analysis
- 14.2.12.4. Recent Developments
- 14.2.12.5. Financials (Based on Availability)
- 14.2.13 AmeriQuest Used Truck
- 14.2.13.1. Overview
- 14.2.13.2. Products
- 14.2.13.3. SWOT Analysis
- 14.2.13.4. Recent Developments
- 14.2.13.5. Financials (Based on Availability)
- 14.2.1 Volvo Trucks
List of Figures
- Figure 1: Global Truck Industry Revenue Breakdown (Million, %) by Region 2024 & 2032
- Figure 2: North America Truck Industry Revenue (Million), by Country 2024 & 2032
- Figure 3: North America Truck Industry Revenue Share (%), by Country 2024 & 2032
- Figure 4: Europe Truck Industry Revenue (Million), by Country 2024 & 2032
- Figure 5: Europe Truck Industry Revenue Share (%), by Country 2024 & 2032
- Figure 6: Asia Pacific Truck Industry Revenue (Million), by Country 2024 & 2032
- Figure 7: Asia Pacific Truck Industry Revenue Share (%), by Country 2024 & 2032
- Figure 8: Rest of the World Truck Industry Revenue (Million), by Country 2024 & 2032
- Figure 9: Rest of the World Truck Industry Revenue Share (%), by Country 2024 & 2032
- Figure 10: North America Truck Industry Revenue (Million), by Vehicle Type 2024 & 2032
- Figure 11: North America Truck Industry Revenue Share (%), by Vehicle Type 2024 & 2032
- Figure 12: North America Truck Industry Revenue (Million), by Sales Channel 2024 & 2032
- Figure 13: North America Truck Industry Revenue Share (%), by Sales Channel 2024 & 2032
- Figure 14: North America Truck Industry Revenue (Million), by Country 2024 & 2032
- Figure 15: North America Truck Industry Revenue Share (%), by Country 2024 & 2032
- Figure 16: Europe Truck Industry Revenue (Million), by Vehicle Type 2024 & 2032
- Figure 17: Europe Truck Industry Revenue Share (%), by Vehicle Type 2024 & 2032
- Figure 18: Europe Truck Industry Revenue (Million), by Sales Channel 2024 & 2032
- Figure 19: Europe Truck Industry Revenue Share (%), by Sales Channel 2024 & 2032
- Figure 20: Europe Truck Industry Revenue (Million), by Country 2024 & 2032
- Figure 21: Europe Truck Industry Revenue Share (%), by Country 2024 & 2032
- Figure 22: Asia Pacific Truck Industry Revenue (Million), by Vehicle Type 2024 & 2032
- Figure 23: Asia Pacific Truck Industry Revenue Share (%), by Vehicle Type 2024 & 2032
- Figure 24: Asia Pacific Truck Industry Revenue (Million), by Sales Channel 2024 & 2032
- Figure 25: Asia Pacific Truck Industry Revenue Share (%), by Sales Channel 2024 & 2032
- Figure 26: Asia Pacific Truck Industry Revenue (Million), by Country 2024 & 2032
- Figure 27: Asia Pacific Truck Industry Revenue Share (%), by Country 2024 & 2032
- Figure 28: Rest of the World Truck Industry Revenue (Million), by Vehicle Type 2024 & 2032
- Figure 29: Rest of the World Truck Industry Revenue Share (%), by Vehicle Type 2024 & 2032
- Figure 30: Rest of the World Truck Industry Revenue (Million), by Sales Channel 2024 & 2032
- Figure 31: Rest of the World Truck Industry Revenue Share (%), by Sales Channel 2024 & 2032
- Figure 32: Rest of the World Truck Industry Revenue (Million), by Country 2024 & 2032
- Figure 33: Rest of the World Truck Industry Revenue Share (%), by Country 2024 & 2032
List of Tables
- Table 1: Global Truck Industry Revenue Million Forecast, by Region 2019 & 2032
- Table 2: Global Truck Industry Revenue Million Forecast, by Vehicle Type 2019 & 2032
- Table 3: Global Truck Industry Revenue Million Forecast, by Sales Channel 2019 & 2032
- Table 4: Global Truck Industry Revenue Million Forecast, by Region 2019 & 2032
- Table 5: Global Truck Industry Revenue Million Forecast, by Country 2019 & 2032
- Table 6: United States Truck Industry Revenue (Million) Forecast, by Application 2019 & 2032
- Table 7: Canada Truck Industry Revenue (Million) Forecast, by Application 2019 & 2032
- Table 8: Rest of North America Truck Industry Revenue (Million) Forecast, by Application 2019 & 2032
- Table 9: Global Truck Industry Revenue Million Forecast, by Country 2019 & 2032
- Table 10: Germany Truck Industry Revenue (Million) Forecast, by Application 2019 & 2032
- Table 11: United Kingdom Truck Industry Revenue (Million) Forecast, by Application 2019 & 2032
- Table 12: France Truck Industry Revenue (Million) Forecast, by Application 2019 & 2032
- Table 13: Russia Truck Industry Revenue (Million) Forecast, by Application 2019 & 2032
- Table 14: Italy Truck Industry Revenue (Million) Forecast, by Application 2019 & 2032
- Table 15: Rest of Europe Truck Industry Revenue (Million) Forecast, by Application 2019 & 2032
- Table 16: Global Truck Industry Revenue Million Forecast, by Country 2019 & 2032
- Table 17: China Truck Industry Revenue (Million) Forecast, by Application 2019 & 2032
- Table 18: Japan Truck Industry Revenue (Million) Forecast, by Application 2019 & 2032
- Table 19: India Truck Industry Revenue (Million) Forecast, by Application 2019 & 2032
- Table 20: South Korea Truck Industry Revenue (Million) Forecast, by Application 2019 & 2032
- Table 21: Rest of Asia Pacific Truck Industry Revenue (Million) Forecast, by Application 2019 & 2032
- Table 22: Global Truck Industry Revenue Million Forecast, by Country 2019 & 2032
- Table 23: Brazil Truck Industry Revenue (Million) Forecast, by Application 2019 & 2032
- Table 24: South Africa Truck Industry Revenue (Million) Forecast, by Application 2019 & 2032
- Table 25: Other Countries Truck Industry Revenue (Million) Forecast, by Application 2019 & 2032
- Table 26: Global Truck Industry Revenue Million Forecast, by Vehicle Type 2019 & 2032
- Table 27: Global Truck Industry Revenue Million Forecast, by Sales Channel 2019 & 2032
- Table 28: Global Truck Industry Revenue Million Forecast, by Country 2019 & 2032
- Table 29: United States Truck Industry Revenue (Million) Forecast, by Application 2019 & 2032
- Table 30: Canada Truck Industry Revenue (Million) Forecast, by Application 2019 & 2032
- Table 31: Rest of North America Truck Industry Revenue (Million) Forecast, by Application 2019 & 2032
- Table 32: Global Truck Industry Revenue Million Forecast, by Vehicle Type 2019 & 2032
- Table 33: Global Truck Industry Revenue Million Forecast, by Sales Channel 2019 & 2032
- Table 34: Global Truck Industry Revenue Million Forecast, by Country 2019 & 2032
- Table 35: Germany Truck Industry Revenue (Million) Forecast, by Application 2019 & 2032
- Table 36: United Kingdom Truck Industry Revenue (Million) Forecast, by Application 2019 & 2032
- Table 37: France Truck Industry Revenue (Million) Forecast, by Application 2019 & 2032
- Table 38: Russia Truck Industry Revenue (Million) Forecast, by Application 2019 & 2032
- Table 39: Italy Truck Industry Revenue (Million) Forecast, by Application 2019 & 2032
- Table 40: Rest of Europe Truck Industry Revenue (Million) Forecast, by Application 2019 & 2032
- Table 41: Global Truck Industry Revenue Million Forecast, by Vehicle Type 2019 & 2032
- Table 42: Global Truck Industry Revenue Million Forecast, by Sales Channel 2019 & 2032
- Table 43: Global Truck Industry Revenue Million Forecast, by Country 2019 & 2032
- Table 44: China Truck Industry Revenue (Million) Forecast, by Application 2019 & 2032
- Table 45: Japan Truck Industry Revenue (Million) Forecast, by Application 2019 & 2032
- Table 46: India Truck Industry Revenue (Million) Forecast, by Application 2019 & 2032
- Table 47: South Korea Truck Industry Revenue (Million) Forecast, by Application 2019 & 2032
- Table 48: Rest of Asia Pacific Truck Industry Revenue (Million) Forecast, by Application 2019 & 2032
- Table 49: Global Truck Industry Revenue Million Forecast, by Vehicle Type 2019 & 2032
- Table 50: Global Truck Industry Revenue Million Forecast, by Sales Channel 2019 & 2032
- Table 51: Global Truck Industry Revenue Million Forecast, by Country 2019 & 2032
- Table 52: Brazil Truck Industry Revenue (Million) Forecast, by Application 2019 & 2032
- Table 53: South Africa Truck Industry Revenue (Million) Forecast, by Application 2019 & 2032
- Table 54: Other Countries Truck Industry Revenue (Million) Forecast, by Application 2019 & 2032
Frequently Asked Questions
1. What is the projected Compound Annual Growth Rate (CAGR) of the Truck Industry?
The projected CAGR is approximately > 5.23%.
2. Which companies are prominent players in the Truck Industry?
Key companies in the market include Volvo Trucks, PACCAR Inc, Ashok Leyland, Tata Motors, MAN SE (Volkswagen AG), Scania AB ( Traton SE), Navistar International Corporation, Eicher, Renault SA, Mascus, Daimler AG (SelecTrucks), Enterprise Truck Rental, AmeriQuest Used Truck.
3. What are the main segments of the Truck Industry?
The market segments include Vehicle Type, Sales Channel.
4. Can you provide details about the market size?
The market size is estimated to be USD 47.62 Million as of 2022.
5. What are some drivers contributing to market growth?
Increasing Infrastructure and Growing Construction Activities are Driving the Demand for Used Trucks; Cost Effectiveness and Affordability are Fueling the Demand for Used Trucks.
6. What are the notable trends driving market growth?
Heavy-duty Trucks Will be the Leading Segment.
7. Are there any restraints impacting market growth?
Stringent Emission and Safety Standards Present Challenges for the Market.
8. Can you provide examples of recent developments in the market?
August 2023: Ashok Leyland introduced its e-marketplace 'Re-AL', dedicated to the sale of used trucks. The platform enables customers to exchange their existing commercial vehicles and upgrade to new Ashok Leyland trucks and buses. The e-marketplace provides customers with various features to help them easily locate vehicles of their choice, including verified images of the vehicles, validated documents, and evaluation reports.
9. What pricing options are available for accessing the report?
Pricing options include single-user, multi-user, and enterprise licenses priced at USD 4750, USD 5250, and USD 8750 respectively.
10. Is the market size provided in terms of value or volume?
The market size is provided in terms of value, measured in Million.
11. Are there any specific market keywords associated with the report?
Yes, the market keyword associated with the report is "Truck Industry," which aids in identifying and referencing the specific market segment covered.
12. How do I determine which pricing option suits my needs best?
The pricing options vary based on user requirements and access needs. Individual users may opt for single-user licenses, while businesses requiring broader access may choose multi-user or enterprise licenses for cost-effective access to the report.
13. Are there any additional resources or data provided in the Truck Industry report?
While the report offers comprehensive insights, it's advisable to review the specific contents or supplementary materials provided to ascertain if additional resources or data are available.
14. How can I stay updated on further developments or reports in the Truck Industry?
To stay informed about further developments, trends, and reports in the Truck Industry, consider subscribing to industry newsletters, following relevant companies and organizations, or regularly checking reputable industry news sources and publications.
Methodology
Step 1 - Identification of Relevant Samples Size from Population Database


Step 2 - Approaches for Defining Global Market Size (Value, Volume* & Price*)

Note*: In applicable scenarios
Step 3 - Data Sources
Primary Research
- Web Analytics
- Survey Reports
- Research Institute
- Latest Research Reports
- Opinion Leaders
Secondary Research
- Annual Reports
- White Paper
- Latest Press Release
- Industry Association
- Paid Database
- Investor Presentations

Step 4 - Data Triangulation
Involves using different sources of information in order to increase the validity of a study
These sources are likely to be stakeholders in a program - participants, other researchers, program staff, other community members, and so on.
Then we put all data in single framework & apply various statistical tools to find out the dynamic on the market.
During the analysis stage, feedback from the stakeholder groups would be compared to determine areas of agreement as well as areas of divergence
