

Key Insights
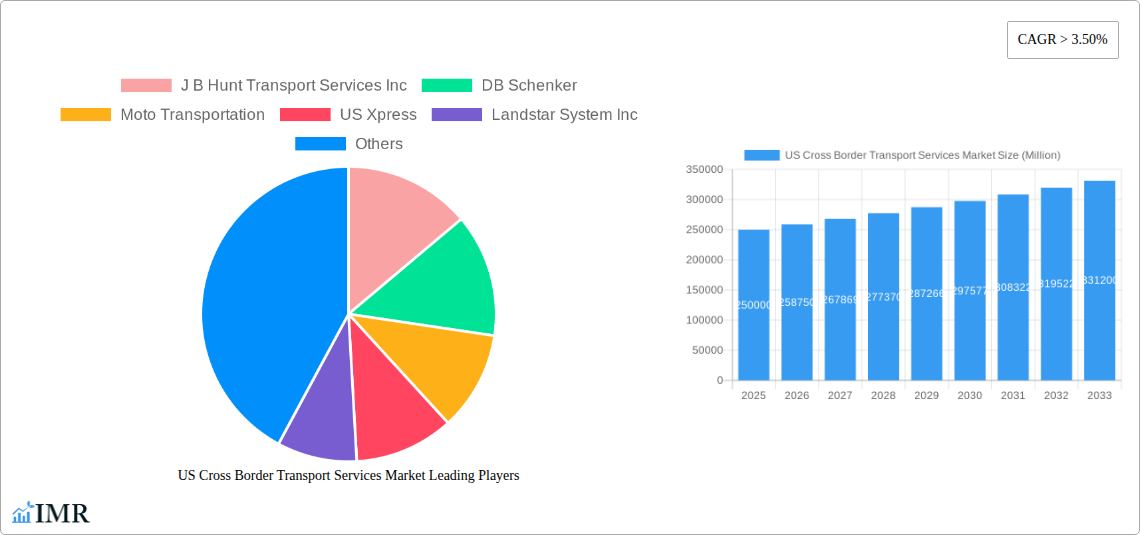
The US cross-border transport services market, valued at approximately $250 billion in 2025, is experiencing robust growth, projected to maintain a compound annual growth rate (CAGR) exceeding 3.5% through 2033. This expansion is driven by several key factors. Increased cross-border trade, fueled by globalization and the rise of e-commerce, necessitates efficient and reliable transportation solutions. The growth of manufacturing and automotive industries, particularly in regions like the Southeast and Southwest, significantly contributes to the demand for cross-border trucking services, both Full Truck Load (FTL) and Less-than-Truckload (LTL). Furthermore, the burgeoning oil and gas sector in specific regions, along with the expanding agricultural and construction industries, further stimulates market growth. Technological advancements, such as improved logistics software and GPS tracking, enhance operational efficiency and transparency, making cross-border transport more attractive. While regulatory complexities and fluctuating fuel prices pose some challenges, the overall market outlook remains positive, with significant opportunities for companies like J.B. Hunt, DB Schenker, and UPS to capitalize on increasing demand.
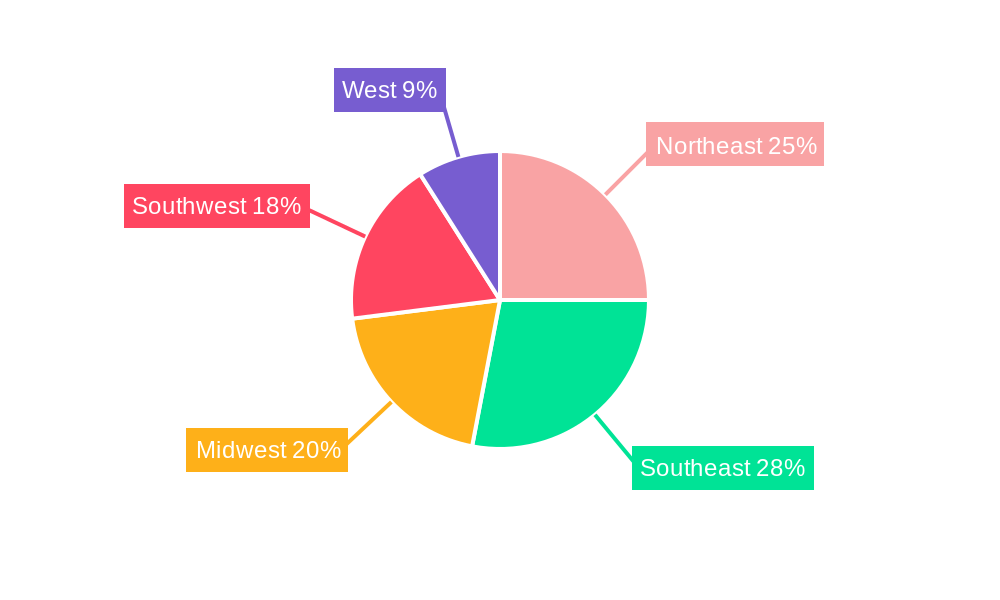
The market segmentation reveals that FTL services currently hold the largest share, owing to their cost-effectiveness for large shipments. However, the LTL and Courier, Express, and Parcel (CEP) segments are also exhibiting strong growth, particularly driven by the rise of e-commerce and the need for faster, smaller-scale deliveries. Geographically, the Northeast, Southeast, and West regions are leading market contributors, reflecting high concentrations of manufacturing, industrial activity, and population density. Competition remains intense amongst established players and emerging logistics providers. The ongoing investments in infrastructure improvements and technological innovations within the US transportation sector are expected to further support the sustained growth trajectory of the cross-border transport services market in the coming years. Strategic partnerships, acquisitions, and operational optimizations will be crucial for companies seeking to maintain a competitive edge.
US Cross Border Transport Services Market Report: 2019-2033
This comprehensive report provides an in-depth analysis of the US Cross Border Transport Services market, encompassing market size, growth trends, key players, and future outlook. The study period covers 2019-2033, with 2025 as the base year and a forecast period of 2025-2033. The report segments the market by end-user (Manufacturing & Automotive, Oil & Gas, Mining & Quarrying, Agriculture, Fishing & Forestry, Construction, Distributive Trade, Other End Users) and service type (Full Truck Load (FTL), Less-than-Truckload (LTL), Courier, Express, and Parcel (CEP)). This analysis will equip businesses with the insights needed to navigate this dynamic market.
US Cross Border Transport Services Market Dynamics & Structure
The US cross-border transport services market is a highly competitive landscape characterized by a mix of large multinational corporations and smaller specialized carriers. Market concentration is moderate, with the top 10 players holding an estimated xx% market share in 2025. Technological innovation is a key driver, with advancements in telematics, route optimization software, and autonomous vehicles shaping operational efficiency and cost reduction.
- Market Concentration: Moderately concentrated, top 10 players holding xx% market share (2025).
- Technological Innovation: Telematics, route optimization, and autonomous vehicle technology are driving efficiency gains.
- Regulatory Framework: Compliance with customs regulations, safety standards, and environmental regulations presents significant operational challenges.
- Competitive Product Substitutes: Rail transport and air freight offer alternative solutions for certain types of goods and distances.
- End-User Demographics: The market is driven by diverse end-users, with Manufacturing and Automotive, and Distributive Trade representing significant segments.
- M&A Trends: Consolidation is a prominent trend, as evidenced by recent acquisitions like DB Schenker's acquisition of USA Truck and KAG Logistics' acquisition of Connectrans Logistics, highlighting the drive for increased scale and capacity. The number of M&A deals in the period 2019-2024 is estimated at xx.
US Cross Border Transport Services Market Growth Trends & Insights
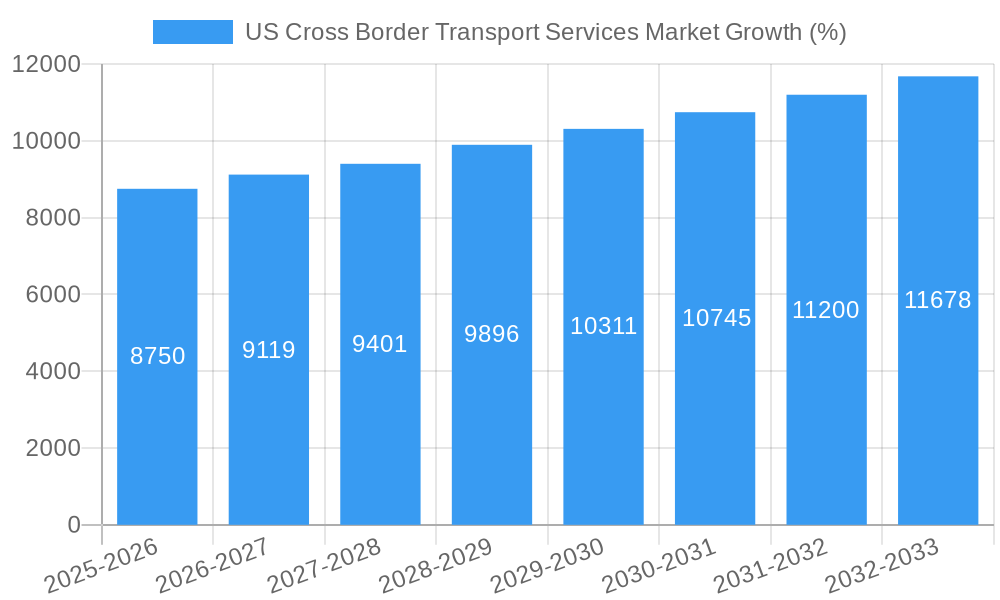
The US cross-border transport services market experienced significant growth between 2019 and 2024, driven by increasing cross-border trade and e-commerce activities. The market size reached an estimated xx million USD in 2024. Adoption rates of advanced logistics technologies, such as real-time tracking and predictive analytics, are increasing, enhancing supply chain visibility and efficiency. However, fluctuating fuel prices and geopolitical uncertainties pose significant challenges. Consumer behavior shifts towards faster and more reliable delivery options are creating opportunities for expedited services and specialized solutions. The Compound Annual Growth Rate (CAGR) during the historical period (2019-2024) was xx%, and is projected to be xx% during the forecast period (2025-2033), with the market size expected to reach xx million USD by 2033. Market penetration of advanced logistics technologies is estimated at xx% in 2025, projected to reach xx% by 2033.
Dominant Regions, Countries, or Segments in US Cross Border Transport Services Market
The Manufacturing and Automotive segment, along with the Distributive Trade (Wholesale and Retail, including FMCG), are the dominant end-user segments, accounting for a combined xx% of the market in 2025. Within service types, Full Truck Load (FTL) and Less-than-Truckload (LTL) represent the largest shares. Growth is geographically concentrated in regions with significant cross-border trade activity and robust infrastructure.
Key Drivers:
- Economic policies: Trade agreements and free trade zones stimulate cross-border transportation.
- Infrastructure development: Investments in border crossings and transportation networks facilitate efficient movement of goods.
- E-commerce growth: Increased online shopping fuels demand for expedited cross-border delivery.
Dominance Factors:
- Manufacturing and Automotive: High volume of goods shipped across borders.
- Distributive Trade (FMCG): Time-sensitive deliveries and demand for efficient supply chains.
- FTL & LTL: Cost-effective solutions for different cargo volumes.
US Cross Border Transport Services Market Product Landscape
The market features a range of services, including FTL, LTL, and specialized transport options for temperature-sensitive goods, oversized cargo, and hazardous materials. Technological advancements such as telematics, GPS tracking, and route optimization software are enhancing operational efficiency and improving delivery times. Unique selling propositions include real-time visibility, predictive analytics, and customized solutions tailored to specific industry needs.
Key Drivers, Barriers & Challenges in US Cross Border Transport Services Market
Key Drivers: Growing cross-border e-commerce, increasing trade volumes between the US and its neighbors (Mexico and Canada), and technological advancements are key drivers.
Challenges: Fluctuating fuel prices, driver shortages, border crossing delays, and increasing regulatory scrutiny present significant challenges. These factors can lead to increased operational costs and delivery delays, impacting the overall market. For instance, driver shortages alone have been estimated to cause a xx% increase in transportation costs in some regions.
Emerging Opportunities in US Cross Border Transport Services Market
Opportunities exist in specialized transport solutions for temperature-sensitive goods and hazardous materials, sustainable transportation options, and the integration of blockchain technology for enhanced security and transparency. The expansion into underserved markets and leveraging technological advancements like AI and machine learning to optimize routes and predict disruptions will also provide growth opportunities.
Growth Accelerators in the US Cross Border Transport Services Market Industry
Technological breakthroughs such as autonomous trucking and improved route optimization software are accelerating growth. Strategic partnerships between logistics providers and technology companies are creating innovative solutions. Market expansion into emerging markets and diversifying service offerings to cater to evolving customer needs are crucial strategies for long-term growth.
Key Players Shaping the US Cross Border Transport Services Market Market
- J B Hunt Transport Services Inc
- DB Schenker
- Moto Transportation
- US Xpress
- Landstar System Inc
- C H Robinson
- United Parcel Service (UPS)
- YRC Worldwide Inc
- Schneider National
- FedEx
- Polaris Transportation Group
- Hitachi Transport System
- Swift Transportation Company
- XPO Logistics Inc
Notable Milestones in US Cross Border Transport Services Market Sector
- October 2022: KAG Logistics acquired Connectrans Logistics, expanding its cross-border capabilities between the US and Canada.
- September 2022: DB Schenker acquired USA Truck, significantly boosting its capacity and network in the US.
In-Depth US Cross Border Transport Services Market Market Outlook
The US cross-border transport services market is poised for continued growth, driven by technological advancements, increasing e-commerce activity, and the expansion of cross-border trade. Strategic partnerships, investment in infrastructure, and the adoption of sustainable transportation solutions will shape future market dynamics. The market's potential is vast, with opportunities for both established players and new entrants to capitalize on the growing demand for efficient and reliable cross-border transport services.
US Cross Border Transport Services Market Segmentation
-
1. Service
- 1.1. Full Truck Load (FTL)
- 1.2. Less-than Truckload (LTL)
- 1.3. Courier, Express, and Parcel (CEP)
-
2. End-user
- 2.1. Manufacturing and Automotive
- 2.2. Oil and Gas, Mining, and Quarrying
- 2.3. Agriculture, Fishing, and Forestry
- 2.4. Construction
- 2.5. Distribu
- 2.6. Other En
US Cross Border Transport Services Market Segmentation By Geography
-
1. North America
- 1.1. United States
- 1.2. Canada
- 1.3. Mexico
-
2. South America
- 2.1. Brazil
- 2.2. Argentina
- 2.3. Rest of South America
-
3. Europe
- 3.1. United Kingdom
- 3.2. Germany
- 3.3. France
- 3.4. Italy
- 3.5. Spain
- 3.6. Russia
- 3.7. Benelux
- 3.8. Nordics
- 3.9. Rest of Europe
-
4. Middle East & Africa
- 4.1. Turkey
- 4.2. Israel
- 4.3. GCC
- 4.4. North Africa
- 4.5. South Africa
- 4.6. Rest of Middle East & Africa
-
5. Asia Pacific
- 5.1. China
- 5.2. India
- 5.3. Japan
- 5.4. South Korea
- 5.5. ASEAN
- 5.6. Oceania
- 5.7. Rest of Asia Pacific
US Cross Border Transport Services Market REPORT HIGHLIGHTS
| Aspects | Details |
|---|---|
| Study Period | 2019-2033 |
| Base Year | 2024 |
| Estimated Year | 2025 |
| Forecast Period | 2025-2033 |
| Historical Period | 2019-2024 |
| Growth Rate | CAGR of > 3.50% from 2019-2033 |
| Segmentation |
|
Table of Contents
- 1. Introduction
- 1.1. Research Scope
- 1.2. Market Segmentation
- 1.3. Research Methodology
- 1.4. Definitions and Assumptions
- 2. Executive Summary
- 2.1. Introduction
- 3. Market Dynamics
- 3.1. Introduction
- 3.2. Market Drivers
- 3.2.1. Cost Efficiency and Environmental Sustainability; Infrastructure Development; Rising Consumer Demand
- 3.3. Market Restrains
- 3.3.1. High Fragmentation of the Logistics Industry; Data Security Concerns
- 3.4. Market Trends
- 3.4.1. Free Trade Agreements (FTAs) Facilitating the Growth of the Market
- 4. Market Factor Analysis
- 4.1. Porters Five Forces
- 4.2. Supply/Value Chain
- 4.3. PESTEL analysis
- 4.4. Market Entropy
- 4.5. Patent/Trademark Analysis
- 5. Global US Cross Border Transport Services Market Analysis, Insights and Forecast, 2019-2031
- 5.1. Market Analysis, Insights and Forecast - by Service
- 5.1.1. Full Truck Load (FTL)
- 5.1.2. Less-than Truckload (LTL)
- 5.1.3. Courier, Express, and Parcel (CEP)
- 5.2. Market Analysis, Insights and Forecast - by End-user
- 5.2.1. Manufacturing and Automotive
- 5.2.2. Oil and Gas, Mining, and Quarrying
- 5.2.3. Agriculture, Fishing, and Forestry
- 5.2.4. Construction
- 5.2.5. Distribu
- 5.2.6. Other En
- 5.3. Market Analysis, Insights and Forecast - by Region
- 5.3.1. North America
- 5.3.2. South America
- 5.3.3. Europe
- 5.3.4. Middle East & Africa
- 5.3.5. Asia Pacific
- 5.1. Market Analysis, Insights and Forecast - by Service
- 6. North America US Cross Border Transport Services Market Analysis, Insights and Forecast, 2019-2031
- 6.1. Market Analysis, Insights and Forecast - by Service
- 6.1.1. Full Truck Load (FTL)
- 6.1.2. Less-than Truckload (LTL)
- 6.1.3. Courier, Express, and Parcel (CEP)
- 6.2. Market Analysis, Insights and Forecast - by End-user
- 6.2.1. Manufacturing and Automotive
- 6.2.2. Oil and Gas, Mining, and Quarrying
- 6.2.3. Agriculture, Fishing, and Forestry
- 6.2.4. Construction
- 6.2.5. Distribu
- 6.2.6. Other En
- 6.1. Market Analysis, Insights and Forecast - by Service
- 7. South America US Cross Border Transport Services Market Analysis, Insights and Forecast, 2019-2031
- 7.1. Market Analysis, Insights and Forecast - by Service
- 7.1.1. Full Truck Load (FTL)
- 7.1.2. Less-than Truckload (LTL)
- 7.1.3. Courier, Express, and Parcel (CEP)
- 7.2. Market Analysis, Insights and Forecast - by End-user
- 7.2.1. Manufacturing and Automotive
- 7.2.2. Oil and Gas, Mining, and Quarrying
- 7.2.3. Agriculture, Fishing, and Forestry
- 7.2.4. Construction
- 7.2.5. Distribu
- 7.2.6. Other En
- 7.1. Market Analysis, Insights and Forecast - by Service
- 8. Europe US Cross Border Transport Services Market Analysis, Insights and Forecast, 2019-2031
- 8.1. Market Analysis, Insights and Forecast - by Service
- 8.1.1. Full Truck Load (FTL)
- 8.1.2. Less-than Truckload (LTL)
- 8.1.3. Courier, Express, and Parcel (CEP)
- 8.2. Market Analysis, Insights and Forecast - by End-user
- 8.2.1. Manufacturing and Automotive
- 8.2.2. Oil and Gas, Mining, and Quarrying
- 8.2.3. Agriculture, Fishing, and Forestry
- 8.2.4. Construction
- 8.2.5. Distribu
- 8.2.6. Other En
- 8.1. Market Analysis, Insights and Forecast - by Service
- 9. Middle East & Africa US Cross Border Transport Services Market Analysis, Insights and Forecast, 2019-2031
- 9.1. Market Analysis, Insights and Forecast - by Service
- 9.1.1. Full Truck Load (FTL)
- 9.1.2. Less-than Truckload (LTL)
- 9.1.3. Courier, Express, and Parcel (CEP)
- 9.2. Market Analysis, Insights and Forecast - by End-user
- 9.2.1. Manufacturing and Automotive
- 9.2.2. Oil and Gas, Mining, and Quarrying
- 9.2.3. Agriculture, Fishing, and Forestry
- 9.2.4. Construction
- 9.2.5. Distribu
- 9.2.6. Other En
- 9.1. Market Analysis, Insights and Forecast - by Service
- 10. Asia Pacific US Cross Border Transport Services Market Analysis, Insights and Forecast, 2019-2031
- 10.1. Market Analysis, Insights and Forecast - by Service
- 10.1.1. Full Truck Load (FTL)
- 10.1.2. Less-than Truckload (LTL)
- 10.1.3. Courier, Express, and Parcel (CEP)
- 10.2. Market Analysis, Insights and Forecast - by End-user
- 10.2.1. Manufacturing and Automotive
- 10.2.2. Oil and Gas, Mining, and Quarrying
- 10.2.3. Agriculture, Fishing, and Forestry
- 10.2.4. Construction
- 10.2.5. Distribu
- 10.2.6. Other En
- 10.1. Market Analysis, Insights and Forecast - by Service
- 11. Northeast US Cross Border Transport Services Market Analysis, Insights and Forecast, 2019-2031
- 12. Southeast US Cross Border Transport Services Market Analysis, Insights and Forecast, 2019-2031
- 13. Midwest US Cross Border Transport Services Market Analysis, Insights and Forecast, 2019-2031
- 14. Southwest US Cross Border Transport Services Market Analysis, Insights and Forecast, 2019-2031
- 15. West US Cross Border Transport Services Market Analysis, Insights and Forecast, 2019-2031
- 16. Competitive Analysis
- 16.1. Global Market Share Analysis 2024
- 16.2. Company Profiles
- 16.2.1 J B Hunt Transport Services Inc
- 16.2.1.1. Overview
- 16.2.1.2. Products
- 16.2.1.3. SWOT Analysis
- 16.2.1.4. Recent Developments
- 16.2.1.5. Financials (Based on Availability)
- 16.2.2 DB Schenker
- 16.2.2.1. Overview
- 16.2.2.2. Products
- 16.2.2.3. SWOT Analysis
- 16.2.2.4. Recent Developments
- 16.2.2.5. Financials (Based on Availability)
- 16.2.3 Moto Transportation
- 16.2.3.1. Overview
- 16.2.3.2. Products
- 16.2.3.3. SWOT Analysis
- 16.2.3.4. Recent Developments
- 16.2.3.5. Financials (Based on Availability)
- 16.2.4 US Xpress
- 16.2.4.1. Overview
- 16.2.4.2. Products
- 16.2.4.3. SWOT Analysis
- 16.2.4.4. Recent Developments
- 16.2.4.5. Financials (Based on Availability)
- 16.2.5 Landstar System Inc
- 16.2.5.1. Overview
- 16.2.5.2. Products
- 16.2.5.3. SWOT Analysis
- 16.2.5.4. Recent Developments
- 16.2.5.5. Financials (Based on Availability)
- 16.2.6 C H Robinson
- 16.2.6.1. Overview
- 16.2.6.2. Products
- 16.2.6.3. SWOT Analysis
- 16.2.6.4. Recent Developments
- 16.2.6.5. Financials (Based on Availability)
- 16.2.7 United Parcel Service (UPS)
- 16.2.7.1. Overview
- 16.2.7.2. Products
- 16.2.7.3. SWOT Analysis
- 16.2.7.4. Recent Developments
- 16.2.7.5. Financials (Based on Availability)
- 16.2.8 YRC Worldwide Inc
- 16.2.8.1. Overview
- 16.2.8.2. Products
- 16.2.8.3. SWOT Analysis
- 16.2.8.4. Recent Developments
- 16.2.8.5. Financials (Based on Availability)
- 16.2.9 Schneider National
- 16.2.9.1. Overview
- 16.2.9.2. Products
- 16.2.9.3. SWOT Analysis
- 16.2.9.4. Recent Developments
- 16.2.9.5. Financials (Based on Availability)
- 16.2.10 FedEx
- 16.2.10.1. Overview
- 16.2.10.2. Products
- 16.2.10.3. SWOT Analysis
- 16.2.10.4. Recent Developments
- 16.2.10.5. Financials (Based on Availability)
- 16.2.11 Polaris Transportation Group
- 16.2.11.1. Overview
- 16.2.11.2. Products
- 16.2.11.3. SWOT Analysis
- 16.2.11.4. Recent Developments
- 16.2.11.5. Financials (Based on Availability)
- 16.2.12 Hitachi Transport System**List Not Exhaustive
- 16.2.12.1. Overview
- 16.2.12.2. Products
- 16.2.12.3. SWOT Analysis
- 16.2.12.4. Recent Developments
- 16.2.12.5. Financials (Based on Availability)
- 16.2.13 Swift Transportation Company
- 16.2.13.1. Overview
- 16.2.13.2. Products
- 16.2.13.3. SWOT Analysis
- 16.2.13.4. Recent Developments
- 16.2.13.5. Financials (Based on Availability)
- 16.2.14 XPO Logistics Inc
- 16.2.14.1. Overview
- 16.2.14.2. Products
- 16.2.14.3. SWOT Analysis
- 16.2.14.4. Recent Developments
- 16.2.14.5. Financials (Based on Availability)
- 16.2.1 J B Hunt Transport Services Inc
List of Figures
- Figure 1: Global US Cross Border Transport Services Market Revenue Breakdown (Million, %) by Region 2024 & 2032
- Figure 2: United states US Cross Border Transport Services Market Revenue (Million), by Country 2024 & 2032
- Figure 3: United states US Cross Border Transport Services Market Revenue Share (%), by Country 2024 & 2032
- Figure 4: North America US Cross Border Transport Services Market Revenue (Million), by Service 2024 & 2032
- Figure 5: North America US Cross Border Transport Services Market Revenue Share (%), by Service 2024 & 2032
- Figure 6: North America US Cross Border Transport Services Market Revenue (Million), by End-user 2024 & 2032
- Figure 7: North America US Cross Border Transport Services Market Revenue Share (%), by End-user 2024 & 2032
- Figure 8: North America US Cross Border Transport Services Market Revenue (Million), by Country 2024 & 2032
- Figure 9: North America US Cross Border Transport Services Market Revenue Share (%), by Country 2024 & 2032
- Figure 10: South America US Cross Border Transport Services Market Revenue (Million), by Service 2024 & 2032
- Figure 11: South America US Cross Border Transport Services Market Revenue Share (%), by Service 2024 & 2032
- Figure 12: South America US Cross Border Transport Services Market Revenue (Million), by End-user 2024 & 2032
- Figure 13: South America US Cross Border Transport Services Market Revenue Share (%), by End-user 2024 & 2032
- Figure 14: South America US Cross Border Transport Services Market Revenue (Million), by Country 2024 & 2032
- Figure 15: South America US Cross Border Transport Services Market Revenue Share (%), by Country 2024 & 2032
- Figure 16: Europe US Cross Border Transport Services Market Revenue (Million), by Service 2024 & 2032
- Figure 17: Europe US Cross Border Transport Services Market Revenue Share (%), by Service 2024 & 2032
- Figure 18: Europe US Cross Border Transport Services Market Revenue (Million), by End-user 2024 & 2032
- Figure 19: Europe US Cross Border Transport Services Market Revenue Share (%), by End-user 2024 & 2032
- Figure 20: Europe US Cross Border Transport Services Market Revenue (Million), by Country 2024 & 2032
- Figure 21: Europe US Cross Border Transport Services Market Revenue Share (%), by Country 2024 & 2032
- Figure 22: Middle East & Africa US Cross Border Transport Services Market Revenue (Million), by Service 2024 & 2032
- Figure 23: Middle East & Africa US Cross Border Transport Services Market Revenue Share (%), by Service 2024 & 2032
- Figure 24: Middle East & Africa US Cross Border Transport Services Market Revenue (Million), by End-user 2024 & 2032
- Figure 25: Middle East & Africa US Cross Border Transport Services Market Revenue Share (%), by End-user 2024 & 2032
- Figure 26: Middle East & Africa US Cross Border Transport Services Market Revenue (Million), by Country 2024 & 2032
- Figure 27: Middle East & Africa US Cross Border Transport Services Market Revenue Share (%), by Country 2024 & 2032
- Figure 28: Asia Pacific US Cross Border Transport Services Market Revenue (Million), by Service 2024 & 2032
- Figure 29: Asia Pacific US Cross Border Transport Services Market Revenue Share (%), by Service 2024 & 2032
- Figure 30: Asia Pacific US Cross Border Transport Services Market Revenue (Million), by End-user 2024 & 2032
- Figure 31: Asia Pacific US Cross Border Transport Services Market Revenue Share (%), by End-user 2024 & 2032
- Figure 32: Asia Pacific US Cross Border Transport Services Market Revenue (Million), by Country 2024 & 2032
- Figure 33: Asia Pacific US Cross Border Transport Services Market Revenue Share (%), by Country 2024 & 2032
List of Tables
- Table 1: Global US Cross Border Transport Services Market Revenue Million Forecast, by Region 2019 & 2032
- Table 2: Global US Cross Border Transport Services Market Revenue Million Forecast, by Service 2019 & 2032
- Table 3: Global US Cross Border Transport Services Market Revenue Million Forecast, by End-user 2019 & 2032
- Table 4: Global US Cross Border Transport Services Market Revenue Million Forecast, by Region 2019 & 2032
- Table 5: Global US Cross Border Transport Services Market Revenue Million Forecast, by Country 2019 & 2032
- Table 6: Northeast US Cross Border Transport Services Market Revenue (Million) Forecast, by Application 2019 & 2032
- Table 7: Southeast US Cross Border Transport Services Market Revenue (Million) Forecast, by Application 2019 & 2032
- Table 8: Midwest US Cross Border Transport Services Market Revenue (Million) Forecast, by Application 2019 & 2032
- Table 9: Southwest US Cross Border Transport Services Market Revenue (Million) Forecast, by Application 2019 & 2032
- Table 10: West US Cross Border Transport Services Market Revenue (Million) Forecast, by Application 2019 & 2032
- Table 11: Global US Cross Border Transport Services Market Revenue Million Forecast, by Service 2019 & 2032
- Table 12: Global US Cross Border Transport Services Market Revenue Million Forecast, by End-user 2019 & 2032
- Table 13: Global US Cross Border Transport Services Market Revenue Million Forecast, by Country 2019 & 2032
- Table 14: United States US Cross Border Transport Services Market Revenue (Million) Forecast, by Application 2019 & 2032
- Table 15: Canada US Cross Border Transport Services Market Revenue (Million) Forecast, by Application 2019 & 2032
- Table 16: Mexico US Cross Border Transport Services Market Revenue (Million) Forecast, by Application 2019 & 2032
- Table 17: Global US Cross Border Transport Services Market Revenue Million Forecast, by Service 2019 & 2032
- Table 18: Global US Cross Border Transport Services Market Revenue Million Forecast, by End-user 2019 & 2032
- Table 19: Global US Cross Border Transport Services Market Revenue Million Forecast, by Country 2019 & 2032
- Table 20: Brazil US Cross Border Transport Services Market Revenue (Million) Forecast, by Application 2019 & 2032
- Table 21: Argentina US Cross Border Transport Services Market Revenue (Million) Forecast, by Application 2019 & 2032
- Table 22: Rest of South America US Cross Border Transport Services Market Revenue (Million) Forecast, by Application 2019 & 2032
- Table 23: Global US Cross Border Transport Services Market Revenue Million Forecast, by Service 2019 & 2032
- Table 24: Global US Cross Border Transport Services Market Revenue Million Forecast, by End-user 2019 & 2032
- Table 25: Global US Cross Border Transport Services Market Revenue Million Forecast, by Country 2019 & 2032
- Table 26: United Kingdom US Cross Border Transport Services Market Revenue (Million) Forecast, by Application 2019 & 2032
- Table 27: Germany US Cross Border Transport Services Market Revenue (Million) Forecast, by Application 2019 & 2032
- Table 28: France US Cross Border Transport Services Market Revenue (Million) Forecast, by Application 2019 & 2032
- Table 29: Italy US Cross Border Transport Services Market Revenue (Million) Forecast, by Application 2019 & 2032
- Table 30: Spain US Cross Border Transport Services Market Revenue (Million) Forecast, by Application 2019 & 2032
- Table 31: Russia US Cross Border Transport Services Market Revenue (Million) Forecast, by Application 2019 & 2032
- Table 32: Benelux US Cross Border Transport Services Market Revenue (Million) Forecast, by Application 2019 & 2032
- Table 33: Nordics US Cross Border Transport Services Market Revenue (Million) Forecast, by Application 2019 & 2032
- Table 34: Rest of Europe US Cross Border Transport Services Market Revenue (Million) Forecast, by Application 2019 & 2032
- Table 35: Global US Cross Border Transport Services Market Revenue Million Forecast, by Service 2019 & 2032
- Table 36: Global US Cross Border Transport Services Market Revenue Million Forecast, by End-user 2019 & 2032
- Table 37: Global US Cross Border Transport Services Market Revenue Million Forecast, by Country 2019 & 2032
- Table 38: Turkey US Cross Border Transport Services Market Revenue (Million) Forecast, by Application 2019 & 2032
- Table 39: Israel US Cross Border Transport Services Market Revenue (Million) Forecast, by Application 2019 & 2032
- Table 40: GCC US Cross Border Transport Services Market Revenue (Million) Forecast, by Application 2019 & 2032
- Table 41: North Africa US Cross Border Transport Services Market Revenue (Million) Forecast, by Application 2019 & 2032
- Table 42: South Africa US Cross Border Transport Services Market Revenue (Million) Forecast, by Application 2019 & 2032
- Table 43: Rest of Middle East & Africa US Cross Border Transport Services Market Revenue (Million) Forecast, by Application 2019 & 2032
- Table 44: Global US Cross Border Transport Services Market Revenue Million Forecast, by Service 2019 & 2032
- Table 45: Global US Cross Border Transport Services Market Revenue Million Forecast, by End-user 2019 & 2032
- Table 46: Global US Cross Border Transport Services Market Revenue Million Forecast, by Country 2019 & 2032
- Table 47: China US Cross Border Transport Services Market Revenue (Million) Forecast, by Application 2019 & 2032
- Table 48: India US Cross Border Transport Services Market Revenue (Million) Forecast, by Application 2019 & 2032
- Table 49: Japan US Cross Border Transport Services Market Revenue (Million) Forecast, by Application 2019 & 2032
- Table 50: South Korea US Cross Border Transport Services Market Revenue (Million) Forecast, by Application 2019 & 2032
- Table 51: ASEAN US Cross Border Transport Services Market Revenue (Million) Forecast, by Application 2019 & 2032
- Table 52: Oceania US Cross Border Transport Services Market Revenue (Million) Forecast, by Application 2019 & 2032
- Table 53: Rest of Asia Pacific US Cross Border Transport Services Market Revenue (Million) Forecast, by Application 2019 & 2032
Frequently Asked Questions
1. What is the projected Compound Annual Growth Rate (CAGR) of the US Cross Border Transport Services Market?
The projected CAGR is approximately > 3.50%.
2. Which companies are prominent players in the US Cross Border Transport Services Market?
Key companies in the market include J B Hunt Transport Services Inc, DB Schenker, Moto Transportation, US Xpress, Landstar System Inc, C H Robinson, United Parcel Service (UPS), YRC Worldwide Inc, Schneider National, FedEx, Polaris Transportation Group, Hitachi Transport System**List Not Exhaustive, Swift Transportation Company, XPO Logistics Inc.
3. What are the main segments of the US Cross Border Transport Services Market?
The market segments include Service, End-user.
4. Can you provide details about the market size?
The market size is estimated to be USD XX Million as of 2022.
5. What are some drivers contributing to market growth?
Cost Efficiency and Environmental Sustainability; Infrastructure Development; Rising Consumer Demand.
6. What are the notable trends driving market growth?
Free Trade Agreements (FTAs) Facilitating the Growth of the Market.
7. Are there any restraints impacting market growth?
High Fragmentation of the Logistics Industry; Data Security Concerns.
8. Can you provide examples of recent developments in the market?
October 2022: KAG Logistics completed the acquisition of Toronto-based cross-border freight transportation company Connectrans Logistics. Connectrans has an established carrier network between the U.S. and Canada with expertise in transportation solutions within dry van, temperature control, flatbed, over-dimensional, and intermodal. The acquisition of Connectrans expands KAG Logistics's footprint in the Canadian logistics market. The acquisition will also give Connectrans customers more access to the U.S. marketplace, specialized assets, technologies, and additional logistics expertise.
9. What pricing options are available for accessing the report?
Pricing options include single-user, multi-user, and enterprise licenses priced at USD 3800, USD 4500, and USD 5800 respectively.
10. Is the market size provided in terms of value or volume?
The market size is provided in terms of value, measured in Million.
11. Are there any specific market keywords associated with the report?
Yes, the market keyword associated with the report is "US Cross Border Transport Services Market," which aids in identifying and referencing the specific market segment covered.
12. How do I determine which pricing option suits my needs best?
The pricing options vary based on user requirements and access needs. Individual users may opt for single-user licenses, while businesses requiring broader access may choose multi-user or enterprise licenses for cost-effective access to the report.
13. Are there any additional resources or data provided in the US Cross Border Transport Services Market report?
While the report offers comprehensive insights, it's advisable to review the specific contents or supplementary materials provided to ascertain if additional resources or data are available.
14. How can I stay updated on further developments or reports in the US Cross Border Transport Services Market?
To stay informed about further developments, trends, and reports in the US Cross Border Transport Services Market, consider subscribing to industry newsletters, following relevant companies and organizations, or regularly checking reputable industry news sources and publications.
Methodology
Step 1 - Identification of Relevant Samples Size from Population Database


Step 2 - Approaches for Defining Global Market Size (Value, Volume* & Price*)

Note*: In applicable scenarios
Step 3 - Data Sources
Primary Research
- Web Analytics
- Survey Reports
- Research Institute
- Latest Research Reports
- Opinion Leaders
Secondary Research
- Annual Reports
- White Paper
- Latest Press Release
- Industry Association
- Paid Database
- Investor Presentations

Step 4 - Data Triangulation
Involves using different sources of information in order to increase the validity of a study
These sources are likely to be stakeholders in a program - participants, other researchers, program staff, other community members, and so on.
Then we put all data in single framework & apply various statistical tools to find out the dynamic on the market.
During the analysis stage, feedback from the stakeholder groups would be compared to determine areas of agreement as well as areas of divergence
