

Key Insights
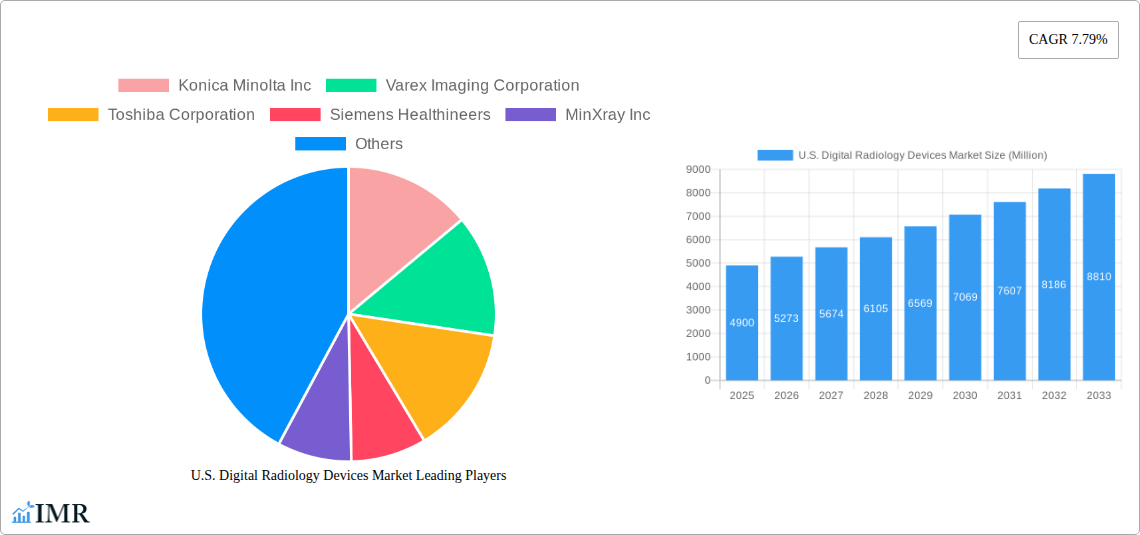
The U.S. digital radiology devices market, valued at $4.90 billion in 2025, is projected to experience robust growth, driven by several key factors. The increasing prevalence of chronic diseases like cancer and cardiovascular conditions necessitates advanced diagnostic imaging, fueling demand for digital radiology systems offering superior image quality and efficiency. Technological advancements, such as the integration of AI and cloud-based solutions, are enhancing image analysis and workflow optimization, further stimulating market expansion. Hospitals and diagnostic centers constitute the largest end-user segment, reflecting the critical role of digital radiology in modern healthcare settings. The adoption of portable systems is also rising, driven by the need for point-of-care diagnostics and improved patient access to imaging services. Furthermore, the shift towards value-based care models incentivizes the use of efficient and cost-effective diagnostic tools, further contributing to market growth. While regulatory hurdles and high initial investment costs could pose some challenges, the long-term benefits in terms of improved patient care and operational efficiencies are expected to outweigh these constraints.
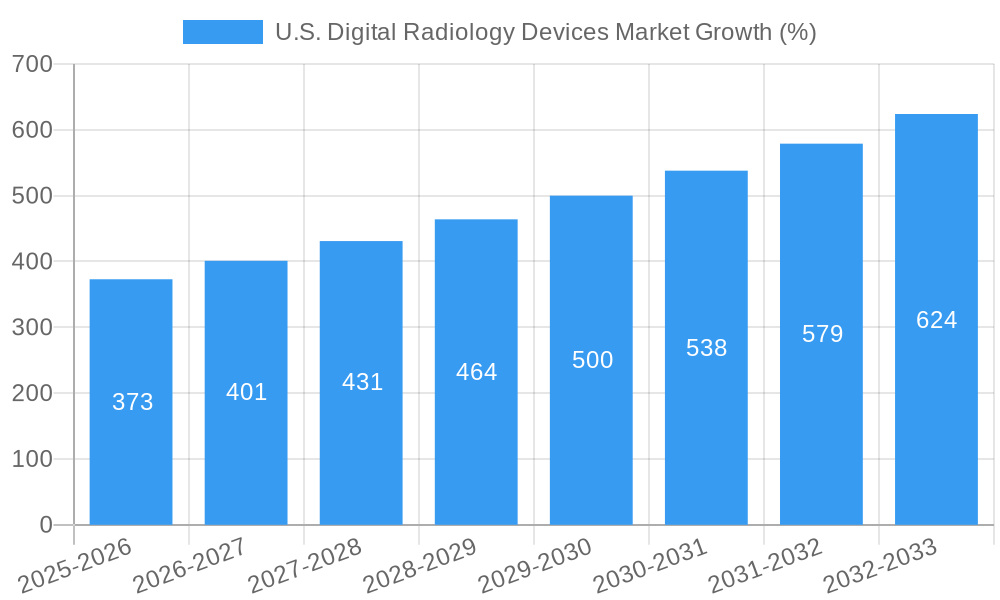
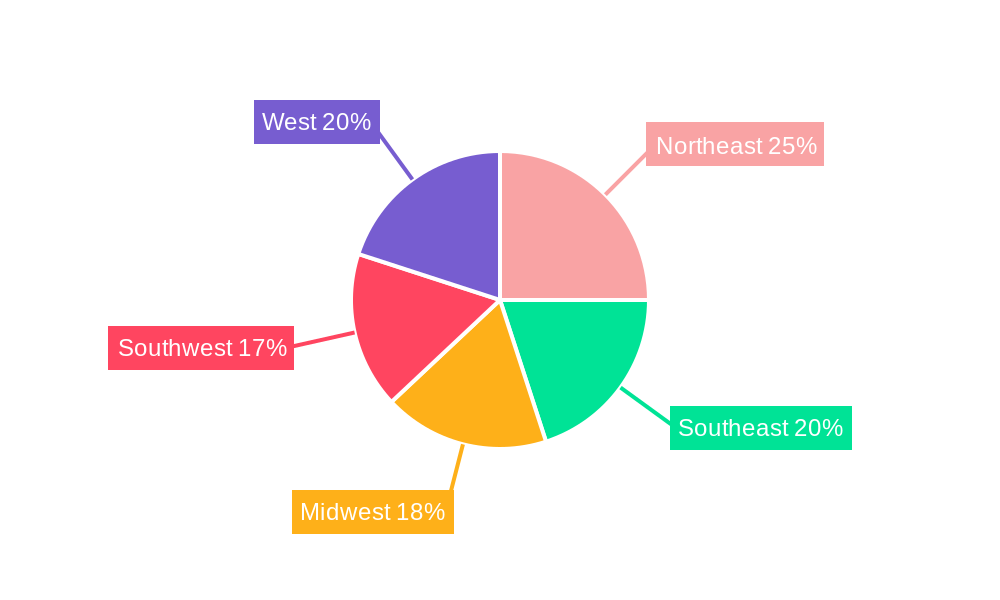
Growth within specific application areas like orthopedic imaging, driven by an aging population and increased incidence of musculoskeletal disorders, is particularly noteworthy. Similarly, the rising prevalence of cancer is boosting demand for advanced digital radiology systems in oncology. Competitive dynamics are shaped by established players like GE Healthcare, Siemens Healthineers, and Philips Healthcare, alongside innovative companies offering specialized solutions. Regional variations in market growth are anticipated, with states like California, New York, and Texas likely to display higher adoption rates due to factors such as higher concentration of healthcare facilities and advanced medical infrastructure. The 7.79% CAGR projected for the period 2025-2033 indicates substantial market expansion, potentially exceeding $8 billion by 2033. Continued investment in research and development focused on improved image resolution, radiation dose reduction, and AI integration will shape the future of this dynamic market.
U.S. Digital Radiology Devices Market: 2019-2033 Forecast Report
This comprehensive report provides a detailed analysis of the U.S. digital radiology devices market, encompassing market size, growth trends, competitive landscape, and future outlook. The study period covers 2019-2033, with 2025 as the base year and forecast period spanning 2025-2033. The report caters to industry professionals, investors, and strategic decision-makers seeking a deep understanding of this dynamic sector. It segments the market by end-user (Hospitals, Diagnostic Centers, Other End Users), application (Orthopedic, Cancer, Dental, Cardiovascular, Other Applications), technology (Computed Radiography, Direct Radiography), and portability (Fixed Systems, Portable Systems). Leading players like General Electric Company (GE Healthcare), Siemens Healthineers, and Fujifilm Holdings Corporation are profiled, offering crucial insights into their market strategies and contributions. The report’s data is presented in million units.
U.S. Digital Radiology Devices Market Dynamics & Structure
The U.S. digital radiology devices market is characterized by a moderately concentrated structure with key players holding significant market share. The market is driven by technological advancements, particularly in image quality, workflow efficiency, and portability. Stringent regulatory frameworks from the FDA influence device approvals and market entry. Competitive pressures arise from substitutes like ultrasound and MRI, while M&A activity consolidates market power. The aging population and increasing prevalence of chronic diseases fuel demand.
- Market Concentration: The top 5 players hold approximately xx% of the market share in 2025.
- Technological Innovation: Focus on AI-powered image analysis, miniaturization, and wireless connectivity is driving growth.
- Regulatory Landscape: FDA approvals and compliance significantly impact market entry and product lifecycle.
- Competitive Substitutes: Ultrasound and MRI imaging pose competitive challenges, particularly in specific applications.
- End-User Demographics: The aging U.S. population fuels demand for diagnostic imaging services.
- M&A Activity: xx M&A deals were recorded between 2019 and 2024, indicating consolidation trends.
U.S. Digital Radiology Devices Market Growth Trends & Insights
The U.S. digital radiology devices market exhibited robust growth during the historical period (2019-2024), with a CAGR of xx%. This growth is attributed to factors like increasing healthcare expenditure, technological advancements, rising prevalence of chronic diseases, and growing adoption of digital imaging in various healthcare settings. The market is expected to maintain a steady growth trajectory during the forecast period (2025-2033), driven by the increasing demand for advanced imaging techniques and improved diagnostic capabilities. Market penetration of digital radiology devices in smaller healthcare facilities is also expected to contribute to market expansion. The shift towards value-based care is influencing the adoption of cost-effective and efficient solutions. Technological disruptions like AI-powered image analysis are transforming diagnostic workflows and improving accuracy. Consumer behavior is shifting towards greater patient convenience and faster results.
Dominant Regions, Countries, or Segments in U.S. Digital Radiology Devices Market
The hospitals segment within the end-user category dominates the U.S. digital radiology devices market, accounting for approximately xx% of the total market revenue in 2025. This dominance is driven by the high volume of diagnostic procedures performed in hospitals and the availability of advanced imaging technologies. The orthopedic application segment is another major growth driver, fueled by the increasing prevalence of musculoskeletal disorders and the demand for precise imaging techniques. Geographically, densely populated states with high healthcare spending show higher adoption rates.
- End-User: Hospitals' dominance stems from high patient volume and advanced infrastructure.
- Application: Orthopedic imaging is a leading application due to rising musculoskeletal disease prevalence.
- Technology: Direct Radiography is gaining traction due to improved image quality and workflow efficiency.
- Portability: Fixed systems dominate due to established infrastructure, but portable systems are growing in ambulatory care settings.
- Geographic Factors: States with high healthcare expenditure and population density witness higher adoption.
U.S. Digital Radiology Devices Market Product Landscape
Recent innovations focus on improving image quality, reducing radiation exposure, and enhancing workflow efficiency. Manufacturers are integrating AI capabilities for automated image analysis and diagnostic support. Products are designed with user-centric interfaces for ease of use and improved patient comfort. Unique selling propositions often include enhanced image clarity, faster scan times, and reduced operational costs. Advancements like wireless connectivity and cloud-based image management are shaping the future of digital radiology devices.
Key Drivers, Barriers & Challenges in U.S. Digital Radiology Devices Market
Key Drivers: Technological advancements like AI integration, increasing prevalence of chronic diseases, rising healthcare expenditure, and government initiatives promoting digital healthcare are major drivers.
Challenges & Restraints: High initial investment costs, complex regulatory compliance, skilled personnel requirements, and the potential for cybersecurity vulnerabilities present significant challenges. Supply chain disruptions have also impacted the availability and pricing of devices. The market experiences competitive pressure from alternative imaging modalities. The impact of these challenges is estimated to restrain market growth by approximately xx% in 2025.
Emerging Opportunities in U.S. Digital Radiology Devices Market
Untapped markets include smaller healthcare facilities, such as rural clinics and ambulatory surgery centers, which are increasingly adopting digital radiology solutions. Emerging applications include advanced imaging techniques like tomosynthesis and cone-beam CT for enhanced diagnostic capabilities. The integration of AI and machine learning for image analysis is generating significant opportunities for improved accuracy and efficiency. Patient-centric features that enhance comfort and reduce anxiety are driving demand.
Growth Accelerators in the U.S. Digital Radiology Devices Market Industry
Technological breakthroughs like the development of more compact, portable, and user-friendly devices are significant catalysts for growth. Strategic partnerships and collaborations between device manufacturers, healthcare providers, and technology companies are accelerating innovation and market penetration. Expansion strategies into underserved markets and focus on creating efficient and cost-effective solutions are driving long-term growth.
Key Players Shaping the U.S. Digital Radiology Devices Market Market
- Konica Minolta Inc
- Varex Imaging Corporation
- Toshiba Corporation
- Siemens Healthineers
- MinXray Inc
- Hologic Inc
- Hitachi Ltd
- Koninklijke Philips NV (Philips Healthcare)
- KUB Technologies Inc
- Carestream Health
- General Electric Company (GE Healthcare)
- Canon Medical Systems Corporation
- Agfa-Gevaert NV
- Shimadzu Corporation
- Fujifilm Holdings Corporation
- Samsung Electronics Co Ltd (Samsung Medison)
Notable Milestones in U.S. Digital Radiology Devices Market Sector
- April 2022: Samsung introduces the GM85 Fit digital radiography device, focusing on user-centric design for efficient patient care.
- July 2022: Fujifilm launches the FDR Cross, a hybrid c-arm and portable x-ray solution for hospitals and ASCs.
In-Depth U.S. Digital Radiology Devices Market Market Outlook
The U.S. digital radiology devices market is poised for continued growth, driven by technological advancements, increasing healthcare spending, and the rising prevalence of chronic diseases. Strategic investments in AI-powered solutions, coupled with expanding adoption in ambulatory care settings, represent significant opportunities for market expansion. The focus on improving patient experience and workflow efficiency will shape future product development and market dynamics. The market is expected to reach xx million units by 2033, presenting lucrative opportunities for both established players and emerging innovators.
U.S. Digital Radiology Devices Market Segmentation
-
1. Application
- 1.1. Orthopedic
- 1.2. Cancer
- 1.3. Dental
- 1.4. Cardiovascular
- 1.5. Other Applications
-
2. Technology
- 2.1. Computed Radiography
- 2.2. Direct Radiography
-
3. Portability
- 3.1. Fixed Systems
- 3.2. Portable Systems
-
4. End User
- 4.1. Hospitals
- 4.2. Diagnostic Centers
- 4.3. Other End Users
U.S. Digital Radiology Devices Market Segmentation By Geography
- 1. U.S.
U.S. Digital Radiology Devices Market REPORT HIGHLIGHTS
| Aspects | Details |
|---|---|
| Study Period | 2019-2033 |
| Base Year | 2024 |
| Estimated Year | 2025 |
| Forecast Period | 2025-2033 |
| Historical Period | 2019-2024 |
| Growth Rate | CAGR of 7.79% from 2019-2033 |
| Segmentation |
|
Table of Contents
- 1. Introduction
- 1.1. Research Scope
- 1.2. Market Segmentation
- 1.3. Research Methodology
- 1.4. Definitions and Assumptions
- 2. Executive Summary
- 2.1. Introduction
- 3. Market Dynamics
- 3.1. Introduction
- 3.2. Market Drivers
- 3.2.1. Increasing Occurrence Levels of Orthopedic Diseases and Cancers; Increasing Number of Serious Injuries; Technological Advancements and Advantages of Digital X-ray Systems Over Conventional X-rays
- 3.3. Market Restrains
- 3.3.1. High Initial Cost of Installation; New Sales Affected by the Increasing Use of Refurbished Devices
- 3.4. Market Trends
- 3.4.1. The Direct Radiography Segment is Expected to Witness a High CAGR Over the Forecast Period
- 4. Market Factor Analysis
- 4.1. Porters Five Forces
- 4.2. Supply/Value Chain
- 4.3. PESTEL analysis
- 4.4. Market Entropy
- 4.5. Patent/Trademark Analysis
- 5. U.S. Digital Radiology Devices Market Analysis, Insights and Forecast, 2019-2031
- 5.1. Market Analysis, Insights and Forecast - by Application
- 5.1.1. Orthopedic
- 5.1.2. Cancer
- 5.1.3. Dental
- 5.1.4. Cardiovascular
- 5.1.5. Other Applications
- 5.2. Market Analysis, Insights and Forecast - by Technology
- 5.2.1. Computed Radiography
- 5.2.2. Direct Radiography
- 5.3. Market Analysis, Insights and Forecast - by Portability
- 5.3.1. Fixed Systems
- 5.3.2. Portable Systems
- 5.4. Market Analysis, Insights and Forecast - by End User
- 5.4.1. Hospitals
- 5.4.2. Diagnostic Centers
- 5.4.3. Other End Users
- 5.5. Market Analysis, Insights and Forecast - by Region
- 5.5.1. U.S.
- 5.1. Market Analysis, Insights and Forecast - by Application
- 6. Northeast U.S. Digital Radiology Devices Market Analysis, Insights and Forecast, 2019-2031
- 7. Southeast U.S. Digital Radiology Devices Market Analysis, Insights and Forecast, 2019-2031
- 8. Midwest U.S. Digital Radiology Devices Market Analysis, Insights and Forecast, 2019-2031
- 9. Southwest U.S. Digital Radiology Devices Market Analysis, Insights and Forecast, 2019-2031
- 10. West U.S. Digital Radiology Devices Market Analysis, Insights and Forecast, 2019-2031
- 11. Competitive Analysis
- 11.1. Market Share Analysis 2024
- 11.2. Company Profiles
- 11.2.1 Konica Minolta Inc
- 11.2.1.1. Overview
- 11.2.1.2. Products
- 11.2.1.3. SWOT Analysis
- 11.2.1.4. Recent Developments
- 11.2.1.5. Financials (Based on Availability)
- 11.2.2 Varex Imaging Corporation
- 11.2.2.1. Overview
- 11.2.2.2. Products
- 11.2.2.3. SWOT Analysis
- 11.2.2.4. Recent Developments
- 11.2.2.5. Financials (Based on Availability)
- 11.2.3 Toshiba Corporation
- 11.2.3.1. Overview
- 11.2.3.2. Products
- 11.2.3.3. SWOT Analysis
- 11.2.3.4. Recent Developments
- 11.2.3.5. Financials (Based on Availability)
- 11.2.4 Siemens Healthineers
- 11.2.4.1. Overview
- 11.2.4.2. Products
- 11.2.4.3. SWOT Analysis
- 11.2.4.4. Recent Developments
- 11.2.4.5. Financials (Based on Availability)
- 11.2.5 MinXray Inc
- 11.2.5.1. Overview
- 11.2.5.2. Products
- 11.2.5.3. SWOT Analysis
- 11.2.5.4. Recent Developments
- 11.2.5.5. Financials (Based on Availability)
- 11.2.6 Hologic Inc
- 11.2.6.1. Overview
- 11.2.6.2. Products
- 11.2.6.3. SWOT Analysis
- 11.2.6.4. Recent Developments
- 11.2.6.5. Financials (Based on Availability)
- 11.2.7 Hitachi Ltd
- 11.2.7.1. Overview
- 11.2.7.2. Products
- 11.2.7.3. SWOT Analysis
- 11.2.7.4. Recent Developments
- 11.2.7.5. Financials (Based on Availability)
- 11.2.8 Koninklinje Philips NV (Philips Healthcare)
- 11.2.8.1. Overview
- 11.2.8.2. Products
- 11.2.8.3. SWOT Analysis
- 11.2.8.4. Recent Developments
- 11.2.8.5. Financials (Based on Availability)
- 11.2.9 KUB Technologies Inc
- 11.2.9.1. Overview
- 11.2.9.2. Products
- 11.2.9.3. SWOT Analysis
- 11.2.9.4. Recent Developments
- 11.2.9.5. Financials (Based on Availability)
- 11.2.10 Carestream Health
- 11.2.10.1. Overview
- 11.2.10.2. Products
- 11.2.10.3. SWOT Analysis
- 11.2.10.4. Recent Developments
- 11.2.10.5. Financials (Based on Availability)
- 11.2.11 General Electric Company (GE Healthcare)
- 11.2.11.1. Overview
- 11.2.11.2. Products
- 11.2.11.3. SWOT Analysis
- 11.2.11.4. Recent Developments
- 11.2.11.5. Financials (Based on Availability)
- 11.2.12 Canon Medical Systems Corporation
- 11.2.12.1. Overview
- 11.2.12.2. Products
- 11.2.12.3. SWOT Analysis
- 11.2.12.4. Recent Developments
- 11.2.12.5. Financials (Based on Availability)
- 11.2.13 Agfa-Gevaert NV
- 11.2.13.1. Overview
- 11.2.13.2. Products
- 11.2.13.3. SWOT Analysis
- 11.2.13.4. Recent Developments
- 11.2.13.5. Financials (Based on Availability)
- 11.2.14 Shimadzu Corporation
- 11.2.14.1. Overview
- 11.2.14.2. Products
- 11.2.14.3. SWOT Analysis
- 11.2.14.4. Recent Developments
- 11.2.14.5. Financials (Based on Availability)
- 11.2.15 Fujifilm Holdings Corporation
- 11.2.15.1. Overview
- 11.2.15.2. Products
- 11.2.15.3. SWOT Analysis
- 11.2.15.4. Recent Developments
- 11.2.15.5. Financials (Based on Availability)
- 11.2.16 Samsung Electronics Co Ltd (Samsung Medison)
- 11.2.16.1. Overview
- 11.2.16.2. Products
- 11.2.16.3. SWOT Analysis
- 11.2.16.4. Recent Developments
- 11.2.16.5. Financials (Based on Availability)
- 11.2.1 Konica Minolta Inc
List of Figures
- Figure 1: U.S. Digital Radiology Devices Market Revenue Breakdown (Million, %) by Product 2024 & 2032
- Figure 2: U.S. Digital Radiology Devices Market Share (%) by Company 2024
List of Tables
- Table 1: U.S. Digital Radiology Devices Market Revenue Million Forecast, by Region 2019 & 2032
- Table 2: U.S. Digital Radiology Devices Market Volume K Unit Forecast, by Region 2019 & 2032
- Table 3: U.S. Digital Radiology Devices Market Revenue Million Forecast, by Application 2019 & 2032
- Table 4: U.S. Digital Radiology Devices Market Volume K Unit Forecast, by Application 2019 & 2032
- Table 5: U.S. Digital Radiology Devices Market Revenue Million Forecast, by Technology 2019 & 2032
- Table 6: U.S. Digital Radiology Devices Market Volume K Unit Forecast, by Technology 2019 & 2032
- Table 7: U.S. Digital Radiology Devices Market Revenue Million Forecast, by Portability 2019 & 2032
- Table 8: U.S. Digital Radiology Devices Market Volume K Unit Forecast, by Portability 2019 & 2032
- Table 9: U.S. Digital Radiology Devices Market Revenue Million Forecast, by End User 2019 & 2032
- Table 10: U.S. Digital Radiology Devices Market Volume K Unit Forecast, by End User 2019 & 2032
- Table 11: U.S. Digital Radiology Devices Market Revenue Million Forecast, by Region 2019 & 2032
- Table 12: U.S. Digital Radiology Devices Market Volume K Unit Forecast, by Region 2019 & 2032
- Table 13: U.S. Digital Radiology Devices Market Revenue Million Forecast, by Country 2019 & 2032
- Table 14: U.S. Digital Radiology Devices Market Volume K Unit Forecast, by Country 2019 & 2032
- Table 15: Northeast U.S. Digital Radiology Devices Market Revenue (Million) Forecast, by Application 2019 & 2032
- Table 16: Northeast U.S. Digital Radiology Devices Market Volume (K Unit) Forecast, by Application 2019 & 2032
- Table 17: Southeast U.S. Digital Radiology Devices Market Revenue (Million) Forecast, by Application 2019 & 2032
- Table 18: Southeast U.S. Digital Radiology Devices Market Volume (K Unit) Forecast, by Application 2019 & 2032
- Table 19: Midwest U.S. Digital Radiology Devices Market Revenue (Million) Forecast, by Application 2019 & 2032
- Table 20: Midwest U.S. Digital Radiology Devices Market Volume (K Unit) Forecast, by Application 2019 & 2032
- Table 21: Southwest U.S. Digital Radiology Devices Market Revenue (Million) Forecast, by Application 2019 & 2032
- Table 22: Southwest U.S. Digital Radiology Devices Market Volume (K Unit) Forecast, by Application 2019 & 2032
- Table 23: West U.S. Digital Radiology Devices Market Revenue (Million) Forecast, by Application 2019 & 2032
- Table 24: West U.S. Digital Radiology Devices Market Volume (K Unit) Forecast, by Application 2019 & 2032
- Table 25: U.S. Digital Radiology Devices Market Revenue Million Forecast, by Application 2019 & 2032
- Table 26: U.S. Digital Radiology Devices Market Volume K Unit Forecast, by Application 2019 & 2032
- Table 27: U.S. Digital Radiology Devices Market Revenue Million Forecast, by Technology 2019 & 2032
- Table 28: U.S. Digital Radiology Devices Market Volume K Unit Forecast, by Technology 2019 & 2032
- Table 29: U.S. Digital Radiology Devices Market Revenue Million Forecast, by Portability 2019 & 2032
- Table 30: U.S. Digital Radiology Devices Market Volume K Unit Forecast, by Portability 2019 & 2032
- Table 31: U.S. Digital Radiology Devices Market Revenue Million Forecast, by End User 2019 & 2032
- Table 32: U.S. Digital Radiology Devices Market Volume K Unit Forecast, by End User 2019 & 2032
- Table 33: U.S. Digital Radiology Devices Market Revenue Million Forecast, by Country 2019 & 2032
- Table 34: U.S. Digital Radiology Devices Market Volume K Unit Forecast, by Country 2019 & 2032
Frequently Asked Questions
1. What is the projected Compound Annual Growth Rate (CAGR) of the U.S. Digital Radiology Devices Market?
The projected CAGR is approximately 7.79%.
2. Which companies are prominent players in the U.S. Digital Radiology Devices Market?
Key companies in the market include Konica Minolta Inc, Varex Imaging Corporation, Toshiba Corporation, Siemens Healthineers, MinXray Inc, Hologic Inc, Hitachi Ltd, Koninklinje Philips NV (Philips Healthcare), KUB Technologies Inc, Carestream Health, General Electric Company (GE Healthcare), Canon Medical Systems Corporation, Agfa-Gevaert NV, Shimadzu Corporation, Fujifilm Holdings Corporation, Samsung Electronics Co Ltd (Samsung Medison).
3. What are the main segments of the U.S. Digital Radiology Devices Market?
The market segments include Application, Technology, Portability, End User.
4. Can you provide details about the market size?
The market size is estimated to be USD 4.90 Million as of 2022.
5. What are some drivers contributing to market growth?
Increasing Occurrence Levels of Orthopedic Diseases and Cancers; Increasing Number of Serious Injuries; Technological Advancements and Advantages of Digital X-ray Systems Over Conventional X-rays.
6. What are the notable trends driving market growth?
The Direct Radiography Segment is Expected to Witness a High CAGR Over the Forecast Period.
7. Are there any restraints impacting market growth?
High Initial Cost of Installation; New Sales Affected by the Increasing Use of Refurbished Devices.
8. Can you provide examples of recent developments in the market?
In April 2022, Boston Imaging, the United States headquarters of Samsung digital radiography and ultrasound systems, introduces the GM85 Fit, a new configuration of the premium AccE GM85; a digital radiography device featuring a user-centric design that aids in efficient and effective patient care.
9. What pricing options are available for accessing the report?
Pricing options include single-user, multi-user, and enterprise licenses priced at USD 3800, USD 4500, and USD 5800 respectively.
10. Is the market size provided in terms of value or volume?
The market size is provided in terms of value, measured in Million and volume, measured in K Unit.
11. Are there any specific market keywords associated with the report?
Yes, the market keyword associated with the report is "U.S. Digital Radiology Devices Market," which aids in identifying and referencing the specific market segment covered.
12. How do I determine which pricing option suits my needs best?
The pricing options vary based on user requirements and access needs. Individual users may opt for single-user licenses, while businesses requiring broader access may choose multi-user or enterprise licenses for cost-effective access to the report.
13. Are there any additional resources or data provided in the U.S. Digital Radiology Devices Market report?
While the report offers comprehensive insights, it's advisable to review the specific contents or supplementary materials provided to ascertain if additional resources or data are available.
14. How can I stay updated on further developments or reports in the U.S. Digital Radiology Devices Market?
To stay informed about further developments, trends, and reports in the U.S. Digital Radiology Devices Market, consider subscribing to industry newsletters, following relevant companies and organizations, or regularly checking reputable industry news sources and publications.
Methodology
Step 1 - Identification of Relevant Samples Size from Population Database


Step 2 - Approaches for Defining Global Market Size (Value, Volume* & Price*)

Note*: In applicable scenarios
Step 3 - Data Sources
Primary Research
- Web Analytics
- Survey Reports
- Research Institute
- Latest Research Reports
- Opinion Leaders
Secondary Research
- Annual Reports
- White Paper
- Latest Press Release
- Industry Association
- Paid Database
- Investor Presentations

Step 4 - Data Triangulation
Involves using different sources of information in order to increase the validity of a study
These sources are likely to be stakeholders in a program - participants, other researchers, program staff, other community members, and so on.
Then we put all data in single framework & apply various statistical tools to find out the dynamic on the market.
During the analysis stage, feedback from the stakeholder groups would be compared to determine areas of agreement as well as areas of divergence
