

Key Insights
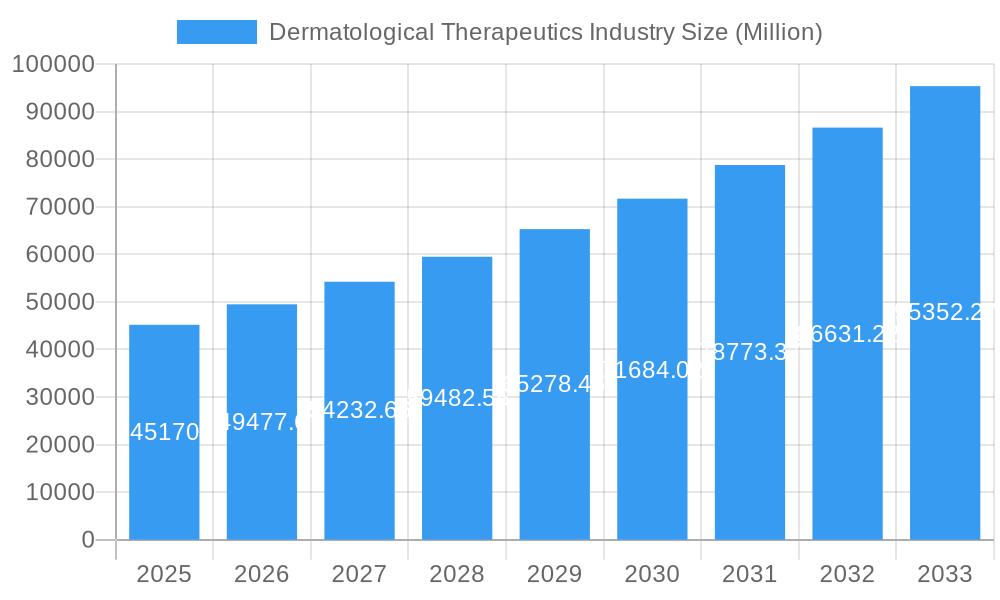
The dermatological therapeutics market, valued at $45.17 billion in 2025, is projected to experience robust growth, driven by a rising prevalence of skin diseases globally and an increasing awareness of dermatological health. The market's Compound Annual Growth Rate (CAGR) of 9.67% from 2025 to 2033 indicates significant expansion potential. Key drivers include the growing geriatric population (more susceptible to skin conditions), increased healthcare expenditure, and advancements in drug development leading to more effective and targeted therapies. The market is segmented by application (alopecia, herpes, psoriasis, rosacea, atopic dermatitis, and others) and drug class (anti-infectives, corticosteroids, anti-acne agents, calcineurin inhibitors, retinoids, and others), reflecting the diverse range of skin conditions and treatment options available. Significant growth is anticipated in segments addressing chronic conditions like psoriasis and atopic dermatitis, fueled by the increasing availability of biologics and targeted therapies. The market's geographic distribution shows strong performance in North America and Europe, driven by high healthcare spending and advanced healthcare infrastructure. However, the Asia-Pacific region is poised for substantial growth, driven by rising disposable incomes and increasing awareness of dermatological treatments. Competitive pressures are intense, with major pharmaceutical companies such as Johnson & Johnson, AbbVie, and Novartis leading the market. However, the market also presents opportunities for smaller, specialized companies focusing on innovative treatment approaches and niche applications.
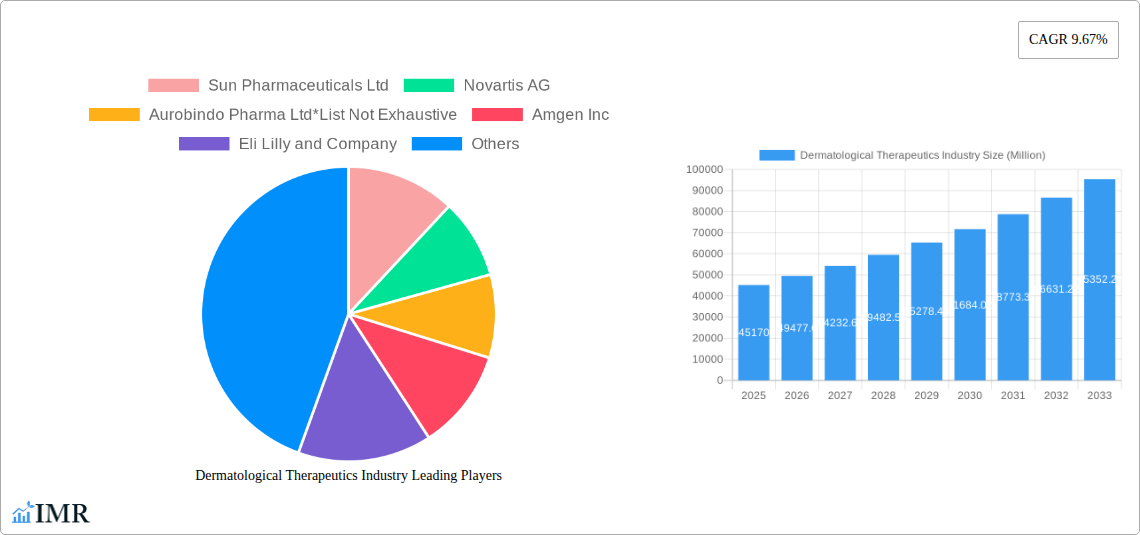
Dermatological Therapeutics Industry Market Size (In Billion)
The continued rise in prevalence of skin diseases coupled with ongoing research and development in newer, more effective therapies will shape the future of the dermatological therapeutics market. Factors like rising healthcare costs, increasing regulatory scrutiny, and the potential for generic competition will also influence market dynamics. Companies are focusing on strategic partnerships, mergers and acquisitions, and the development of personalized therapies to gain a competitive edge. The growing adoption of teledermatology and digital health technologies is expected to improve access to care and further drive market expansion, especially in regions with limited dermatological expertise. Overall, the dermatological therapeutics market presents a compelling investment opportunity with significant growth potential over the coming years.
Dermatological Therapeutics Industry Company Market Share
Dermatological Therapeutics Industry Market Report: 2019-2033
This comprehensive report provides an in-depth analysis of the dermatological therapeutics market, encompassing market size, growth trends, competitive landscape, and future outlook. The study period covers 2019-2033, with 2025 as the base and estimated year. The report segments the market by application (Alopecia, Herpes, Psoriasis, Rosacea, Atopic Dermatitis, Other Applications) and drug class (Anti-infectives, Corticosteroids, Anti-acne, Calcineurin Inhibitors, Retinoids, Other Drug Classes), offering granular insights into key market drivers and challenges. The report is essential for industry professionals, investors, and researchers seeking a thorough understanding of this dynamic market. The market value is presented in million units.
Dermatological Therapeutics Industry Market Dynamics & Structure
The dermatological therapeutics market is characterized by a moderately concentrated structure with several multinational pharmaceutical giants and specialized dermatology companies dominating the landscape. Market share is influenced by factors such as R&D capabilities, brand recognition, and the strength of sales and marketing channels. Technological innovation plays a crucial role, with the ongoing development of novel drug classes, targeted therapies, and biosimilars shaping competitive dynamics. Regulatory frameworks, including FDA approvals and pricing policies, significantly impact market access and profitability. The prevalence of chronic skin conditions fuels market growth, while the rise of biosimilars and generic drugs exerts downward pressure on prices. Mergers and acquisitions (M&A) activity is relatively frequent, with larger players consolidating their positions through strategic acquisitions of smaller, specialized companies with innovative product portfolios.
- Market Concentration: Moderately concentrated, with top 10 players holding approximately xx% market share in 2025.
- Technological Innovation: Significant R&D investments driving the development of novel therapeutics and delivery systems.
- Regulatory Landscape: Stringent regulatory approvals (e.g., FDA) significantly impact market entry and pricing strategies.
- Competitive Landscape: Intense competition driven by the presence of numerous large and specialized players.
- M&A Activity: Moderate levels of M&A activity observed, with larger firms acquiring smaller, innovative companies.
- Innovation Barriers: High R&D costs and lengthy regulatory approval processes pose challenges for innovation.
Dermatological Therapeutics Industry Growth Trends & Insights
The global dermatological therapeutics market is projected to witness substantial growth during the forecast period (2025-2033), driven by a multitude of factors. The increasing prevalence of chronic skin diseases like psoriasis, atopic dermatitis, and acne, coupled with a rising geriatric population susceptible to skin disorders, is a primary driver. Technological advancements, including the development of targeted therapies, biosimilars, and innovative drug delivery systems, further fuel market expansion. Consumer awareness regarding skin health is also growing, leading to increased demand for effective treatments. Changing lifestyles and environmental factors are also contributing to the rise in skin conditions, thus augmenting market growth. The market size is estimated at xx million units in 2025 and is projected to reach xx million units by 2033, exhibiting a CAGR of xx% during the forecast period. Market penetration of novel therapies remains relatively low, but is expected to increase due to favorable clinical outcomes and improved patient access.
Dominant Regions, Countries, or Segments in Dermatological Therapeutics Industry
North America currently holds the largest market share in the dermatological therapeutics industry, driven by high healthcare expenditure, a robust pharmaceutical infrastructure, and the prevalence of chronic skin diseases. However, the Asia-Pacific region is poised for significant growth due to rising disposable incomes, increasing healthcare awareness, and a rapidly expanding population. Within application segments, Psoriasis and Atopic Dermatitis represent the largest market segments due to their high prevalence and increasing treatment options. The Anti-infectives and Corticosteroids drug classes dominate in terms of market value, owing to their widespread use and long-established presence in the market.
- Key Drivers (North America): High healthcare expenditure, advanced medical infrastructure, strong regulatory framework.
- Key Drivers (Asia-Pacific): Rising disposable incomes, increasing healthcare awareness, large population base.
- Dominant Application Segment: Psoriasis and Atopic Dermatitis due to high prevalence and extensive treatment options.
- Dominant Drug Class: Anti-infectives and Corticosteroids due to widespread use and established market presence.
Dermatological Therapeutics Industry Product Landscape
The dermatological therapeutics market encompasses a wide array of products, including topical creams, ointments, lotions, gels, oral medications, and injectables. Innovation focuses on developing more effective, targeted therapies with improved safety profiles and enhanced patient compliance. Recent advancements include the introduction of biologics, biosimilars, and novel drug delivery systems like topical nanomedicines. These advancements aim to address unmet medical needs and improve treatment outcomes for various skin conditions. Unique selling propositions often include superior efficacy, reduced side effects, and convenient administration methods.
Key Drivers, Barriers & Challenges in Dermatological Therapeutics Industry
Key Drivers:
- Increasing prevalence of chronic skin diseases.
- Technological advancements in drug development and delivery systems.
- Rising healthcare expenditure and improved healthcare access.
Challenges & Restraints:
- High R&D costs and lengthy regulatory approval processes.
- Intense competition from established and emerging players.
- Pricing pressures from biosimilars and generic drugs. The impact of generic competition is estimated to reduce market growth by approximately xx% by 2033.
Emerging Opportunities in Dermatological Therapeutics Industry
Emerging opportunities lie in the development of personalized medicine approaches, targeting specific genetic subtypes of skin diseases. Untapped markets in developing countries offer significant growth potential, while the increasing adoption of telehealth platforms provides new avenues for patient engagement and access to treatment. Moreover, there is a growing interest in natural and herbal remedies for skin conditions, presenting opportunities for innovative product development.
Growth Accelerators in the Dermatological Therapeutics Industry Industry
Long-term growth will be accelerated by breakthroughs in targeted therapies, particularly those focused on novel pathways and mechanisms of action for chronic skin diseases. Strategic partnerships between pharmaceutical companies and biotechnology firms will foster innovation and accelerate product development. Expansion into emerging markets will be a crucial driver, alongside the adoption of innovative marketing and distribution strategies to improve patient access.
Key Players Shaping the Dermatological Therapeutics Industry Market
- Sun Pharmaceuticals Ltd
- Novartis AG
- Aurobindo Pharma Ltd
- Amgen Inc
- Eli Lilly and Company
- Galderma SA
- Abbvie Inc (Allergan PLC)
- Almirall SA
- Johnson & Johnson
- Bausch Health Companies Inc
- LEO Pharma AS
- Aclaris Therapeutics Inc
- Bristol-Myers Squibb Company
- GlaxoSmithKline PLC
- Pfizer Inc
Notable Milestones in Dermatological Therapeutics Industry Sector
- September 2022: US FDA approves Sotyktu (deucravacitinib) for moderate-to-severe plaque psoriasis.
- July 2022: FDA approves roflumilast cream (ZORYVE) for plaque psoriasis.
- January 2022: FDA approves Rinvoq for refractory, moderate-to-severe atopic dermatitis.
In-Depth Dermatological Therapeutics Industry Market Outlook
The dermatological therapeutics market is poised for continued robust growth, driven by factors such as the increasing prevalence of skin diseases, advancements in treatment modalities, and expanding access to healthcare. Strategic collaborations, investments in R&D, and the focus on personalized medicine will shape the future landscape. Untapped market segments, particularly in developing economies, present significant opportunities for market expansion and revenue growth. The focus on improving patient outcomes, combined with the development of innovative drug delivery systems and targeted therapies, will ensure the long-term sustainability and growth of the dermatological therapeutics market.
Dermatological Therapeutics Industry Segmentation
-
1. Application
- 1.1. Alopecia
- 1.2. Herpes
- 1.3. Psoriasis
- 1.4. Rosacea
- 1.5. Atopic Dermatitis
- 1.6. Other Applications
-
2. Drug Class
- 2.1. Anti-infectives
- 2.2. Corticosteroids
- 2.3. Anti-acne
- 2.4. Calcineurin Inhibitors
- 2.5. Retinoids
- 2.6. Other Drug Classes
Dermatological Therapeutics Industry Segmentation By Geography
-
1. North America
- 1.1. United States
- 1.2. Canada
- 1.3. Mexico
-
2. Europe
- 2.1. Germany
- 2.2. United Kingdom
- 2.3. France
- 2.4. Italy
- 2.5. Spain
- 2.6. Rest of Europe
-
3. Asia Pacific
- 3.1. China
- 3.2. Japan
- 3.3. India
- 3.4. Australia
- 3.5. South Korea
- 3.6. Rest of Asia Pacific
-
4. Middle East and Africa
- 4.1. GCC
- 4.2. South Africa
- 4.3. Rest of Middle East and Africa
-
5. South America
- 5.1. Brazil
- 5.2. Argentina
- 5.3. Rest of South America
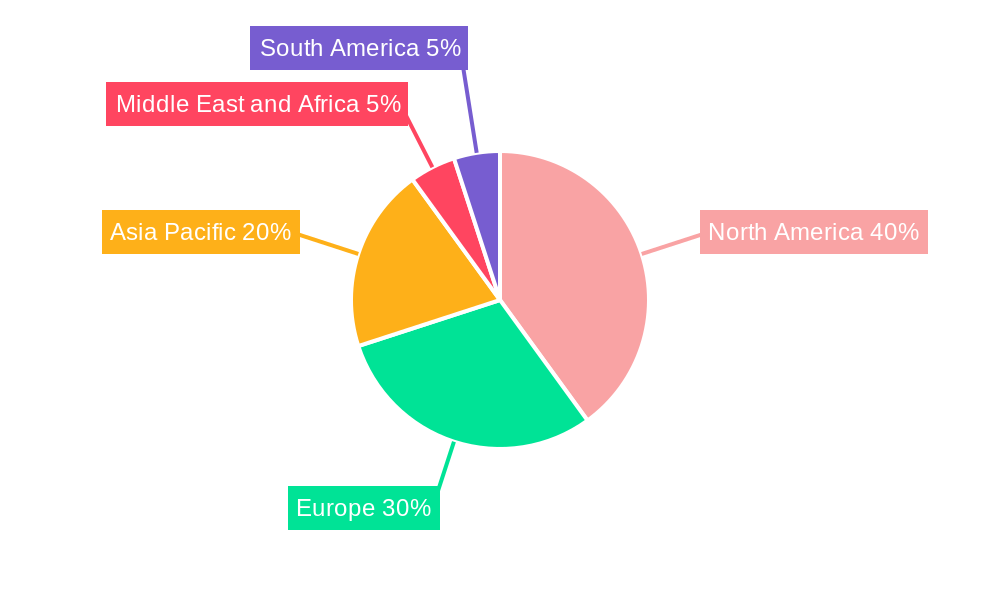
Dermatological Therapeutics Industry Regional Market Share
Geographic Coverage of Dermatological Therapeutics Industry
Dermatological Therapeutics Industry REPORT HIGHLIGHTS
| Aspects | Details |
|---|---|
| Study Period | 2020-2034 |
| Base Year | 2025 |
| Estimated Year | 2026 |
| Forecast Period | 2026-2034 |
| Historical Period | 2020-2025 |
| Growth Rate | CAGR of 9.67% from 2020-2034 |
| Segmentation |
|
Table of Contents
- 1. Introduction
- 1.1. Research Scope
- 1.2. Market Segmentation
- 1.3. Research Methodology
- 1.4. Definitions and Assumptions
- 2. Executive Summary
- 2.1. Introduction
- 3. Market Dynamics
- 3.1. Introduction
- 3.2. Market Drivers
- 3.2.1. Growing Burden of Dermatology Diseases; Increasing Awareness Levels of Disease Progression and Etiology; Increasing Elderly Population
- 3.3. Market Restrains
- 3.3.1. Serious Side Effects for Certain Classes of Therapeutic Drugs
- 3.4. Market Trends
- 3.4.1. Psoriasis Segment is Expected to Hold a Significant Market Share Over the Forecast Period
- 4. Market Factor Analysis
- 4.1. Porters Five Forces
- 4.2. Supply/Value Chain
- 4.3. PESTEL analysis
- 4.4. Market Entropy
- 4.5. Patent/Trademark Analysis
- 5. Global Dermatological Therapeutics Industry Analysis, Insights and Forecast, 2020-2032
- 5.1. Market Analysis, Insights and Forecast - by Application
- 5.1.1. Alopecia
- 5.1.2. Herpes
- 5.1.3. Psoriasis
- 5.1.4. Rosacea
- 5.1.5. Atopic Dermatitis
- 5.1.6. Other Applications
- 5.2. Market Analysis, Insights and Forecast - by Drug Class
- 5.2.1. Anti-infectives
- 5.2.2. Corticosteroids
- 5.2.3. Anti-acne
- 5.2.4. Calcineurin Inhibitors
- 5.2.5. Retinoids
- 5.2.6. Other Drug Classes
- 5.3. Market Analysis, Insights and Forecast - by Region
- 5.3.1. North America
- 5.3.2. Europe
- 5.3.3. Asia Pacific
- 5.3.4. Middle East and Africa
- 5.3.5. South America
- 5.1. Market Analysis, Insights and Forecast - by Application
- 6. North America Dermatological Therapeutics Industry Analysis, Insights and Forecast, 2020-2032
- 6.1. Market Analysis, Insights and Forecast - by Application
- 6.1.1. Alopecia
- 6.1.2. Herpes
- 6.1.3. Psoriasis
- 6.1.4. Rosacea
- 6.1.5. Atopic Dermatitis
- 6.1.6. Other Applications
- 6.2. Market Analysis, Insights and Forecast - by Drug Class
- 6.2.1. Anti-infectives
- 6.2.2. Corticosteroids
- 6.2.3. Anti-acne
- 6.2.4. Calcineurin Inhibitors
- 6.2.5. Retinoids
- 6.2.6. Other Drug Classes
- 6.1. Market Analysis, Insights and Forecast - by Application
- 7. Europe Dermatological Therapeutics Industry Analysis, Insights and Forecast, 2020-2032
- 7.1. Market Analysis, Insights and Forecast - by Application
- 7.1.1. Alopecia
- 7.1.2. Herpes
- 7.1.3. Psoriasis
- 7.1.4. Rosacea
- 7.1.5. Atopic Dermatitis
- 7.1.6. Other Applications
- 7.2. Market Analysis, Insights and Forecast - by Drug Class
- 7.2.1. Anti-infectives
- 7.2.2. Corticosteroids
- 7.2.3. Anti-acne
- 7.2.4. Calcineurin Inhibitors
- 7.2.5. Retinoids
- 7.2.6. Other Drug Classes
- 7.1. Market Analysis, Insights and Forecast - by Application
- 8. Asia Pacific Dermatological Therapeutics Industry Analysis, Insights and Forecast, 2020-2032
- 8.1. Market Analysis, Insights and Forecast - by Application
- 8.1.1. Alopecia
- 8.1.2. Herpes
- 8.1.3. Psoriasis
- 8.1.4. Rosacea
- 8.1.5. Atopic Dermatitis
- 8.1.6. Other Applications
- 8.2. Market Analysis, Insights and Forecast - by Drug Class
- 8.2.1. Anti-infectives
- 8.2.2. Corticosteroids
- 8.2.3. Anti-acne
- 8.2.4. Calcineurin Inhibitors
- 8.2.5. Retinoids
- 8.2.6. Other Drug Classes
- 8.1. Market Analysis, Insights and Forecast - by Application
- 9. Middle East and Africa Dermatological Therapeutics Industry Analysis, Insights and Forecast, 2020-2032
- 9.1. Market Analysis, Insights and Forecast - by Application
- 9.1.1. Alopecia
- 9.1.2. Herpes
- 9.1.3. Psoriasis
- 9.1.4. Rosacea
- 9.1.5. Atopic Dermatitis
- 9.1.6. Other Applications
- 9.2. Market Analysis, Insights and Forecast - by Drug Class
- 9.2.1. Anti-infectives
- 9.2.2. Corticosteroids
- 9.2.3. Anti-acne
- 9.2.4. Calcineurin Inhibitors
- 9.2.5. Retinoids
- 9.2.6. Other Drug Classes
- 9.1. Market Analysis, Insights and Forecast - by Application
- 10. South America Dermatological Therapeutics Industry Analysis, Insights and Forecast, 2020-2032
- 10.1. Market Analysis, Insights and Forecast - by Application
- 10.1.1. Alopecia
- 10.1.2. Herpes
- 10.1.3. Psoriasis
- 10.1.4. Rosacea
- 10.1.5. Atopic Dermatitis
- 10.1.6. Other Applications
- 10.2. Market Analysis, Insights and Forecast - by Drug Class
- 10.2.1. Anti-infectives
- 10.2.2. Corticosteroids
- 10.2.3. Anti-acne
- 10.2.4. Calcineurin Inhibitors
- 10.2.5. Retinoids
- 10.2.6. Other Drug Classes
- 10.1. Market Analysis, Insights and Forecast - by Application
- 11. Competitive Analysis
- 11.1. Global Market Share Analysis 2025
- 11.2. Company Profiles
- 11.2.1 Sun Pharmaceuticals Ltd
- 11.2.1.1. Overview
- 11.2.1.2. Products
- 11.2.1.3. SWOT Analysis
- 11.2.1.4. Recent Developments
- 11.2.1.5. Financials (Based on Availability)
- 11.2.2 Novartis AG
- 11.2.2.1. Overview
- 11.2.2.2. Products
- 11.2.2.3. SWOT Analysis
- 11.2.2.4. Recent Developments
- 11.2.2.5. Financials (Based on Availability)
- 11.2.3 Aurobindo Pharma Ltd*List Not Exhaustive
- 11.2.3.1. Overview
- 11.2.3.2. Products
- 11.2.3.3. SWOT Analysis
- 11.2.3.4. Recent Developments
- 11.2.3.5. Financials (Based on Availability)
- 11.2.4 Amgen Inc
- 11.2.4.1. Overview
- 11.2.4.2. Products
- 11.2.4.3. SWOT Analysis
- 11.2.4.4. Recent Developments
- 11.2.4.5. Financials (Based on Availability)
- 11.2.5 Eli Lilly and Company
- 11.2.5.1. Overview
- 11.2.5.2. Products
- 11.2.5.3. SWOT Analysis
- 11.2.5.4. Recent Developments
- 11.2.5.5. Financials (Based on Availability)
- 11.2.6 Galderma SA
- 11.2.6.1. Overview
- 11.2.6.2. Products
- 11.2.6.3. SWOT Analysis
- 11.2.6.4. Recent Developments
- 11.2.6.5. Financials (Based on Availability)
- 11.2.7 Abbvie Inc (Allergan PLC)
- 11.2.7.1. Overview
- 11.2.7.2. Products
- 11.2.7.3. SWOT Analysis
- 11.2.7.4. Recent Developments
- 11.2.7.5. Financials (Based on Availability)
- 11.2.8 Almirall SA
- 11.2.8.1. Overview
- 11.2.8.2. Products
- 11.2.8.3. SWOT Analysis
- 11.2.8.4. Recent Developments
- 11.2.8.5. Financials (Based on Availability)
- 11.2.9 Johnson & Johnson
- 11.2.9.1. Overview
- 11.2.9.2. Products
- 11.2.9.3. SWOT Analysis
- 11.2.9.4. Recent Developments
- 11.2.9.5. Financials (Based on Availability)
- 11.2.10 Bausch Health Companies Inc
- 11.2.10.1. Overview
- 11.2.10.2. Products
- 11.2.10.3. SWOT Analysis
- 11.2.10.4. Recent Developments
- 11.2.10.5. Financials (Based on Availability)
- 11.2.11 LEO Pharma AS
- 11.2.11.1. Overview
- 11.2.11.2. Products
- 11.2.11.3. SWOT Analysis
- 11.2.11.4. Recent Developments
- 11.2.11.5. Financials (Based on Availability)
- 11.2.12 Aclaris Therapeutics Inc
- 11.2.12.1. Overview
- 11.2.12.2. Products
- 11.2.12.3. SWOT Analysis
- 11.2.12.4. Recent Developments
- 11.2.12.5. Financials (Based on Availability)
- 11.2.13 Bristol-Myers Squibb Company
- 11.2.13.1. Overview
- 11.2.13.2. Products
- 11.2.13.3. SWOT Analysis
- 11.2.13.4. Recent Developments
- 11.2.13.5. Financials (Based on Availability)
- 11.2.14 GlaxoSmithKline PLC
- 11.2.14.1. Overview
- 11.2.14.2. Products
- 11.2.14.3. SWOT Analysis
- 11.2.14.4. Recent Developments
- 11.2.14.5. Financials (Based on Availability)
- 11.2.15 Pfizer Inc
- 11.2.15.1. Overview
- 11.2.15.2. Products
- 11.2.15.3. SWOT Analysis
- 11.2.15.4. Recent Developments
- 11.2.15.5. Financials (Based on Availability)
- 11.2.1 Sun Pharmaceuticals Ltd
List of Figures
- Figure 1: Global Dermatological Therapeutics Industry Revenue Breakdown (Million, %) by Region 2025 & 2033
- Figure 2: North America Dermatological Therapeutics Industry Revenue (Million), by Application 2025 & 2033
- Figure 3: North America Dermatological Therapeutics Industry Revenue Share (%), by Application 2025 & 2033
- Figure 4: North America Dermatological Therapeutics Industry Revenue (Million), by Drug Class 2025 & 2033
- Figure 5: North America Dermatological Therapeutics Industry Revenue Share (%), by Drug Class 2025 & 2033
- Figure 6: North America Dermatological Therapeutics Industry Revenue (Million), by Country 2025 & 2033
- Figure 7: North America Dermatological Therapeutics Industry Revenue Share (%), by Country 2025 & 2033
- Figure 8: Europe Dermatological Therapeutics Industry Revenue (Million), by Application 2025 & 2033
- Figure 9: Europe Dermatological Therapeutics Industry Revenue Share (%), by Application 2025 & 2033
- Figure 10: Europe Dermatological Therapeutics Industry Revenue (Million), by Drug Class 2025 & 2033
- Figure 11: Europe Dermatological Therapeutics Industry Revenue Share (%), by Drug Class 2025 & 2033
- Figure 12: Europe Dermatological Therapeutics Industry Revenue (Million), by Country 2025 & 2033
- Figure 13: Europe Dermatological Therapeutics Industry Revenue Share (%), by Country 2025 & 2033
- Figure 14: Asia Pacific Dermatological Therapeutics Industry Revenue (Million), by Application 2025 & 2033
- Figure 15: Asia Pacific Dermatological Therapeutics Industry Revenue Share (%), by Application 2025 & 2033
- Figure 16: Asia Pacific Dermatological Therapeutics Industry Revenue (Million), by Drug Class 2025 & 2033
- Figure 17: Asia Pacific Dermatological Therapeutics Industry Revenue Share (%), by Drug Class 2025 & 2033
- Figure 18: Asia Pacific Dermatological Therapeutics Industry Revenue (Million), by Country 2025 & 2033
- Figure 19: Asia Pacific Dermatological Therapeutics Industry Revenue Share (%), by Country 2025 & 2033
- Figure 20: Middle East and Africa Dermatological Therapeutics Industry Revenue (Million), by Application 2025 & 2033
- Figure 21: Middle East and Africa Dermatological Therapeutics Industry Revenue Share (%), by Application 2025 & 2033
- Figure 22: Middle East and Africa Dermatological Therapeutics Industry Revenue (Million), by Drug Class 2025 & 2033
- Figure 23: Middle East and Africa Dermatological Therapeutics Industry Revenue Share (%), by Drug Class 2025 & 2033
- Figure 24: Middle East and Africa Dermatological Therapeutics Industry Revenue (Million), by Country 2025 & 2033
- Figure 25: Middle East and Africa Dermatological Therapeutics Industry Revenue Share (%), by Country 2025 & 2033
- Figure 26: South America Dermatological Therapeutics Industry Revenue (Million), by Application 2025 & 2033
- Figure 27: South America Dermatological Therapeutics Industry Revenue Share (%), by Application 2025 & 2033
- Figure 28: South America Dermatological Therapeutics Industry Revenue (Million), by Drug Class 2025 & 2033
- Figure 29: South America Dermatological Therapeutics Industry Revenue Share (%), by Drug Class 2025 & 2033
- Figure 30: South America Dermatological Therapeutics Industry Revenue (Million), by Country 2025 & 2033
- Figure 31: South America Dermatological Therapeutics Industry Revenue Share (%), by Country 2025 & 2033
List of Tables
- Table 1: Global Dermatological Therapeutics Industry Revenue Million Forecast, by Application 2020 & 2033
- Table 2: Global Dermatological Therapeutics Industry Revenue Million Forecast, by Drug Class 2020 & 2033
- Table 3: Global Dermatological Therapeutics Industry Revenue Million Forecast, by Region 2020 & 2033
- Table 4: Global Dermatological Therapeutics Industry Revenue Million Forecast, by Application 2020 & 2033
- Table 5: Global Dermatological Therapeutics Industry Revenue Million Forecast, by Drug Class 2020 & 2033
- Table 6: Global Dermatological Therapeutics Industry Revenue Million Forecast, by Country 2020 & 2033
- Table 7: United States Dermatological Therapeutics Industry Revenue (Million) Forecast, by Application 2020 & 2033
- Table 8: Canada Dermatological Therapeutics Industry Revenue (Million) Forecast, by Application 2020 & 2033
- Table 9: Mexico Dermatological Therapeutics Industry Revenue (Million) Forecast, by Application 2020 & 2033
- Table 10: Global Dermatological Therapeutics Industry Revenue Million Forecast, by Application 2020 & 2033
- Table 11: Global Dermatological Therapeutics Industry Revenue Million Forecast, by Drug Class 2020 & 2033
- Table 12: Global Dermatological Therapeutics Industry Revenue Million Forecast, by Country 2020 & 2033
- Table 13: Germany Dermatological Therapeutics Industry Revenue (Million) Forecast, by Application 2020 & 2033
- Table 14: United Kingdom Dermatological Therapeutics Industry Revenue (Million) Forecast, by Application 2020 & 2033
- Table 15: France Dermatological Therapeutics Industry Revenue (Million) Forecast, by Application 2020 & 2033
- Table 16: Italy Dermatological Therapeutics Industry Revenue (Million) Forecast, by Application 2020 & 2033
- Table 17: Spain Dermatological Therapeutics Industry Revenue (Million) Forecast, by Application 2020 & 2033
- Table 18: Rest of Europe Dermatological Therapeutics Industry Revenue (Million) Forecast, by Application 2020 & 2033
- Table 19: Global Dermatological Therapeutics Industry Revenue Million Forecast, by Application 2020 & 2033
- Table 20: Global Dermatological Therapeutics Industry Revenue Million Forecast, by Drug Class 2020 & 2033
- Table 21: Global Dermatological Therapeutics Industry Revenue Million Forecast, by Country 2020 & 2033
- Table 22: China Dermatological Therapeutics Industry Revenue (Million) Forecast, by Application 2020 & 2033
- Table 23: Japan Dermatological Therapeutics Industry Revenue (Million) Forecast, by Application 2020 & 2033
- Table 24: India Dermatological Therapeutics Industry Revenue (Million) Forecast, by Application 2020 & 2033
- Table 25: Australia Dermatological Therapeutics Industry Revenue (Million) Forecast, by Application 2020 & 2033
- Table 26: South Korea Dermatological Therapeutics Industry Revenue (Million) Forecast, by Application 2020 & 2033
- Table 27: Rest of Asia Pacific Dermatological Therapeutics Industry Revenue (Million) Forecast, by Application 2020 & 2033
- Table 28: Global Dermatological Therapeutics Industry Revenue Million Forecast, by Application 2020 & 2033
- Table 29: Global Dermatological Therapeutics Industry Revenue Million Forecast, by Drug Class 2020 & 2033
- Table 30: Global Dermatological Therapeutics Industry Revenue Million Forecast, by Country 2020 & 2033
- Table 31: GCC Dermatological Therapeutics Industry Revenue (Million) Forecast, by Application 2020 & 2033
- Table 32: South Africa Dermatological Therapeutics Industry Revenue (Million) Forecast, by Application 2020 & 2033
- Table 33: Rest of Middle East and Africa Dermatological Therapeutics Industry Revenue (Million) Forecast, by Application 2020 & 2033
- Table 34: Global Dermatological Therapeutics Industry Revenue Million Forecast, by Application 2020 & 2033
- Table 35: Global Dermatological Therapeutics Industry Revenue Million Forecast, by Drug Class 2020 & 2033
- Table 36: Global Dermatological Therapeutics Industry Revenue Million Forecast, by Country 2020 & 2033
- Table 37: Brazil Dermatological Therapeutics Industry Revenue (Million) Forecast, by Application 2020 & 2033
- Table 38: Argentina Dermatological Therapeutics Industry Revenue (Million) Forecast, by Application 2020 & 2033
- Table 39: Rest of South America Dermatological Therapeutics Industry Revenue (Million) Forecast, by Application 2020 & 2033
Frequently Asked Questions
1. What is the projected Compound Annual Growth Rate (CAGR) of the Dermatological Therapeutics Industry?
The projected CAGR is approximately 9.67%.
2. Which companies are prominent players in the Dermatological Therapeutics Industry?
Key companies in the market include Sun Pharmaceuticals Ltd, Novartis AG, Aurobindo Pharma Ltd*List Not Exhaustive, Amgen Inc, Eli Lilly and Company, Galderma SA, Abbvie Inc (Allergan PLC), Almirall SA, Johnson & Johnson, Bausch Health Companies Inc, LEO Pharma AS, Aclaris Therapeutics Inc, Bristol-Myers Squibb Company, GlaxoSmithKline PLC, Pfizer Inc.
3. What are the main segments of the Dermatological Therapeutics Industry?
The market segments include Application, Drug Class.
4. Can you provide details about the market size?
The market size is estimated to be USD 45.17 Million as of 2022.
5. What are some drivers contributing to market growth?
Growing Burden of Dermatology Diseases; Increasing Awareness Levels of Disease Progression and Etiology; Increasing Elderly Population.
6. What are the notable trends driving market growth?
Psoriasis Segment is Expected to Hold a Significant Market Share Over the Forecast Period.
7. Are there any restraints impacting market growth?
Serious Side Effects for Certain Classes of Therapeutic Drugs.
8. Can you provide examples of recent developments in the market?
In September 2022, the US FDA approved Sotyktu (deucravacitinib), an oral treatment for adults with moderate-to-severe plaque psoriasis who are candidates for systemic therapy or phototherapy.
9. What pricing options are available for accessing the report?
Pricing options include single-user, multi-user, and enterprise licenses priced at USD 4750, USD 5250, and USD 8750 respectively.
10. Is the market size provided in terms of value or volume?
The market size is provided in terms of value, measured in Million.
11. Are there any specific market keywords associated with the report?
Yes, the market keyword associated with the report is "Dermatological Therapeutics Industry," which aids in identifying and referencing the specific market segment covered.
12. How do I determine which pricing option suits my needs best?
The pricing options vary based on user requirements and access needs. Individual users may opt for single-user licenses, while businesses requiring broader access may choose multi-user or enterprise licenses for cost-effective access to the report.
13. Are there any additional resources or data provided in the Dermatological Therapeutics Industry report?
While the report offers comprehensive insights, it's advisable to review the specific contents or supplementary materials provided to ascertain if additional resources or data are available.
14. How can I stay updated on further developments or reports in the Dermatological Therapeutics Industry?
To stay informed about further developments, trends, and reports in the Dermatological Therapeutics Industry, consider subscribing to industry newsletters, following relevant companies and organizations, or regularly checking reputable industry news sources and publications.
Methodology
Step 1 - Identification of Relevant Samples Size from Population Database


Step 2 - Approaches for Defining Global Market Size (Value, Volume* & Price*)

Note*: In applicable scenarios
Step 3 - Data Sources
Primary Research
- Web Analytics
- Survey Reports
- Research Institute
- Latest Research Reports
- Opinion Leaders
Secondary Research
- Annual Reports
- White Paper
- Latest Press Release
- Industry Association
- Paid Database
- Investor Presentations

Step 4 - Data Triangulation
Involves using different sources of information in order to increase the validity of a study
These sources are likely to be stakeholders in a program - participants, other researchers, program staff, other community members, and so on.
Then we put all data in single framework & apply various statistical tools to find out the dynamic on the market.
During the analysis stage, feedback from the stakeholder groups would be compared to determine areas of agreement as well as areas of divergence