

Key Insights
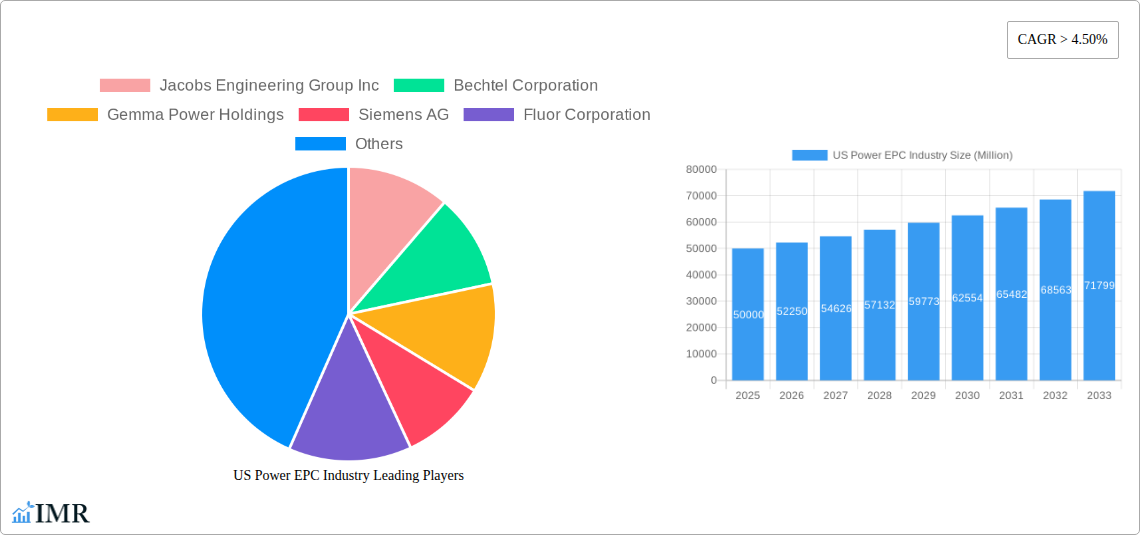
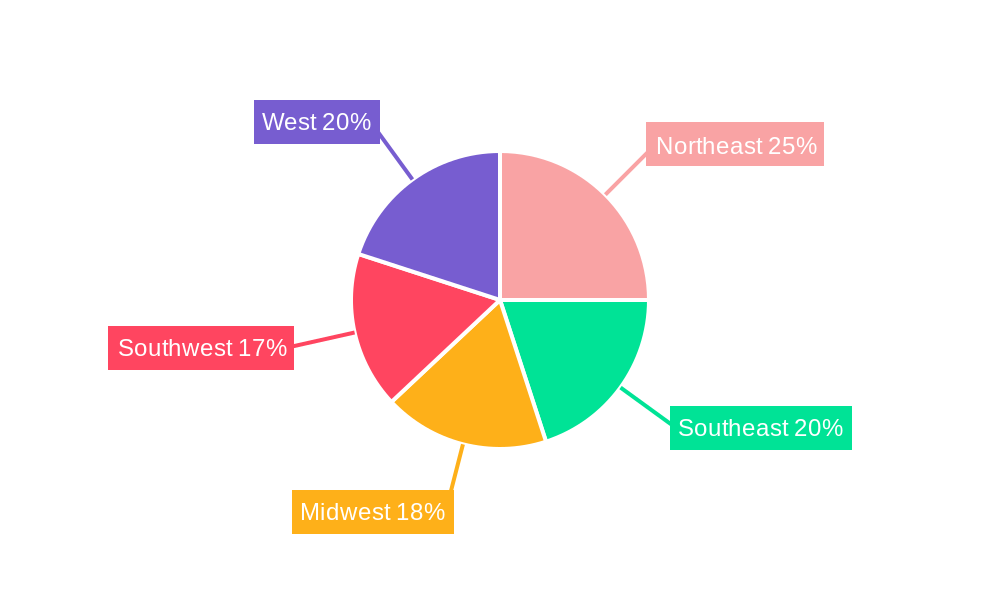
The US Power EPC (Engineering, Procurement, and Construction) industry is experiencing robust growth, driven by increasing investments in renewable energy sources and the ongoing need for grid modernization. The market, valued at approximately $50 billion in 2025, is projected to maintain a Compound Annual Growth Rate (CAGR) exceeding 4.5% through 2033. This expansion is fueled by several key factors. The significant push towards decarbonization is stimulating substantial investment in solar, wind, and other renewable energy projects, requiring substantial EPC services. Furthermore, aging infrastructure across the country necessitates upgrades and replacements, contributing significantly to the demand for EPC expertise. While regulatory hurdles and potential supply chain disruptions pose challenges, the long-term outlook for the industry remains positive, supported by supportive government policies and increasing private sector investment. Regional variations exist, with the Northeast and West exhibiting potentially higher growth rates due to advanced renewable energy adoption and existing infrastructure needs. Key players like Jacobs Engineering Group, Bechtel, and Siemens are well-positioned to capitalize on these opportunities through strategic partnerships and technological advancements in areas like digitalization and automation.
The competitive landscape is characterized by a mix of large multinational corporations and specialized regional firms. Successful companies are those that can effectively manage complex projects, adapt to evolving technological advancements, and navigate the regulatory landscape. Segmentation within the market showcases a shift towards renewable energy projects, although traditional thermal and gas-fired power plants continue to contribute significantly. Future growth will depend on the successful integration of renewable energy sources into the existing grid, the development of robust energy storage solutions, and continued government support for clean energy initiatives. This will further fuel the need for experienced EPC firms capable of handling the complexities of large-scale renewable energy projects, smart grid technologies, and energy storage solutions, making this a dynamic and highly lucrative sector for the foreseeable future.
US Power EPC Industry Market Report: 2019-2033
This comprehensive report provides a detailed analysis of the US Power Engineering, Procurement, and Construction (EPC) industry, offering invaluable insights for industry professionals, investors, and strategic planners. Covering the period 2019-2033, with a base year of 2025 and a forecast period of 2025-2033, this report dissects market dynamics, growth trends, and key player strategies within the parent market of the US Energy Sector and the child market of Power Generation EPC. The report is enriched with quantitative data, insightful analysis, and projections to help you navigate the complexities of this dynamic market. The total market size is estimated at xx Million in 2025.
US Power EPC Industry Market Dynamics & Structure
The US Power EPC market is characterized by a moderately concentrated structure, with major players like Bechtel Corporation, Jacobs Engineering Group Inc., and Fluor Corporation holding significant market share. Technological innovation, primarily driven by the increasing adoption of renewable energy sources and advancements in digitalization, is a key driver. Stringent regulatory frameworks, including environmental regulations and grid modernization initiatives, significantly influence industry practices. Competitive substitutes, such as independent power producers (IPPs) and distributed generation models, are impacting the traditional EPC business model. The end-user demographic is diverse, ranging from utilities and independent power producers to industrial consumers and government entities. Mergers and acquisitions (M&A) activity remains significant, with larger players consolidating their market positions and expanding their service portfolios.
- Market Concentration: High, with top 5 players holding approximately xx% of the market share in 2025.
- Technological Innovation: Focus on renewable energy EPC (solar, wind), digital twins, and AI-driven project management.
- Regulatory Framework: Stringent environmental regulations (Clean Air Act, Clean Water Act) and grid modernization initiatives influence project development.
- Competitive Substitutes: Rise of IPPs and distributed generation poses competitive pressure.
- M&A Activity: High, driven by consolidation and expansion into renewable energy sectors. xx deals recorded between 2019-2024.
US Power EPC Industry Growth Trends & Insights
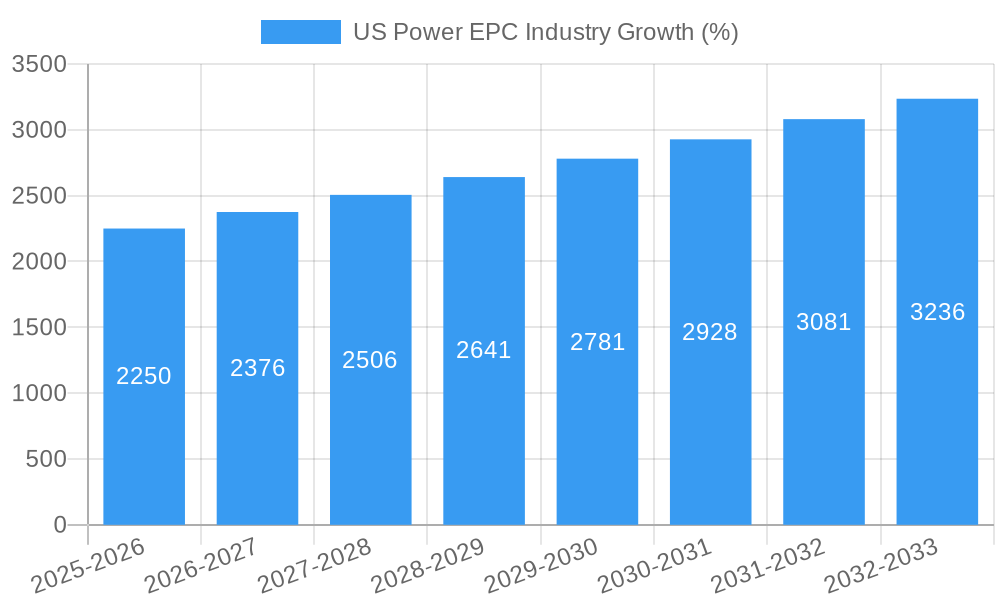
The US Power EPC market is experiencing robust growth, driven by factors such as increased investment in infrastructure modernization, growing energy demand, and the transition to cleaner energy sources. The market size is projected to expand at a CAGR of xx% from 2025 to 2033, reaching xx Million by 2033. This growth is significantly fueled by the increasing adoption of renewable energy technologies. Technological disruptions such as the integration of smart grids and advanced analytics are transforming project management and operations. Consumer behavior shifts towards sustainability and renewable energy are pushing demand for EPC services in the renewable energy sector. The market penetration of renewable energy EPC projects is expected to increase significantly, with a projected penetration rate of xx% by 2033.
Dominant Regions, Countries, or Segments in US Power EPC Industry
The growth of the US Power EPC market is largely driven by the Texas and California regions due to robust energy demand and significant investments in renewable energy projects. The Thermal segment remains dominant due to the continued reliance on traditional power generation. However, the Renewable segment is experiencing the fastest growth, fueled by government incentives, technological advancements, and environmental concerns.
- Key Drivers (Texas): Strong energy demand, significant investments in both fossil fuel and renewable projects, favorable regulatory environment.
- Key Drivers (California): Stringent environmental policies, high renewable energy adoption rates, focus on grid modernization.
- Segment Dominance: Thermal holds largest market share (xx%), followed by Gas (xx%), Renewable (xx%), Nuclear (xx%), and Other (xx%) in 2025.
- Fastest Growing Segment: Renewable energy EPC is exhibiting the fastest growth, fueled by government incentives and technological advancements.
US Power EPC Industry Product Landscape
The US Power EPC industry offers a wide range of services, encompassing project design, engineering, procurement, construction, and commissioning for various power generation technologies. Innovative solutions include the integration of digital twins for enhanced project management and the implementation of advanced analytics for optimizing operations and maintenance. The key selling propositions are project delivery speed, cost efficiency, and technical expertise.
Key Drivers, Barriers & Challenges in US Power EPC Industry
Key Drivers: Government investments in grid modernization, increasing demand for renewable energy, technological advancements in power generation technologies.
Key Challenges: Supply chain disruptions leading to material cost increases and project delays (estimated impact xx% on project costs in 2024), stringent regulatory compliance requirements and permitting processes, intense competition among EPC firms.
Emerging Opportunities in US Power EPC Industry
Emerging opportunities lie in the increasing demand for renewable energy integration projects, the growing adoption of smart grid technologies, and the development of energy storage solutions. Further opportunities exist in emerging markets within the US, as well as in international expansion.
Growth Accelerators in the US Power EPC Industry Industry
Long-term growth will be accelerated by technological breakthroughs in renewable energy, strategic partnerships between EPC firms and technology providers, and expansion into new geographical markets with significant renewable energy potential.
Key Players Shaping the US Power EPC Industry Market
- Jacobs Engineering Group Inc
- Bechtel Corporation
- Gemma Power Holdings
- Siemens AG
- Fluor Corporation
- John Wood Group PLC
- JGC Corporation
Notable Milestones in US Power EPC Industry Sector
- March 2021: Decade Corporation and Bechtel announced completion of EPC agreements for Rio Grande LNG project. This signaled a major investment in LNG infrastructure and boosted the market.
- January 2020: Gemma Power Systems secured an EPC contract for a 1.085 GW power project in Ohio. This highlighted the continued demand for large-scale power generation projects.
In-Depth US Power EPC Industry Market Outlook
The US Power EPC market is poised for sustained growth, driven by significant investments in renewable energy, grid modernization, and decarbonization initiatives. Strategic partnerships, technological advancements, and expansion into underserved markets will be key success factors for EPC firms. The future holds significant opportunities for players capable of adapting to the evolving energy landscape and embracing innovative technologies.
US Power EPC Industry Segmentation
-
1. Type
- 1.1. Thermal
- 1.2. Gas
- 1.3. Renewable
- 1.4. Nuclear
- 1.5. Other Types
US Power EPC Industry Segmentation By Geography
-
1. North America
- 1.1. United States
- 1.2. Canada
- 1.3. Mexico
-
2. South America
- 2.1. Brazil
- 2.2. Argentina
- 2.3. Rest of South America
-
3. Europe
- 3.1. United Kingdom
- 3.2. Germany
- 3.3. France
- 3.4. Italy
- 3.5. Spain
- 3.6. Russia
- 3.7. Benelux
- 3.8. Nordics
- 3.9. Rest of Europe
-
4. Middle East & Africa
- 4.1. Turkey
- 4.2. Israel
- 4.3. GCC
- 4.4. North Africa
- 4.5. South Africa
- 4.6. Rest of Middle East & Africa
-
5. Asia Pacific
- 5.1. China
- 5.2. India
- 5.3. Japan
- 5.4. South Korea
- 5.5. ASEAN
- 5.6. Oceania
- 5.7. Rest of Asia Pacific
US Power EPC Industry REPORT HIGHLIGHTS
| Aspects | Details |
|---|---|
| Study Period | 2019-2033 |
| Base Year | 2024 |
| Estimated Year | 2025 |
| Forecast Period | 2025-2033 |
| Historical Period | 2019-2024 |
| Growth Rate | CAGR of > 4.50% from 2019-2033 |
| Segmentation |
|
Table of Contents
- 1. Introduction
- 1.1. Research Scope
- 1.2. Market Segmentation
- 1.3. Research Methodology
- 1.4. Definitions and Assumptions
- 2. Executive Summary
- 2.1. Introduction
- 3. Market Dynamics
- 3.1. Introduction
- 3.2. Market Drivers
- 3.2.1. 4.; Growing Vehicle Ownership4.; Government Initiatives
- 3.3. Market Restrains
- 3.3.1. 4.; Volatile Crude Oil Prices
- 3.4. Market Trends
- 3.4.1. Thermal Type Sub-segment to Dominate the Market
- 4. Market Factor Analysis
- 4.1. Porters Five Forces
- 4.2. Supply/Value Chain
- 4.3. PESTEL analysis
- 4.4. Market Entropy
- 4.5. Patent/Trademark Analysis
- 5. Global US Power EPC Industry Analysis, Insights and Forecast, 2019-2031
- 5.1. Market Analysis, Insights and Forecast - by Type
- 5.1.1. Thermal
- 5.1.2. Gas
- 5.1.3. Renewable
- 5.1.4. Nuclear
- 5.1.5. Other Types
- 5.2. Market Analysis, Insights and Forecast - by Region
- 5.2.1. North America
- 5.2.2. South America
- 5.2.3. Europe
- 5.2.4. Middle East & Africa
- 5.2.5. Asia Pacific
- 5.1. Market Analysis, Insights and Forecast - by Type
- 6. North America US Power EPC Industry Analysis, Insights and Forecast, 2019-2031
- 6.1. Market Analysis, Insights and Forecast - by Type
- 6.1.1. Thermal
- 6.1.2. Gas
- 6.1.3. Renewable
- 6.1.4. Nuclear
- 6.1.5. Other Types
- 6.1. Market Analysis, Insights and Forecast - by Type
- 7. South America US Power EPC Industry Analysis, Insights and Forecast, 2019-2031
- 7.1. Market Analysis, Insights and Forecast - by Type
- 7.1.1. Thermal
- 7.1.2. Gas
- 7.1.3. Renewable
- 7.1.4. Nuclear
- 7.1.5. Other Types
- 7.1. Market Analysis, Insights and Forecast - by Type
- 8. Europe US Power EPC Industry Analysis, Insights and Forecast, 2019-2031
- 8.1. Market Analysis, Insights and Forecast - by Type
- 8.1.1. Thermal
- 8.1.2. Gas
- 8.1.3. Renewable
- 8.1.4. Nuclear
- 8.1.5. Other Types
- 8.1. Market Analysis, Insights and Forecast - by Type
- 9. Middle East & Africa US Power EPC Industry Analysis, Insights and Forecast, 2019-2031
- 9.1. Market Analysis, Insights and Forecast - by Type
- 9.1.1. Thermal
- 9.1.2. Gas
- 9.1.3. Renewable
- 9.1.4. Nuclear
- 9.1.5. Other Types
- 9.1. Market Analysis, Insights and Forecast - by Type
- 10. Asia Pacific US Power EPC Industry Analysis, Insights and Forecast, 2019-2031
- 10.1. Market Analysis, Insights and Forecast - by Type
- 10.1.1. Thermal
- 10.1.2. Gas
- 10.1.3. Renewable
- 10.1.4. Nuclear
- 10.1.5. Other Types
- 10.1. Market Analysis, Insights and Forecast - by Type
- 11. Northeast US Power EPC Industry Analysis, Insights and Forecast, 2019-2031
- 12. Southeast US Power EPC Industry Analysis, Insights and Forecast, 2019-2031
- 13. Midwest US Power EPC Industry Analysis, Insights and Forecast, 2019-2031
- 14. Southwest US Power EPC Industry Analysis, Insights and Forecast, 2019-2031
- 15. West US Power EPC Industry Analysis, Insights and Forecast, 2019-2031
- 16. Competitive Analysis
- 16.1. Global Market Share Analysis 2024
- 16.2. Company Profiles
- 16.2.1 Jacobs Engineering Group Inc
- 16.2.1.1. Overview
- 16.2.1.2. Products
- 16.2.1.3. SWOT Analysis
- 16.2.1.4. Recent Developments
- 16.2.1.5. Financials (Based on Availability)
- 16.2.2 Bechtel Corporation
- 16.2.2.1. Overview
- 16.2.2.2. Products
- 16.2.2.3. SWOT Analysis
- 16.2.2.4. Recent Developments
- 16.2.2.5. Financials (Based on Availability)
- 16.2.3 Gemma Power Holdings
- 16.2.3.1. Overview
- 16.2.3.2. Products
- 16.2.3.3. SWOT Analysis
- 16.2.3.4. Recent Developments
- 16.2.3.5. Financials (Based on Availability)
- 16.2.4 Siemens AG
- 16.2.4.1. Overview
- 16.2.4.2. Products
- 16.2.4.3. SWOT Analysis
- 16.2.4.4. Recent Developments
- 16.2.4.5. Financials (Based on Availability)
- 16.2.5 Fluor Corporation
- 16.2.5.1. Overview
- 16.2.5.2. Products
- 16.2.5.3. SWOT Analysis
- 16.2.5.4. Recent Developments
- 16.2.5.5. Financials (Based on Availability)
- 16.2.6 John Wood Group PLC
- 16.2.6.1. Overview
- 16.2.6.2. Products
- 16.2.6.3. SWOT Analysis
- 16.2.6.4. Recent Developments
- 16.2.6.5. Financials (Based on Availability)
- 16.2.7 JGC Corporation
- 16.2.7.1. Overview
- 16.2.7.2. Products
- 16.2.7.3. SWOT Analysis
- 16.2.7.4. Recent Developments
- 16.2.7.5. Financials (Based on Availability)
- 16.2.1 Jacobs Engineering Group Inc
List of Figures
- Figure 1: Global US Power EPC Industry Revenue Breakdown (Million, %) by Region 2024 & 2032
- Figure 2: United states US Power EPC Industry Revenue (Million), by Country 2024 & 2032
- Figure 3: United states US Power EPC Industry Revenue Share (%), by Country 2024 & 2032
- Figure 4: North America US Power EPC Industry Revenue (Million), by Type 2024 & 2032
- Figure 5: North America US Power EPC Industry Revenue Share (%), by Type 2024 & 2032
- Figure 6: North America US Power EPC Industry Revenue (Million), by Country 2024 & 2032
- Figure 7: North America US Power EPC Industry Revenue Share (%), by Country 2024 & 2032
- Figure 8: South America US Power EPC Industry Revenue (Million), by Type 2024 & 2032
- Figure 9: South America US Power EPC Industry Revenue Share (%), by Type 2024 & 2032
- Figure 10: South America US Power EPC Industry Revenue (Million), by Country 2024 & 2032
- Figure 11: South America US Power EPC Industry Revenue Share (%), by Country 2024 & 2032
- Figure 12: Europe US Power EPC Industry Revenue (Million), by Type 2024 & 2032
- Figure 13: Europe US Power EPC Industry Revenue Share (%), by Type 2024 & 2032
- Figure 14: Europe US Power EPC Industry Revenue (Million), by Country 2024 & 2032
- Figure 15: Europe US Power EPC Industry Revenue Share (%), by Country 2024 & 2032
- Figure 16: Middle East & Africa US Power EPC Industry Revenue (Million), by Type 2024 & 2032
- Figure 17: Middle East & Africa US Power EPC Industry Revenue Share (%), by Type 2024 & 2032
- Figure 18: Middle East & Africa US Power EPC Industry Revenue (Million), by Country 2024 & 2032
- Figure 19: Middle East & Africa US Power EPC Industry Revenue Share (%), by Country 2024 & 2032
- Figure 20: Asia Pacific US Power EPC Industry Revenue (Million), by Type 2024 & 2032
- Figure 21: Asia Pacific US Power EPC Industry Revenue Share (%), by Type 2024 & 2032
- Figure 22: Asia Pacific US Power EPC Industry Revenue (Million), by Country 2024 & 2032
- Figure 23: Asia Pacific US Power EPC Industry Revenue Share (%), by Country 2024 & 2032
List of Tables
- Table 1: Global US Power EPC Industry Revenue Million Forecast, by Region 2019 & 2032
- Table 2: Global US Power EPC Industry Revenue Million Forecast, by Type 2019 & 2032
- Table 3: Global US Power EPC Industry Revenue Million Forecast, by Region 2019 & 2032
- Table 4: Global US Power EPC Industry Revenue Million Forecast, by Country 2019 & 2032
- Table 5: Northeast US Power EPC Industry Revenue (Million) Forecast, by Application 2019 & 2032
- Table 6: Southeast US Power EPC Industry Revenue (Million) Forecast, by Application 2019 & 2032
- Table 7: Midwest US Power EPC Industry Revenue (Million) Forecast, by Application 2019 & 2032
- Table 8: Southwest US Power EPC Industry Revenue (Million) Forecast, by Application 2019 & 2032
- Table 9: West US Power EPC Industry Revenue (Million) Forecast, by Application 2019 & 2032
- Table 10: Global US Power EPC Industry Revenue Million Forecast, by Type 2019 & 2032
- Table 11: Global US Power EPC Industry Revenue Million Forecast, by Country 2019 & 2032
- Table 12: United States US Power EPC Industry Revenue (Million) Forecast, by Application 2019 & 2032
- Table 13: Canada US Power EPC Industry Revenue (Million) Forecast, by Application 2019 & 2032
- Table 14: Mexico US Power EPC Industry Revenue (Million) Forecast, by Application 2019 & 2032
- Table 15: Global US Power EPC Industry Revenue Million Forecast, by Type 2019 & 2032
- Table 16: Global US Power EPC Industry Revenue Million Forecast, by Country 2019 & 2032
- Table 17: Brazil US Power EPC Industry Revenue (Million) Forecast, by Application 2019 & 2032
- Table 18: Argentina US Power EPC Industry Revenue (Million) Forecast, by Application 2019 & 2032
- Table 19: Rest of South America US Power EPC Industry Revenue (Million) Forecast, by Application 2019 & 2032
- Table 20: Global US Power EPC Industry Revenue Million Forecast, by Type 2019 & 2032
- Table 21: Global US Power EPC Industry Revenue Million Forecast, by Country 2019 & 2032
- Table 22: United Kingdom US Power EPC Industry Revenue (Million) Forecast, by Application 2019 & 2032
- Table 23: Germany US Power EPC Industry Revenue (Million) Forecast, by Application 2019 & 2032
- Table 24: France US Power EPC Industry Revenue (Million) Forecast, by Application 2019 & 2032
- Table 25: Italy US Power EPC Industry Revenue (Million) Forecast, by Application 2019 & 2032
- Table 26: Spain US Power EPC Industry Revenue (Million) Forecast, by Application 2019 & 2032
- Table 27: Russia US Power EPC Industry Revenue (Million) Forecast, by Application 2019 & 2032
- Table 28: Benelux US Power EPC Industry Revenue (Million) Forecast, by Application 2019 & 2032
- Table 29: Nordics US Power EPC Industry Revenue (Million) Forecast, by Application 2019 & 2032
- Table 30: Rest of Europe US Power EPC Industry Revenue (Million) Forecast, by Application 2019 & 2032
- Table 31: Global US Power EPC Industry Revenue Million Forecast, by Type 2019 & 2032
- Table 32: Global US Power EPC Industry Revenue Million Forecast, by Country 2019 & 2032
- Table 33: Turkey US Power EPC Industry Revenue (Million) Forecast, by Application 2019 & 2032
- Table 34: Israel US Power EPC Industry Revenue (Million) Forecast, by Application 2019 & 2032
- Table 35: GCC US Power EPC Industry Revenue (Million) Forecast, by Application 2019 & 2032
- Table 36: North Africa US Power EPC Industry Revenue (Million) Forecast, by Application 2019 & 2032
- Table 37: South Africa US Power EPC Industry Revenue (Million) Forecast, by Application 2019 & 2032
- Table 38: Rest of Middle East & Africa US Power EPC Industry Revenue (Million) Forecast, by Application 2019 & 2032
- Table 39: Global US Power EPC Industry Revenue Million Forecast, by Type 2019 & 2032
- Table 40: Global US Power EPC Industry Revenue Million Forecast, by Country 2019 & 2032
- Table 41: China US Power EPC Industry Revenue (Million) Forecast, by Application 2019 & 2032
- Table 42: India US Power EPC Industry Revenue (Million) Forecast, by Application 2019 & 2032
- Table 43: Japan US Power EPC Industry Revenue (Million) Forecast, by Application 2019 & 2032
- Table 44: South Korea US Power EPC Industry Revenue (Million) Forecast, by Application 2019 & 2032
- Table 45: ASEAN US Power EPC Industry Revenue (Million) Forecast, by Application 2019 & 2032
- Table 46: Oceania US Power EPC Industry Revenue (Million) Forecast, by Application 2019 & 2032
- Table 47: Rest of Asia Pacific US Power EPC Industry Revenue (Million) Forecast, by Application 2019 & 2032
Frequently Asked Questions
1. What is the projected Compound Annual Growth Rate (CAGR) of the US Power EPC Industry?
The projected CAGR is approximately > 4.50%.
2. Which companies are prominent players in the US Power EPC Industry?
Key companies in the market include Jacobs Engineering Group Inc, Bechtel Corporation, Gemma Power Holdings, Siemens AG, Fluor Corporation, John Wood Group PLC, JGC Corporation.
3. What are the main segments of the US Power EPC Industry?
The market segments include Type.
4. Can you provide details about the market size?
The market size is estimated to be USD XX Million as of 2022.
5. What are some drivers contributing to market growth?
4.; Growing Vehicle Ownership4.; Government Initiatives.
6. What are the notable trends driving market growth?
Thermal Type Sub-segment to Dominate the Market.
7. Are there any restraints impacting market growth?
4.; Volatile Crude Oil Prices.
8. Can you provide examples of recent developments in the market?
In March 2021, Decade Corporation and Bechtel Oil & Gas and Chemicals Inc. (Bechtel) announced the completion of engineering, procurement, and construction agreements for the first three trains at NextDecade's Rio Grande LNG project.
9. What pricing options are available for accessing the report?
Pricing options include single-user, multi-user, and enterprise licenses priced at USD 3800, USD 4500, and USD 5800 respectively.
10. Is the market size provided in terms of value or volume?
The market size is provided in terms of value, measured in Million.
11. Are there any specific market keywords associated with the report?
Yes, the market keyword associated with the report is "US Power EPC Industry," which aids in identifying and referencing the specific market segment covered.
12. How do I determine which pricing option suits my needs best?
The pricing options vary based on user requirements and access needs. Individual users may opt for single-user licenses, while businesses requiring broader access may choose multi-user or enterprise licenses for cost-effective access to the report.
13. Are there any additional resources or data provided in the US Power EPC Industry report?
While the report offers comprehensive insights, it's advisable to review the specific contents or supplementary materials provided to ascertain if additional resources or data are available.
14. How can I stay updated on further developments or reports in the US Power EPC Industry?
To stay informed about further developments, trends, and reports in the US Power EPC Industry, consider subscribing to industry newsletters, following relevant companies and organizations, or regularly checking reputable industry news sources and publications.
Methodology
Step 1 - Identification of Relevant Samples Size from Population Database


Step 2 - Approaches for Defining Global Market Size (Value, Volume* & Price*)

Note*: In applicable scenarios
Step 3 - Data Sources
Primary Research
- Web Analytics
- Survey Reports
- Research Institute
- Latest Research Reports
- Opinion Leaders
Secondary Research
- Annual Reports
- White Paper
- Latest Press Release
- Industry Association
- Paid Database
- Investor Presentations

Step 4 - Data Triangulation
Involves using different sources of information in order to increase the validity of a study
These sources are likely to be stakeholders in a program - participants, other researchers, program staff, other community members, and so on.
Then we put all data in single framework & apply various statistical tools to find out the dynamic on the market.
During the analysis stage, feedback from the stakeholder groups would be compared to determine areas of agreement as well as areas of divergence
