

Key Insights
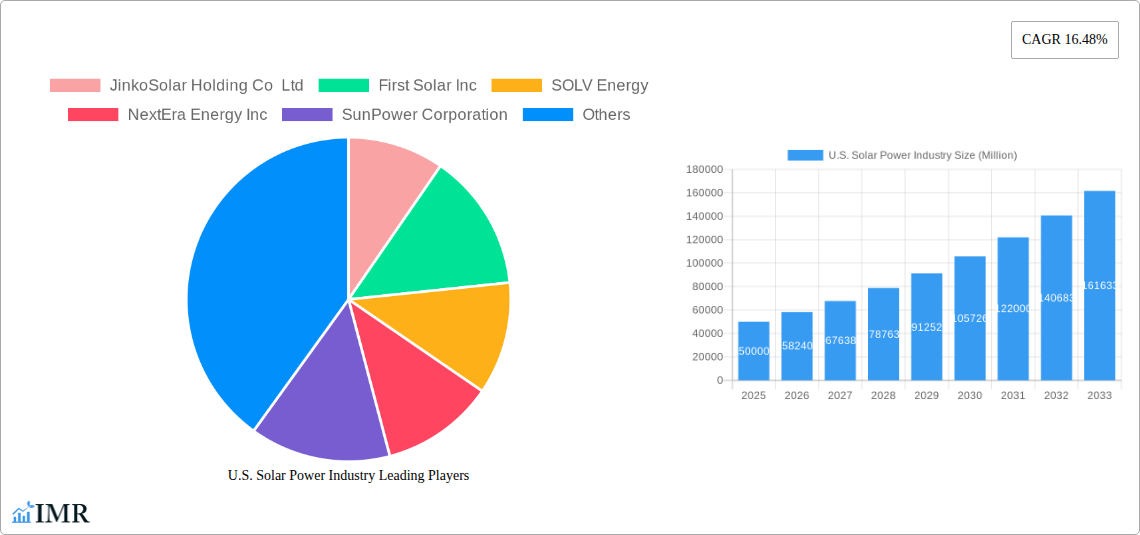
The U.S. solar power industry is experiencing robust growth, driven by increasing environmental concerns, supportive government policies like tax credits and renewable energy mandates, and decreasing solar panel costs. The market, segmented into Solar Photovoltaic (PV) and Concentrated Solar Power (CSP), is projected to maintain a Compound Annual Growth Rate (CAGR) of 16.48% from 2025 to 2033. This growth is fueled by a significant increase in residential and commercial solar installations, spurred by falling prices and improved energy efficiency. The Southwest and West regions are leading the charge due to higher solar irradiance levels and favorable regulatory environments, though significant expansion is occurring across all regions, including the Northeast and Southeast as technology and policy support improve access. While land availability and grid integration challenges pose some constraints, ongoing technological advancements in solar panel efficiency and energy storage solutions are mitigating these limitations. Major players like JinkoSolar, First Solar, and SunPower, along with established energy companies like NextEra Energy, are significantly contributing to the industry's expansion, investing in large-scale solar farms and enhancing their project development capabilities. The established presence of EPC (Engineering, Procurement, and Construction) companies like SOLV Energy, Rosendin Electric, and Mortenson Company is further bolstering the industry’s capacity to deliver projects.
The substantial growth trajectory of the U.S. solar power market is expected to continue, primarily driven by the increasing affordability of solar energy, heightened environmental awareness, and robust government incentives. The competition among leading companies is fostering innovation and efficiency improvements. However, challenges remain, including the intermittent nature of solar power, necessitating further investment in energy storage solutions. Moreover, the permitting and regulatory processes can still present delays for project deployment. Nevertheless, the long-term outlook for the U.S. solar power industry remains positive, with projections indicating significant market expansion over the forecast period. Strategic partnerships between established players and emerging companies are accelerating the development of innovative technologies and business models, further solidifying the industry's position as a key player in the nation's transition to cleaner energy sources.
U.S. Solar Power Industry Market Report: 2019-2033
This comprehensive report provides an in-depth analysis of the U.S. solar power industry, encompassing market dynamics, growth trends, key players, and future outlook. With a study period spanning 2019-2033, a base year of 2025, and a forecast period of 2025-2033, this report is an essential resource for industry professionals, investors, and policymakers. The report analyzes both parent market (renewable energy) and child market (solar PV and CSP) to deliver a holistic understanding. Market values are presented in millions of USD.
U.S. Solar Power Industry Market Dynamics & Structure
The U.S. solar power market is characterized by increasing concentration among major players, alongside a wave of technological innovation and strategic mergers & acquisitions (M&A). The market is segmented into Solar Photovoltaic (PV) and Concentrated Solar Power (CSP), with PV dominating. Regulatory frameworks, including federal and state incentives, play a crucial role in shaping market growth. The competitive landscape includes established players and emerging startups, driving innovation and cost reduction. Key end-users include residential, commercial, and utility sectors.
- Market Concentration: The top 5 players hold approximately xx% of the market share in 2025 (estimated).
- Technological Innovation: Advancements in PV cell efficiency, battery storage integration, and smart grid technologies are key drivers.
- Regulatory Framework: Federal tax credits and state renewable portfolio standards (RPS) significantly influence market growth.
- M&A Activity: The number of M&A deals in the solar sector reached xx in 2024, demonstrating industry consolidation.
- Competitive Substitutes: Other renewable energy sources, such as wind power and hydroelectricity, compete for market share.
- Innovation Barriers: High upfront capital costs and permitting challenges remain obstacles to faster market expansion.
U.S. Solar Power Industry Growth Trends & Insights
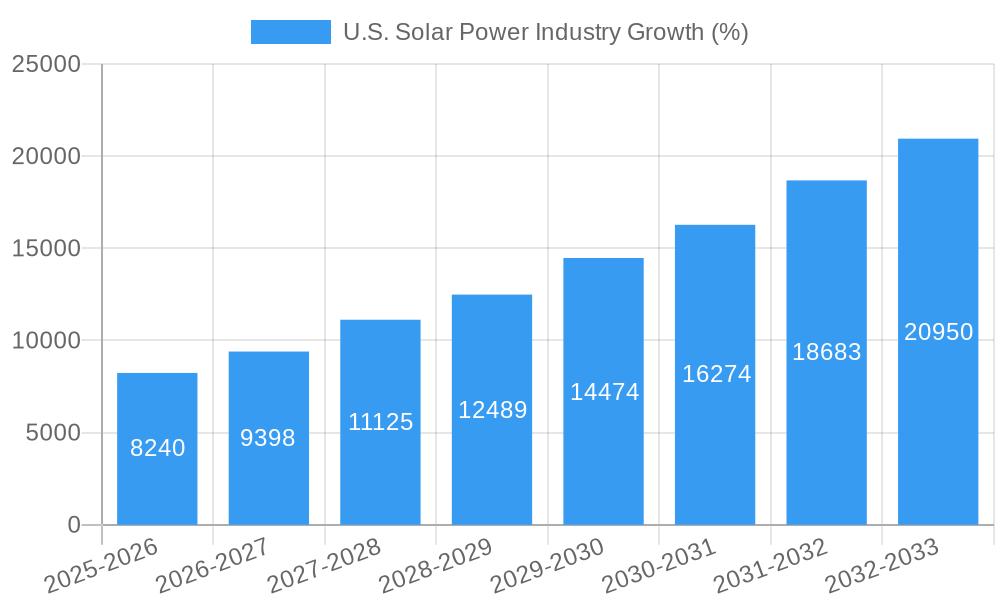
The U.S. solar power market has experienced substantial growth over the past few years. Driven by declining costs, supportive government policies, and increasing environmental awareness, the market is poised for continued expansion. The adoption rate of solar PV systems has accelerated significantly, particularly in the residential and commercial sectors. Technological advancements, such as higher-efficiency panels and improved energy storage solutions, further propel market growth. Consumer behavior is shifting toward greater adoption of renewable energy, driven by both economic and environmental considerations.
The market size is projected to reach xx million USD in 2025 (estimated), with a CAGR of xx% during the forecast period (2025-2033). Market penetration is anticipated to reach xx% by 2033. Disruptive technologies, such as Perovskite solar cells and floating solar farms, hold substantial potential to reshape the industry's landscape.
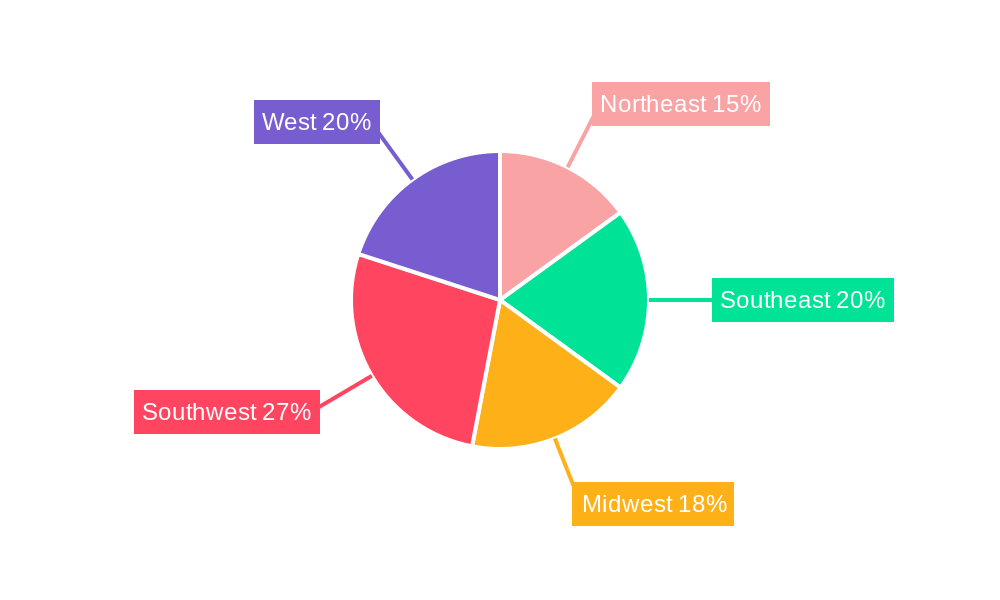
Dominant Regions, Countries, or Segments in U.S. Solar Power Industry
The Southwest region of the United States, including California, Arizona, and Nevada, leads the market, benefitting from abundant sunshine and supportive policies. Within the segments, Solar Photovoltaic (PV) technology overwhelmingly dominates the market, due to its lower cost and higher efficiency compared to CSP.
- Key Drivers for Southwest Region:
- High solar irradiance levels.
- Favorable state-level renewable energy policies and incentives.
- Established infrastructure for solar energy development.
- Dominance Factors for PV:
- Lower manufacturing costs compared to CSP.
- Higher efficiency and wider range of applications.
- Easier installation and wider market acceptance.
- Growth Potential: Continued expansion is expected in the Southeast and Midwest regions, driven by increasing investment and policy support. CSP is anticipated to experience niche growth due to applications in concentrated solar thermal power generation and industrial processes.
U.S. Solar Power Industry Product Landscape
The U.S. solar power industry offers a diverse range of products, including monocrystalline and polycrystalline silicon PV modules, solar trackers, inverters, and energy storage systems. Recent innovations focus on enhancing efficiency, durability, and aesthetics. Product differentiation is driven by factors such as power output, warranty periods, and integration capabilities with smart home systems. The industry is witnessing the emergence of next-generation PV technologies, including Perovskite and tandem solar cells, promising even higher efficiency levels.
Key Drivers, Barriers & Challenges in U.S. Solar Power Industry
Key Drivers:
- Decreasing costs of solar PV modules.
- Increasing government support through tax incentives and subsidies.
- Growing environmental awareness and demand for clean energy.
- Technological advancements enhancing efficiency and performance.
Key Challenges:
- Intermittency of solar energy and the need for energy storage solutions.
- Land use constraints and potential environmental impacts of large-scale solar farms.
- Supply chain disruptions and potential material shortages.
- Regulatory uncertainties and permitting complexities. Permitting delays can add xx million USD to project costs.
Emerging Opportunities in U.S. Solar Power Industry
- Growing demand for community solar projects and shared solar ownership models.
- Increased integration of solar energy with building-integrated photovoltaics (BIPV).
- Expanding applications of solar energy in agriculture, transportation, and industrial processes.
- Development of innovative financing models to facilitate solar adoption.
Growth Accelerators in the U.S. Solar Power Industry
Technological breakthroughs, particularly in battery storage and grid integration technologies, will be crucial in driving long-term growth. Strategic partnerships between solar developers, energy storage providers, and utilities will accelerate market expansion. Further expansion into underserved markets, coupled with the adoption of innovative business models, will unlock substantial growth opportunities. The continued development of advanced solar panel technology will lead to further cost reductions and improved efficiency, accelerating market penetration.
Key Players Shaping the U.S. Solar Power Industry Market
- JinkoSolar Holding Co Ltd
- First Solar Inc
- SOLV Energy
- NextEra Energy Inc
- SunPower Corporation
- Rosendin Electric Inc
- 8minute Solar Energy
- Canadian Solar Inc
- Renewable Energy Systems Ltd
- M A Mortenson Company
- Hanwha Corporation
Notable Milestones in U.S. Solar Power Industry Sector
- April 2023: Atlas Renewable Energy and Albras signed a PPA for the 902 MW Vista Alegre Photovoltaic Project in Brazil, showcasing the global reach of U.S. solar technology expertise.
- April 2023: Masdar's acquisition of a 50% stake in the 128MW Big Beau solar and battery storage project highlights the growing importance of energy storage solutions.
- March 2023: Duke Energy's operation of the Pisgah Ridge Solar facility and its VPPA with Charles River Laboratories demonstrates the increasing adoption of virtual power purchase agreements.
In-Depth U.S. Solar Power Industry Market Outlook
The U.S. solar power market is poised for significant growth over the next decade, driven by a confluence of factors including declining costs, supportive government policies, and increasing environmental awareness. Continued technological innovation, particularly in areas such as energy storage and grid integration, will be critical in unlocking the full potential of solar energy. Strategic partnerships and market expansion into underserved regions will further accelerate market growth, leading to a substantial increase in solar energy capacity and a significant contribution to the nation's clean energy goals.
U.S. Solar Power Industry Segmentation
-
1. Type
- 1.1. Solar Photovoltaic (PV)
- 1.2. Concentrated Solar Power (CSP)
U.S. Solar Power Industry Segmentation By Geography
- 1. U.S.
U.S. Solar Power Industry REPORT HIGHLIGHTS
| Aspects | Details |
|---|---|
| Study Period | 2019-2033 |
| Base Year | 2024 |
| Estimated Year | 2025 |
| Forecast Period | 2025-2033 |
| Historical Period | 2019-2024 |
| Growth Rate | CAGR of 16.48% from 2019-2033 |
| Segmentation |
|
Table of Contents
- 1. Introduction
- 1.1. Research Scope
- 1.2. Market Segmentation
- 1.3. Research Methodology
- 1.4. Definitions and Assumptions
- 2. Executive Summary
- 2.1. Introduction
- 3. Market Dynamics
- 3.1. Introduction
- 3.2. Market Drivers
- 3.2.1. Declining Costs and Increasing Efficiencies of Solar PV Panels 4.; Supportive Government Policies Towards Solar
- 3.3. Market Restrains
- 3.3.1. Increasing Adoption of Alternative Clean Energy Sources and Increasing Natural Gas Consumption
- 3.4. Market Trends
- 3.4.1. Solar Photovoltaic (PV) Expected to Dominate the Market
- 4. Market Factor Analysis
- 4.1. Porters Five Forces
- 4.2. Supply/Value Chain
- 4.3. PESTEL analysis
- 4.4. Market Entropy
- 4.5. Patent/Trademark Analysis
- 5. U.S. Solar Power Industry Analysis, Insights and Forecast, 2019-2031
- 5.1. Market Analysis, Insights and Forecast - by Type
- 5.1.1. Solar Photovoltaic (PV)
- 5.1.2. Concentrated Solar Power (CSP)
- 5.2. Market Analysis, Insights and Forecast - by Region
- 5.2.1. U.S.
- 5.1. Market Analysis, Insights and Forecast - by Type
- 6. Northeast U.S. Solar Power Industry Analysis, Insights and Forecast, 2019-2031
- 7. Southeast U.S. Solar Power Industry Analysis, Insights and Forecast, 2019-2031
- 8. Midwest U.S. Solar Power Industry Analysis, Insights and Forecast, 2019-2031
- 9. Southwest U.S. Solar Power Industry Analysis, Insights and Forecast, 2019-2031
- 10. West U.S. Solar Power Industry Analysis, Insights and Forecast, 2019-2031
- 11. Competitive Analysis
- 11.1. Market Share Analysis 2024
- 11.2. Company Profiles
- 11.2.1 JinkoSolar Holding Co Ltd
- 11.2.1.1. Overview
- 11.2.1.2. Products
- 11.2.1.3. SWOT Analysis
- 11.2.1.4. Recent Developments
- 11.2.1.5. Financials (Based on Availability)
- 11.2.2 First Solar Inc
- 11.2.2.1. Overview
- 11.2.2.2. Products
- 11.2.2.3. SWOT Analysis
- 11.2.2.4. Recent Developments
- 11.2.2.5. Financials (Based on Availability)
- 11.2.3 SOLV Energy
- 11.2.3.1. Overview
- 11.2.3.2. Products
- 11.2.3.3. SWOT Analysis
- 11.2.3.4. Recent Developments
- 11.2.3.5. Financials (Based on Availability)
- 11.2.4 NextEra Energy Inc
- 11.2.4.1. Overview
- 11.2.4.2. Products
- 11.2.4.3. SWOT Analysis
- 11.2.4.4. Recent Developments
- 11.2.4.5. Financials (Based on Availability)
- 11.2.5 SunPower Corporation
- 11.2.5.1. Overview
- 11.2.5.2. Products
- 11.2.5.3. SWOT Analysis
- 11.2.5.4. Recent Developments
- 11.2.5.5. Financials (Based on Availability)
- 11.2.6 Rosendin Electric Inc
- 11.2.6.1. Overview
- 11.2.6.2. Products
- 11.2.6.3. SWOT Analysis
- 11.2.6.4. Recent Developments
- 11.2.6.5. Financials (Based on Availability)
- 11.2.7 8minute Solar Energy
- 11.2.7.1. Overview
- 11.2.7.2. Products
- 11.2.7.3. SWOT Analysis
- 11.2.7.4. Recent Developments
- 11.2.7.5. Financials (Based on Availability)
- 11.2.8 Canadian Solar Inc
- 11.2.8.1. Overview
- 11.2.8.2. Products
- 11.2.8.3. SWOT Analysis
- 11.2.8.4. Recent Developments
- 11.2.8.5. Financials (Based on Availability)
- 11.2.9 Renewable Energy Systems Ltd
- 11.2.9.1. Overview
- 11.2.9.2. Products
- 11.2.9.3. SWOT Analysis
- 11.2.9.4. Recent Developments
- 11.2.9.5. Financials (Based on Availability)
- 11.2.10 M A Mortenson Company
- 11.2.10.1. Overview
- 11.2.10.2. Products
- 11.2.10.3. SWOT Analysis
- 11.2.10.4. Recent Developments
- 11.2.10.5. Financials (Based on Availability)
- 11.2.11 Hanwha Corporation
- 11.2.11.1. Overview
- 11.2.11.2. Products
- 11.2.11.3. SWOT Analysis
- 11.2.11.4. Recent Developments
- 11.2.11.5. Financials (Based on Availability)
- 11.2.1 JinkoSolar Holding Co Ltd
List of Figures
- Figure 1: U.S. Solar Power Industry Revenue Breakdown (Million, %) by Product 2024 & 2032
- Figure 2: U.S. Solar Power Industry Share (%) by Company 2024
List of Tables
- Table 1: U.S. Solar Power Industry Revenue Million Forecast, by Region 2019 & 2032
- Table 2: U.S. Solar Power Industry Volume Gigawatt Forecast, by Region 2019 & 2032
- Table 3: U.S. Solar Power Industry Revenue Million Forecast, by Type 2019 & 2032
- Table 4: U.S. Solar Power Industry Volume Gigawatt Forecast, by Type 2019 & 2032
- Table 5: U.S. Solar Power Industry Revenue Million Forecast, by Region 2019 & 2032
- Table 6: U.S. Solar Power Industry Volume Gigawatt Forecast, by Region 2019 & 2032
- Table 7: U.S. Solar Power Industry Revenue Million Forecast, by Country 2019 & 2032
- Table 8: U.S. Solar Power Industry Volume Gigawatt Forecast, by Country 2019 & 2032
- Table 9: Northeast U.S. Solar Power Industry Revenue (Million) Forecast, by Application 2019 & 2032
- Table 10: Northeast U.S. Solar Power Industry Volume (Gigawatt) Forecast, by Application 2019 & 2032
- Table 11: Southeast U.S. Solar Power Industry Revenue (Million) Forecast, by Application 2019 & 2032
- Table 12: Southeast U.S. Solar Power Industry Volume (Gigawatt) Forecast, by Application 2019 & 2032
- Table 13: Midwest U.S. Solar Power Industry Revenue (Million) Forecast, by Application 2019 & 2032
- Table 14: Midwest U.S. Solar Power Industry Volume (Gigawatt) Forecast, by Application 2019 & 2032
- Table 15: Southwest U.S. Solar Power Industry Revenue (Million) Forecast, by Application 2019 & 2032
- Table 16: Southwest U.S. Solar Power Industry Volume (Gigawatt) Forecast, by Application 2019 & 2032
- Table 17: West U.S. Solar Power Industry Revenue (Million) Forecast, by Application 2019 & 2032
- Table 18: West U.S. Solar Power Industry Volume (Gigawatt) Forecast, by Application 2019 & 2032
- Table 19: U.S. Solar Power Industry Revenue Million Forecast, by Type 2019 & 2032
- Table 20: U.S. Solar Power Industry Volume Gigawatt Forecast, by Type 2019 & 2032
- Table 21: U.S. Solar Power Industry Revenue Million Forecast, by Country 2019 & 2032
- Table 22: U.S. Solar Power Industry Volume Gigawatt Forecast, by Country 2019 & 2032
Frequently Asked Questions
1. What is the projected Compound Annual Growth Rate (CAGR) of the U.S. Solar Power Industry?
The projected CAGR is approximately 16.48%.
2. Which companies are prominent players in the U.S. Solar Power Industry?
Key companies in the market include JinkoSolar Holding Co Ltd, First Solar Inc, SOLV Energy, NextEra Energy Inc, SunPower Corporation, Rosendin Electric Inc, 8minute Solar Energy, Canadian Solar Inc, Renewable Energy Systems Ltd, M A Mortenson Company, Hanwha Corporation.
3. What are the main segments of the U.S. Solar Power Industry?
The market segments include Type.
4. Can you provide details about the market size?
The market size is estimated to be USD XX Million as of 2022.
5. What are some drivers contributing to market growth?
Declining Costs and Increasing Efficiencies of Solar PV Panels 4.; Supportive Government Policies Towards Solar.
6. What are the notable trends driving market growth?
Solar Photovoltaic (PV) Expected to Dominate the Market.
7. Are there any restraints impacting market growth?
Increasing Adoption of Alternative Clean Energy Sources and Increasing Natural Gas Consumption.
8. Can you provide examples of recent developments in the market?
April 2023: Atlas Renewable Energy and Albras signed a solar power purchase agreement (PPA). Atlas will deliver solar-generated power to Albras for the next 21 years under the contract terms. The 902 MW Vista Alegre Photovoltaic Project will supply solar energy. The factory in Minas Gerais in Southeastern Brazil will begin operations in 2025.
9. What pricing options are available for accessing the report?
Pricing options include single-user, multi-user, and enterprise licenses priced at USD 3800, USD 4500, and USD 5800 respectively.
10. Is the market size provided in terms of value or volume?
The market size is provided in terms of value, measured in Million and volume, measured in Gigawatt.
11. Are there any specific market keywords associated with the report?
Yes, the market keyword associated with the report is "U.S. Solar Power Industry," which aids in identifying and referencing the specific market segment covered.
12. How do I determine which pricing option suits my needs best?
The pricing options vary based on user requirements and access needs. Individual users may opt for single-user licenses, while businesses requiring broader access may choose multi-user or enterprise licenses for cost-effective access to the report.
13. Are there any additional resources or data provided in the U.S. Solar Power Industry report?
While the report offers comprehensive insights, it's advisable to review the specific contents or supplementary materials provided to ascertain if additional resources or data are available.
14. How can I stay updated on further developments or reports in the U.S. Solar Power Industry?
To stay informed about further developments, trends, and reports in the U.S. Solar Power Industry, consider subscribing to industry newsletters, following relevant companies and organizations, or regularly checking reputable industry news sources and publications.
Methodology
Step 1 - Identification of Relevant Samples Size from Population Database


Step 2 - Approaches for Defining Global Market Size (Value, Volume* & Price*)

Note*: In applicable scenarios
Step 3 - Data Sources
Primary Research
- Web Analytics
- Survey Reports
- Research Institute
- Latest Research Reports
- Opinion Leaders
Secondary Research
- Annual Reports
- White Paper
- Latest Press Release
- Industry Association
- Paid Database
- Investor Presentations

Step 4 - Data Triangulation
Involves using different sources of information in order to increase the validity of a study
These sources are likely to be stakeholders in a program - participants, other researchers, program staff, other community members, and so on.
Then we put all data in single framework & apply various statistical tools to find out the dynamic on the market.
During the analysis stage, feedback from the stakeholder groups would be compared to determine areas of agreement as well as areas of divergence
