

Key Insights
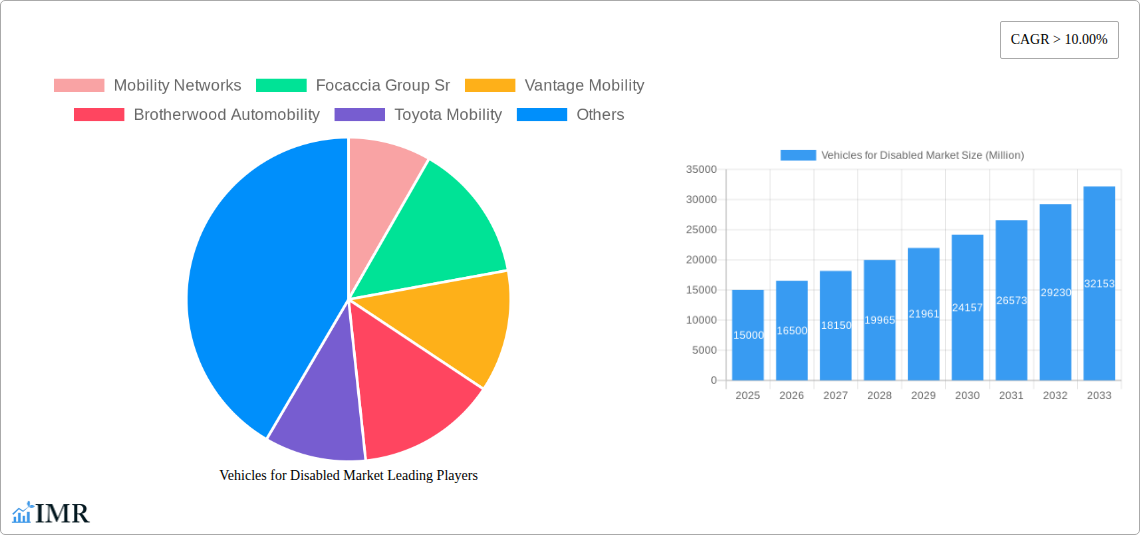
The global market for vehicles for disabled individuals is experiencing robust growth, driven by a rising elderly population, increasing awareness of accessibility needs, and advancements in assistive technologies. The market, valued at approximately $15 billion in 2025, is projected to maintain a Compound Annual Growth Rate (CAGR) exceeding 10% through 2033. This expansion is fueled by several key factors. Firstly, technological innovations are leading to more sophisticated and comfortable vehicles, including features like swivel seats, wheelchair lifts, and customized entry configurations (side or rear). Secondly, supportive government regulations and initiatives aimed at promoting accessibility are creating a more favorable market environment. Finally, increasing disposable incomes in developing economies, particularly in Asia-Pacific, are contributing to higher demand for these specialized vehicles.
Market segmentation reveals a strong preference for four-wheelers, driven by greater safety and space compared to two-wheelers. Within vehicle configurations, swivel seats are gaining popularity due to their ease of use, while side entry configurations maintain a larger market share than rear entry due to wider applicability across vehicle types. Key players such as Mobility Networks, Toyota Mobility, and Pride Mobility are actively shaping the market landscape through innovation, strategic partnerships, and expanding global reach. However, high initial costs and limited affordability in certain regions remain challenges to market penetration, along with ongoing regulatory hurdles in some countries. Despite these constraints, the long-term outlook for the vehicles for disabled market remains highly positive, driven by sustained technological advancements and a growing societal focus on inclusivity.
Vehicles for Disabled Market: A Comprehensive Report (2019-2033)
This in-depth report provides a comprehensive analysis of the Vehicles for Disabled Market, encompassing market dynamics, growth trends, regional analysis, product landscape, key players, and future outlook. The study period covers 2019-2033, with a focus on the forecast period 2025-2033, using 2025 as the base and estimated year. The report segments the market by vehicle type (two-wheeler, four-wheeler), driving option (swivel seat, wheelchair, normal seat), and entry configuration (side entry, rear entry), offering granular insights into this vital sector. Market size is presented in million units.
Vehicles for Disabled Market Market Dynamics & Structure
The Vehicles for Disabled market is characterized by a moderately fragmented structure, with several key players competing alongside smaller, specialized manufacturers. Market concentration is expected to slightly increase by 2033 due to M&A activity and the consolidation of smaller players. Technological innovation, particularly in areas like adaptive driving systems and advanced accessibility features, is a significant driver. Stringent regulatory frameworks concerning vehicle safety and accessibility standards vary across regions, creating both challenges and opportunities. The market also faces competition from alternative mobility solutions such as public transportation and ride-sharing services adapted for disabled individuals. End-user demographics are expanding, with an aging global population and increased awareness of accessibility needs driving growth. The past five years have witnessed a moderate number of M&A deals (xx), primarily focused on expanding product portfolios and geographic reach.
- Market Concentration: Moderately fragmented (2025), trending toward slight consolidation (2033)
- Technological Innovation: Key driver; focus on automation, AI-assisted driving, and improved accessibility features.
- Regulatory Framework: Significant influence; varies regionally, creating market-specific opportunities and challenges.
- Competitive Substitutes: Public transport, adapted ride-sharing services, and other assistive mobility devices.
- End-User Demographics: Aging population and increased awareness of disability accessibility are primary growth factors.
- M&A Activity: Moderate deal volume (xx) observed in the historical period (2019-2024), with projections of a similar trend for the forecast period.
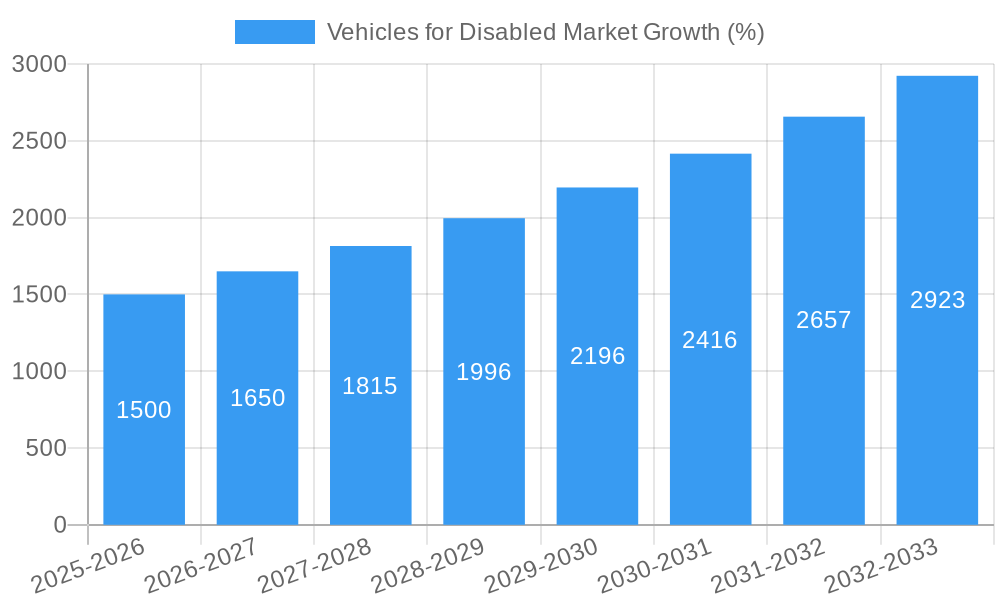
Vehicles for Disabled Market Growth Trends & Insights
The Vehicles for Disabled market experienced steady growth during the historical period (2019-2024), with a CAGR of xx%. This growth is primarily driven by increasing awareness and acceptance of accessibility needs, coupled with technological advancements that improve the quality and affordability of adapted vehicles. The market is expected to continue its growth trajectory during the forecast period (2025-2033), with a projected CAGR of xx%, fueled by factors like government initiatives promoting accessibility, rising disposable incomes in developing economies, and the development of more sophisticated and user-friendly vehicle adaptations. Technological disruptions, such as the introduction of electric and autonomous driving technologies, are poised to significantly reshape the market landscape. Consumer behavior is shifting towards greater demand for customized solutions and personalized accessibility features. Market penetration remains relatively low, particularly in developing countries, indicating significant untapped potential for growth.
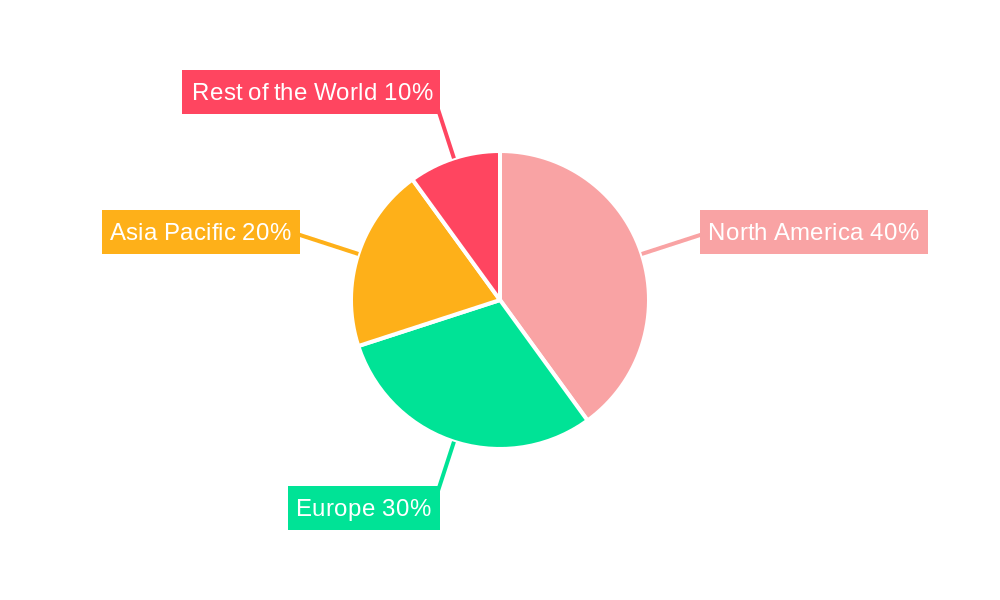
Dominant Regions, Countries, or Segments in Vehicles for Disabled Market
North America currently dominates the Vehicles for Disabled market, driven by strong regulatory frameworks, high disposable incomes, and a large elderly population. Europe also holds a significant market share, boosted by robust social welfare programs and a focus on accessibility. However, the Asia-Pacific region demonstrates the most significant growth potential, fueled by rapid economic development and a burgeoning middle class. Within segments, four-wheelers currently dominate due to greater adaptability and safety features. However, the two-wheeler segment is expected to show robust growth, particularly in developing countries where cost is a primary concern. The swivel seat and wheelchair adaptations are the leading driving options, while side-entry vehicles enjoy a higher market share.
- North America: High market share; driven by strong regulatory support and high disposable incomes.
- Europe: Substantial market share; strong social welfare programs are key drivers.
- Asia-Pacific: Highest growth potential; fueled by economic growth and expanding middle class.
- Vehicle Type: Four-wheelers currently dominate; two-wheelers display high growth potential.
- Driving Option: Swivel seats and wheelchair adaptations lead the market.
- Entry Configuration: Side-entry configurations currently hold a larger market share.
Vehicles for Disabled Market Product Landscape
The Vehicles for Disabled market showcases a diverse product landscape, encompassing a wide range of vehicle adaptations designed to cater to specific needs. Innovations include advanced driving aids, such as adaptive cruise control and lane-keeping assist, enhancing safety and driver independence. Electric and hybrid powertrains are increasingly integrated, improving environmental sustainability and reducing running costs. Performance metrics focus on user-friendliness, safety, and ease of access. Unique selling propositions often revolve around advanced technology features, personalized customization options, and exceptional customer service. Recent advancements highlight the integration of IoT technology for remote diagnostics and monitoring.
Key Drivers, Barriers & Challenges in Vehicles for Disabled Market
Key Drivers: Rising disposable incomes, increasing awareness of accessibility issues, technological advancements (e.g., autonomous driving, electric powertrains), supportive government regulations (e.g., tax incentives for adaptive vehicles), and a growing elderly population.
Key Challenges and Restraints: High initial costs of adapted vehicles present a significant barrier to market penetration. Supply chain disruptions can impact production and availability. Regulatory inconsistencies across regions can complicate product development and market access. Competition from substitute mobility solutions and the need for ongoing maintenance and repairs also pose challenges. The overall impact of these challenges is estimated to reduce the overall market growth by approximately xx% during the forecast period.
Emerging Opportunities in Vehicles for Disabled Market
The market presents significant opportunities in untapped markets, particularly in developing countries. Innovative applications, such as connected car technologies and advanced assistive driving systems, offer substantial growth potential. Evolving consumer preferences towards customized and personalized mobility solutions create niche market opportunities. The integration of artificial intelligence (AI) and machine learning (ML) for enhanced accessibility features presents a significant area for innovation.
Growth Accelerators in the Vehicles for Disabled Market Industry
Technological breakthroughs in adaptive driving technologies and assistive features are key growth catalysts. Strategic partnerships between vehicle manufacturers, technology providers, and disability advocacy groups can foster market expansion. Government incentives, such as subsidies and tax breaks, significantly accelerate adoption rates. Expansion into new markets, particularly in developing countries, presents a high-growth opportunity.
Key Players Shaping the Vehicles for Disabled Market Market
- Mobility Networks
- Focaccia Group Sr
- Vantage Mobility
- Brotherwood Automobility
- Toyota Mobility
- Revability
- Pride Mobility
- Electric Mobility Euro
- AMS Vans LLC
- GM Coachwork
Notable Milestones in Vehicles for Disabled Market Sector
- 2020: Introduction of the first fully autonomous wheelchair-accessible vehicle by [Company Name].
- 2022: A major merger between two leading manufacturers expands market reach in Europe.
- 2023: Launch of a new line of affordable electric wheelchairs with advanced safety features.
- 2024: Significant policy changes in [country] incentivize the purchase of adaptive vehicles.
In-Depth Vehicles for Disabled Market Market Outlook
The Vehicles for Disabled market is poised for significant growth in the coming years, driven by technological innovation, supportive government policies, and a growing awareness of accessibility needs. Strategic opportunities lie in the development of customized solutions, expansion into emerging markets, and the integration of advanced technologies. The market is expected to witness a substantial increase in market size and adoption rates, particularly in the Asia-Pacific region. The focus on sustainability and electric powertrains will further shape the market landscape.
Vehicles for Disabled Market Segmentation
-
1. Vehicle Type
- 1.1. Two-Wheeler
- 1.2. Four Wheeler
-
2. Driving Option
- 2.1. Swivel Seat
- 2.2. WheelChair
- 2.3. Normal Seat
-
3. Entry Configuration
- 3.1. Side Entry
- 3.2. Rear Entry
Vehicles for Disabled Market Segmentation By Geography
-
1. North America
- 1.1. United States
- 1.2. Canada
-
2. Europe
- 2.1. Germany
- 2.2. United Kingdom
- 2.3. France
- 2.4. Rest of Europe
-
3. Asia Pacific
- 3.1. India
- 3.2. China
- 3.3. Japan
- 3.4. South Korea
- 3.5. Rest of Asia Pacific
-
4. Rest of the World
- 4.1. Brazil
- 4.2. United Arab Emirates
- 4.3. Other Countries
Vehicles for Disabled Market REPORT HIGHLIGHTS
| Aspects | Details |
|---|---|
| Study Period | 2019-2033 |
| Base Year | 2024 |
| Estimated Year | 2025 |
| Forecast Period | 2025-2033 |
| Historical Period | 2019-2024 |
| Growth Rate | CAGR of > 10.00% from 2019-2033 |
| Segmentation |
|
Table of Contents
- 1. Introduction
- 1.1. Research Scope
- 1.2. Market Segmentation
- 1.3. Research Methodology
- 1.4. Definitions and Assumptions
- 2. Executive Summary
- 2.1. Introduction
- 3. Market Dynamics
- 3.1. Introduction
- 3.2. Market Drivers
- 3.2.1. Expanding Warehousing and Logistics Sector to Foster the Growth of the Market
- 3.3. Market Restrains
- 3.3.1. High Initial Purchase Cost to Hamper the Growth of the Market
- 3.4. Market Trends
- 3.4.1. Two-Wheeler Segment is expected to be the Market Leader
- 4. Market Factor Analysis
- 4.1. Porters Five Forces
- 4.2. Supply/Value Chain
- 4.3. PESTEL analysis
- 4.4. Market Entropy
- 4.5. Patent/Trademark Analysis
- 5. Global Vehicles for Disabled Market Analysis, Insights and Forecast, 2019-2031
- 5.1. Market Analysis, Insights and Forecast - by Vehicle Type
- 5.1.1. Two-Wheeler
- 5.1.2. Four Wheeler
- 5.2. Market Analysis, Insights and Forecast - by Driving Option
- 5.2.1. Swivel Seat
- 5.2.2. WheelChair
- 5.2.3. Normal Seat
- 5.3. Market Analysis, Insights and Forecast - by Entry Configuration
- 5.3.1. Side Entry
- 5.3.2. Rear Entry
- 5.4. Market Analysis, Insights and Forecast - by Region
- 5.4.1. North America
- 5.4.2. Europe
- 5.4.3. Asia Pacific
- 5.4.4. Rest of the World
- 5.1. Market Analysis, Insights and Forecast - by Vehicle Type
- 6. North America Vehicles for Disabled Market Analysis, Insights and Forecast, 2019-2031
- 6.1. Market Analysis, Insights and Forecast - by Vehicle Type
- 6.1.1. Two-Wheeler
- 6.1.2. Four Wheeler
- 6.2. Market Analysis, Insights and Forecast - by Driving Option
- 6.2.1. Swivel Seat
- 6.2.2. WheelChair
- 6.2.3. Normal Seat
- 6.3. Market Analysis, Insights and Forecast - by Entry Configuration
- 6.3.1. Side Entry
- 6.3.2. Rear Entry
- 6.1. Market Analysis, Insights and Forecast - by Vehicle Type
- 7. Europe Vehicles for Disabled Market Analysis, Insights and Forecast, 2019-2031
- 7.1. Market Analysis, Insights and Forecast - by Vehicle Type
- 7.1.1. Two-Wheeler
- 7.1.2. Four Wheeler
- 7.2. Market Analysis, Insights and Forecast - by Driving Option
- 7.2.1. Swivel Seat
- 7.2.2. WheelChair
- 7.2.3. Normal Seat
- 7.3. Market Analysis, Insights and Forecast - by Entry Configuration
- 7.3.1. Side Entry
- 7.3.2. Rear Entry
- 7.1. Market Analysis, Insights and Forecast - by Vehicle Type
- 8. Asia Pacific Vehicles for Disabled Market Analysis, Insights and Forecast, 2019-2031
- 8.1. Market Analysis, Insights and Forecast - by Vehicle Type
- 8.1.1. Two-Wheeler
- 8.1.2. Four Wheeler
- 8.2. Market Analysis, Insights and Forecast - by Driving Option
- 8.2.1. Swivel Seat
- 8.2.2. WheelChair
- 8.2.3. Normal Seat
- 8.3. Market Analysis, Insights and Forecast - by Entry Configuration
- 8.3.1. Side Entry
- 8.3.2. Rear Entry
- 8.1. Market Analysis, Insights and Forecast - by Vehicle Type
- 9. Rest of the World Vehicles for Disabled Market Analysis, Insights and Forecast, 2019-2031
- 9.1. Market Analysis, Insights and Forecast - by Vehicle Type
- 9.1.1. Two-Wheeler
- 9.1.2. Four Wheeler
- 9.2. Market Analysis, Insights and Forecast - by Driving Option
- 9.2.1. Swivel Seat
- 9.2.2. WheelChair
- 9.2.3. Normal Seat
- 9.3. Market Analysis, Insights and Forecast - by Entry Configuration
- 9.3.1. Side Entry
- 9.3.2. Rear Entry
- 9.1. Market Analysis, Insights and Forecast - by Vehicle Type
- 10. North America Vehicles for Disabled Market Analysis, Insights and Forecast, 2019-2031
- 10.1. Market Analysis, Insights and Forecast - By Country/Sub-region
- 10.1.1 United States
- 10.1.2 Canada
- 11. Europe Vehicles for Disabled Market Analysis, Insights and Forecast, 2019-2031
- 11.1. Market Analysis, Insights and Forecast - By Country/Sub-region
- 11.1.1 Germany
- 11.1.2 United Kingdom
- 11.1.3 France
- 11.1.4 Rest of Europe
- 12. Asia Pacific Vehicles for Disabled Market Analysis, Insights and Forecast, 2019-2031
- 12.1. Market Analysis, Insights and Forecast - By Country/Sub-region
- 12.1.1 India
- 12.1.2 China
- 12.1.3 Japan
- 12.1.4 South Korea
- 12.1.5 Rest of Asia Pacific
- 13. Rest of the World Vehicles for Disabled Market Analysis, Insights and Forecast, 2019-2031
- 13.1. Market Analysis, Insights and Forecast - By Country/Sub-region
- 13.1.1 Brazil
- 13.1.2 United Arab Emirates
- 13.1.3 Other Countries
- 14. Competitive Analysis
- 14.1. Global Market Share Analysis 2024
- 14.2. Company Profiles
- 14.2.1 Mobility Networks
- 14.2.1.1. Overview
- 14.2.1.2. Products
- 14.2.1.3. SWOT Analysis
- 14.2.1.4. Recent Developments
- 14.2.1.5. Financials (Based on Availability)
- 14.2.2 Focaccia Group Sr
- 14.2.2.1. Overview
- 14.2.2.2. Products
- 14.2.2.3. SWOT Analysis
- 14.2.2.4. Recent Developments
- 14.2.2.5. Financials (Based on Availability)
- 14.2.3 Vantage Mobility
- 14.2.3.1. Overview
- 14.2.3.2. Products
- 14.2.3.3. SWOT Analysis
- 14.2.3.4. Recent Developments
- 14.2.3.5. Financials (Based on Availability)
- 14.2.4 Brotherwood Automobility
- 14.2.4.1. Overview
- 14.2.4.2. Products
- 14.2.4.3. SWOT Analysis
- 14.2.4.4. Recent Developments
- 14.2.4.5. Financials (Based on Availability)
- 14.2.5 Toyota Mobility
- 14.2.5.1. Overview
- 14.2.5.2. Products
- 14.2.5.3. SWOT Analysis
- 14.2.5.4. Recent Developments
- 14.2.5.5. Financials (Based on Availability)
- 14.2.6 Revability
- 14.2.6.1. Overview
- 14.2.6.2. Products
- 14.2.6.3. SWOT Analysis
- 14.2.6.4. Recent Developments
- 14.2.6.5. Financials (Based on Availability)
- 14.2.7 Pride Mobility
- 14.2.7.1. Overview
- 14.2.7.2. Products
- 14.2.7.3. SWOT Analysis
- 14.2.7.4. Recent Developments
- 14.2.7.5. Financials (Based on Availability)
- 14.2.8 Electric Mobility Euro
- 14.2.8.1. Overview
- 14.2.8.2. Products
- 14.2.8.3. SWOT Analysis
- 14.2.8.4. Recent Developments
- 14.2.8.5. Financials (Based on Availability)
- 14.2.9 AMS Vans LLC
- 14.2.9.1. Overview
- 14.2.9.2. Products
- 14.2.9.3. SWOT Analysis
- 14.2.9.4. Recent Developments
- 14.2.9.5. Financials (Based on Availability)
- 14.2.10 GM Coachwork
- 14.2.10.1. Overview
- 14.2.10.2. Products
- 14.2.10.3. SWOT Analysis
- 14.2.10.4. Recent Developments
- 14.2.10.5. Financials (Based on Availability)
- 14.2.1 Mobility Networks
List of Figures
- Figure 1: Global Vehicles for Disabled Market Revenue Breakdown (Million, %) by Region 2024 & 2032
- Figure 2: North America Vehicles for Disabled Market Revenue (Million), by Country 2024 & 2032
- Figure 3: North America Vehicles for Disabled Market Revenue Share (%), by Country 2024 & 2032
- Figure 4: Europe Vehicles for Disabled Market Revenue (Million), by Country 2024 & 2032
- Figure 5: Europe Vehicles for Disabled Market Revenue Share (%), by Country 2024 & 2032
- Figure 6: Asia Pacific Vehicles for Disabled Market Revenue (Million), by Country 2024 & 2032
- Figure 7: Asia Pacific Vehicles for Disabled Market Revenue Share (%), by Country 2024 & 2032
- Figure 8: Rest of the World Vehicles for Disabled Market Revenue (Million), by Country 2024 & 2032
- Figure 9: Rest of the World Vehicles for Disabled Market Revenue Share (%), by Country 2024 & 2032
- Figure 10: North America Vehicles for Disabled Market Revenue (Million), by Vehicle Type 2024 & 2032
- Figure 11: North America Vehicles for Disabled Market Revenue Share (%), by Vehicle Type 2024 & 2032
- Figure 12: North America Vehicles for Disabled Market Revenue (Million), by Driving Option 2024 & 2032
- Figure 13: North America Vehicles for Disabled Market Revenue Share (%), by Driving Option 2024 & 2032
- Figure 14: North America Vehicles for Disabled Market Revenue (Million), by Entry Configuration 2024 & 2032
- Figure 15: North America Vehicles for Disabled Market Revenue Share (%), by Entry Configuration 2024 & 2032
- Figure 16: North America Vehicles for Disabled Market Revenue (Million), by Country 2024 & 2032
- Figure 17: North America Vehicles for Disabled Market Revenue Share (%), by Country 2024 & 2032
- Figure 18: Europe Vehicles for Disabled Market Revenue (Million), by Vehicle Type 2024 & 2032
- Figure 19: Europe Vehicles for Disabled Market Revenue Share (%), by Vehicle Type 2024 & 2032
- Figure 20: Europe Vehicles for Disabled Market Revenue (Million), by Driving Option 2024 & 2032
- Figure 21: Europe Vehicles for Disabled Market Revenue Share (%), by Driving Option 2024 & 2032
- Figure 22: Europe Vehicles for Disabled Market Revenue (Million), by Entry Configuration 2024 & 2032
- Figure 23: Europe Vehicles for Disabled Market Revenue Share (%), by Entry Configuration 2024 & 2032
- Figure 24: Europe Vehicles for Disabled Market Revenue (Million), by Country 2024 & 2032
- Figure 25: Europe Vehicles for Disabled Market Revenue Share (%), by Country 2024 & 2032
- Figure 26: Asia Pacific Vehicles for Disabled Market Revenue (Million), by Vehicle Type 2024 & 2032
- Figure 27: Asia Pacific Vehicles for Disabled Market Revenue Share (%), by Vehicle Type 2024 & 2032
- Figure 28: Asia Pacific Vehicles for Disabled Market Revenue (Million), by Driving Option 2024 & 2032
- Figure 29: Asia Pacific Vehicles for Disabled Market Revenue Share (%), by Driving Option 2024 & 2032
- Figure 30: Asia Pacific Vehicles for Disabled Market Revenue (Million), by Entry Configuration 2024 & 2032
- Figure 31: Asia Pacific Vehicles for Disabled Market Revenue Share (%), by Entry Configuration 2024 & 2032
- Figure 32: Asia Pacific Vehicles for Disabled Market Revenue (Million), by Country 2024 & 2032
- Figure 33: Asia Pacific Vehicles for Disabled Market Revenue Share (%), by Country 2024 & 2032
- Figure 34: Rest of the World Vehicles for Disabled Market Revenue (Million), by Vehicle Type 2024 & 2032
- Figure 35: Rest of the World Vehicles for Disabled Market Revenue Share (%), by Vehicle Type 2024 & 2032
- Figure 36: Rest of the World Vehicles for Disabled Market Revenue (Million), by Driving Option 2024 & 2032
- Figure 37: Rest of the World Vehicles for Disabled Market Revenue Share (%), by Driving Option 2024 & 2032
- Figure 38: Rest of the World Vehicles for Disabled Market Revenue (Million), by Entry Configuration 2024 & 2032
- Figure 39: Rest of the World Vehicles for Disabled Market Revenue Share (%), by Entry Configuration 2024 & 2032
- Figure 40: Rest of the World Vehicles for Disabled Market Revenue (Million), by Country 2024 & 2032
- Figure 41: Rest of the World Vehicles for Disabled Market Revenue Share (%), by Country 2024 & 2032
List of Tables
- Table 1: Global Vehicles for Disabled Market Revenue Million Forecast, by Region 2019 & 2032
- Table 2: Global Vehicles for Disabled Market Revenue Million Forecast, by Vehicle Type 2019 & 2032
- Table 3: Global Vehicles for Disabled Market Revenue Million Forecast, by Driving Option 2019 & 2032
- Table 4: Global Vehicles for Disabled Market Revenue Million Forecast, by Entry Configuration 2019 & 2032
- Table 5: Global Vehicles for Disabled Market Revenue Million Forecast, by Region 2019 & 2032
- Table 6: Global Vehicles for Disabled Market Revenue Million Forecast, by Country 2019 & 2032
- Table 7: United States Vehicles for Disabled Market Revenue (Million) Forecast, by Application 2019 & 2032
- Table 8: Canada Vehicles for Disabled Market Revenue (Million) Forecast, by Application 2019 & 2032
- Table 9: Global Vehicles for Disabled Market Revenue Million Forecast, by Country 2019 & 2032
- Table 10: Germany Vehicles for Disabled Market Revenue (Million) Forecast, by Application 2019 & 2032
- Table 11: United Kingdom Vehicles for Disabled Market Revenue (Million) Forecast, by Application 2019 & 2032
- Table 12: France Vehicles for Disabled Market Revenue (Million) Forecast, by Application 2019 & 2032
- Table 13: Rest of Europe Vehicles for Disabled Market Revenue (Million) Forecast, by Application 2019 & 2032
- Table 14: Global Vehicles for Disabled Market Revenue Million Forecast, by Country 2019 & 2032
- Table 15: India Vehicles for Disabled Market Revenue (Million) Forecast, by Application 2019 & 2032
- Table 16: China Vehicles for Disabled Market Revenue (Million) Forecast, by Application 2019 & 2032
- Table 17: Japan Vehicles for Disabled Market Revenue (Million) Forecast, by Application 2019 & 2032
- Table 18: South Korea Vehicles for Disabled Market Revenue (Million) Forecast, by Application 2019 & 2032
- Table 19: Rest of Asia Pacific Vehicles for Disabled Market Revenue (Million) Forecast, by Application 2019 & 2032
- Table 20: Global Vehicles for Disabled Market Revenue Million Forecast, by Country 2019 & 2032
- Table 21: Brazil Vehicles for Disabled Market Revenue (Million) Forecast, by Application 2019 & 2032
- Table 22: United Arab Emirates Vehicles for Disabled Market Revenue (Million) Forecast, by Application 2019 & 2032
- Table 23: Other Countries Vehicles for Disabled Market Revenue (Million) Forecast, by Application 2019 & 2032
- Table 24: Global Vehicles for Disabled Market Revenue Million Forecast, by Vehicle Type 2019 & 2032
- Table 25: Global Vehicles for Disabled Market Revenue Million Forecast, by Driving Option 2019 & 2032
- Table 26: Global Vehicles for Disabled Market Revenue Million Forecast, by Entry Configuration 2019 & 2032
- Table 27: Global Vehicles for Disabled Market Revenue Million Forecast, by Country 2019 & 2032
- Table 28: United States Vehicles for Disabled Market Revenue (Million) Forecast, by Application 2019 & 2032
- Table 29: Canada Vehicles for Disabled Market Revenue (Million) Forecast, by Application 2019 & 2032
- Table 30: Global Vehicles for Disabled Market Revenue Million Forecast, by Vehicle Type 2019 & 2032
- Table 31: Global Vehicles for Disabled Market Revenue Million Forecast, by Driving Option 2019 & 2032
- Table 32: Global Vehicles for Disabled Market Revenue Million Forecast, by Entry Configuration 2019 & 2032
- Table 33: Global Vehicles for Disabled Market Revenue Million Forecast, by Country 2019 & 2032
- Table 34: Germany Vehicles for Disabled Market Revenue (Million) Forecast, by Application 2019 & 2032
- Table 35: United Kingdom Vehicles for Disabled Market Revenue (Million) Forecast, by Application 2019 & 2032
- Table 36: France Vehicles for Disabled Market Revenue (Million) Forecast, by Application 2019 & 2032
- Table 37: Rest of Europe Vehicles for Disabled Market Revenue (Million) Forecast, by Application 2019 & 2032
- Table 38: Global Vehicles for Disabled Market Revenue Million Forecast, by Vehicle Type 2019 & 2032
- Table 39: Global Vehicles for Disabled Market Revenue Million Forecast, by Driving Option 2019 & 2032
- Table 40: Global Vehicles for Disabled Market Revenue Million Forecast, by Entry Configuration 2019 & 2032
- Table 41: Global Vehicles for Disabled Market Revenue Million Forecast, by Country 2019 & 2032
- Table 42: India Vehicles for Disabled Market Revenue (Million) Forecast, by Application 2019 & 2032
- Table 43: China Vehicles for Disabled Market Revenue (Million) Forecast, by Application 2019 & 2032
- Table 44: Japan Vehicles for Disabled Market Revenue (Million) Forecast, by Application 2019 & 2032
- Table 45: South Korea Vehicles for Disabled Market Revenue (Million) Forecast, by Application 2019 & 2032
- Table 46: Rest of Asia Pacific Vehicles for Disabled Market Revenue (Million) Forecast, by Application 2019 & 2032
- Table 47: Global Vehicles for Disabled Market Revenue Million Forecast, by Vehicle Type 2019 & 2032
- Table 48: Global Vehicles for Disabled Market Revenue Million Forecast, by Driving Option 2019 & 2032
- Table 49: Global Vehicles for Disabled Market Revenue Million Forecast, by Entry Configuration 2019 & 2032
- Table 50: Global Vehicles for Disabled Market Revenue Million Forecast, by Country 2019 & 2032
- Table 51: Brazil Vehicles for Disabled Market Revenue (Million) Forecast, by Application 2019 & 2032
- Table 52: United Arab Emirates Vehicles for Disabled Market Revenue (Million) Forecast, by Application 2019 & 2032
- Table 53: Other Countries Vehicles for Disabled Market Revenue (Million) Forecast, by Application 2019 & 2032
Frequently Asked Questions
1. What is the projected Compound Annual Growth Rate (CAGR) of the Vehicles for Disabled Market?
The projected CAGR is approximately > 10.00%.
2. Which companies are prominent players in the Vehicles for Disabled Market?
Key companies in the market include Mobility Networks, Focaccia Group Sr, Vantage Mobility, Brotherwood Automobility, Toyota Mobility, Revability, Pride Mobility, Electric Mobility Euro, AMS Vans LLC, GM Coachwork.
3. What are the main segments of the Vehicles for Disabled Market?
The market segments include Vehicle Type, Driving Option, Entry Configuration.
4. Can you provide details about the market size?
The market size is estimated to be USD XX Million as of 2022.
5. What are some drivers contributing to market growth?
Expanding Warehousing and Logistics Sector to Foster the Growth of the Market.
6. What are the notable trends driving market growth?
Two-Wheeler Segment is expected to be the Market Leader.
7. Are there any restraints impacting market growth?
High Initial Purchase Cost to Hamper the Growth of the Market.
8. Can you provide examples of recent developments in the market?
N/A
9. What pricing options are available for accessing the report?
Pricing options include single-user, multi-user, and enterprise licenses priced at USD 4750, USD 5250, and USD 8750 respectively.
10. Is the market size provided in terms of value or volume?
The market size is provided in terms of value, measured in Million.
11. Are there any specific market keywords associated with the report?
Yes, the market keyword associated with the report is "Vehicles for Disabled Market," which aids in identifying and referencing the specific market segment covered.
12. How do I determine which pricing option suits my needs best?
The pricing options vary based on user requirements and access needs. Individual users may opt for single-user licenses, while businesses requiring broader access may choose multi-user or enterprise licenses for cost-effective access to the report.
13. Are there any additional resources or data provided in the Vehicles for Disabled Market report?
While the report offers comprehensive insights, it's advisable to review the specific contents or supplementary materials provided to ascertain if additional resources or data are available.
14. How can I stay updated on further developments or reports in the Vehicles for Disabled Market?
To stay informed about further developments, trends, and reports in the Vehicles for Disabled Market, consider subscribing to industry newsletters, following relevant companies and organizations, or regularly checking reputable industry news sources and publications.
Methodology
Step 1 - Identification of Relevant Samples Size from Population Database


Step 2 - Approaches for Defining Global Market Size (Value, Volume* & Price*)

Note*: In applicable scenarios
Step 3 - Data Sources
Primary Research
- Web Analytics
- Survey Reports
- Research Institute
- Latest Research Reports
- Opinion Leaders
Secondary Research
- Annual Reports
- White Paper
- Latest Press Release
- Industry Association
- Paid Database
- Investor Presentations

Step 4 - Data Triangulation
Involves using different sources of information in order to increase the validity of a study
These sources are likely to be stakeholders in a program - participants, other researchers, program staff, other community members, and so on.
Then we put all data in single framework & apply various statistical tools to find out the dynamic on the market.
During the analysis stage, feedback from the stakeholder groups would be compared to determine areas of agreement as well as areas of divergence
