

Key Insights
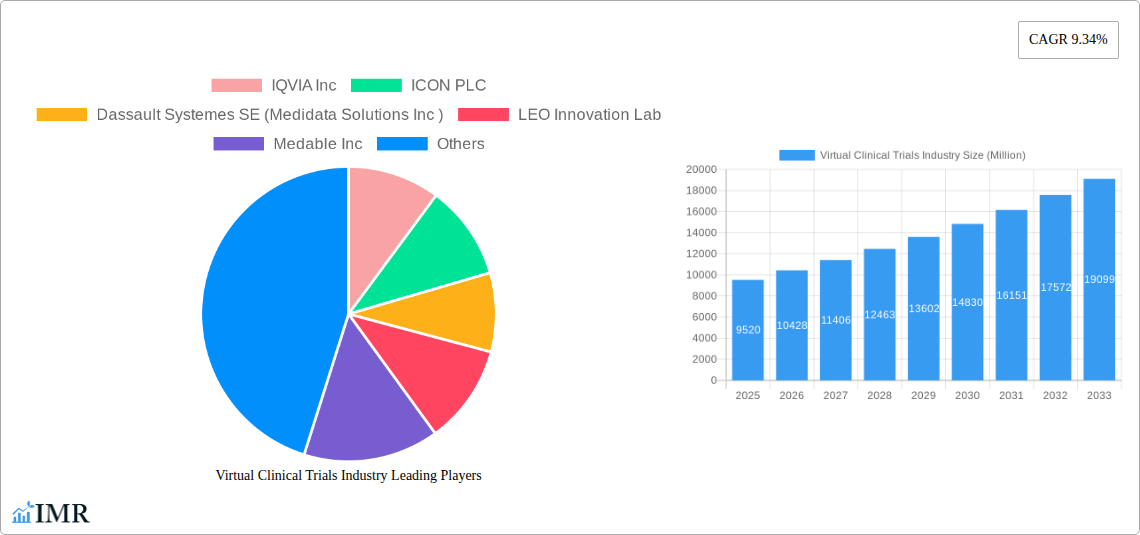
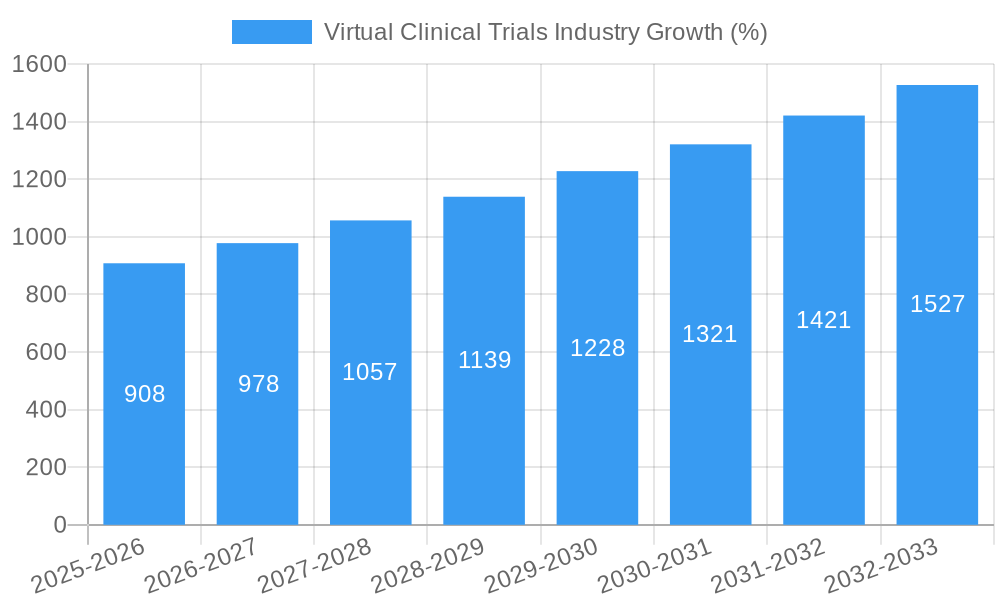
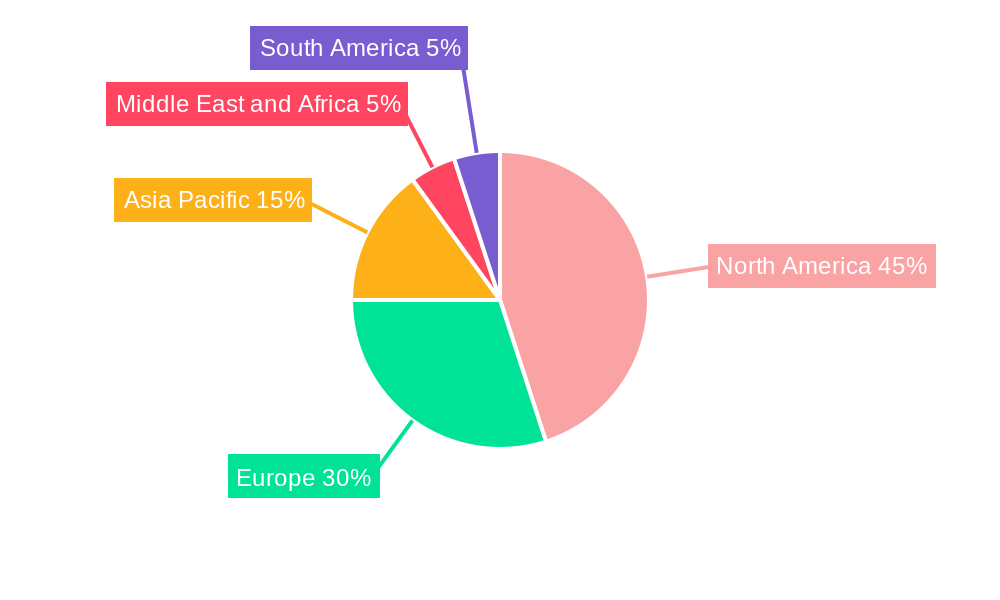
The virtual clinical trials (VCT) market is experiencing robust growth, projected to reach a substantial size driven by technological advancements and evolving healthcare needs. The market's Compound Annual Growth Rate (CAGR) of 9.34% from 2019 to 2033 indicates a significant expansion, fueled by factors such as reduced costs associated with traditional physical trials, accelerated trial timelines, enhanced patient access and engagement, and the increasing adoption of digital health technologies. The market segmentation reveals strong growth across various study designs, with interventional trials leading the charge followed by observational studies and expanded access programs. Cardiovascular disease and oncology indications currently dominate the indication-type segment, reflecting high unmet needs in these therapeutic areas. Leading companies like IQVIA, ICON, and Dassault Systèmes (Medidata Solutions) are driving innovation and market penetration through their comprehensive platforms and services. Geographical distribution shows North America and Europe currently holding significant market shares due to established regulatory frameworks and higher technological adoption rates, but the Asia-Pacific region is expected to witness substantial growth in the coming years due to increasing investments in healthcare infrastructure and growing awareness of VCT benefits. The market is further bolstered by a growing pool of tech-savvy patients who are comfortable participating in remote clinical trials.
The sustained growth of the VCT market is anticipated to continue, propelled by ongoing technological enhancements, including artificial intelligence (AI) and machine learning applications for data analysis and patient recruitment. Regulatory support and increasing acceptance of VCTs are also key drivers. However, challenges remain, such as ensuring data security and patient privacy, maintaining data integrity across decentralized locations, and addressing potential digital literacy disparities among participants. Overcoming these hurdles will be critical for realizing the full potential of VCTs and ensuring equitable access to these innovative clinical trial models. The expanding adoption of hybrid models, which blend virtual and in-person components, is expected to address some of these challenges, creating a more robust and efficient clinical trial ecosystem.
Virtual Clinical Trials Industry: A Comprehensive Market Report (2019-2033)
This in-depth report provides a comprehensive analysis of the Virtual Clinical Trials industry, encompassing market dynamics, growth trends, regional segmentation, product landscape, key players, and future outlook. The study covers the period 2019-2033, with a focus on the estimated year 2025 and a forecast period of 2025-2033. The report leverages extensive primary and secondary research to deliver actionable insights for industry professionals, investors, and stakeholders. The market is segmented by Study Design (Observational, Interventional, Expanded Access) and Indication Type (Cardiovascular Disease, Oncology, Other Indication Types). The total market size is projected to reach xx Million by 2033.
Virtual Clinical Trials Industry Market Dynamics & Structure
The virtual clinical trials market is experiencing rapid growth, driven by technological advancements, increasing demand for cost-effective and efficient clinical research, and regulatory support. Market concentration is moderately high, with a few large players dominating the landscape, while numerous smaller companies focus on niche areas. Technological innovation is a key driver, with advancements in telehealth, wearable sensors, and data analytics enabling remote patient monitoring and data collection. Regulatory frameworks are evolving to accommodate the unique aspects of virtual trials, though harmonization across different geographies remains a challenge. Competitive product substitutes are limited, with the primary alternative being traditional, in-person clinical trials, which are significantly more expensive and time-consuming. The end-user demographics include pharmaceutical and biotechnology companies, contract research organizations (CROs), and academic research institutions. M&A activity has been significant, with larger companies acquiring smaller firms to expand their technological capabilities and service offerings. The number of M&A deals in the period 2019-2024 was estimated at xx, with a total value of xx Million.
- Market Concentration: Moderately high, with top 5 players holding approximately xx% market share in 2025.
- Technological Innovation: AI, machine learning, and blockchain technologies are transforming data analysis and security.
- Regulatory Landscape: Evolving but fragmented across global regions, posing challenges for standardization.
- M&A Activity: Significant consolidation expected, driving further market concentration.
- Innovation Barriers: High initial investment costs, data privacy concerns, and ensuring patient engagement.
Virtual Clinical Trials Industry Growth Trends & Insights
The virtual clinical trials market exhibited strong growth during the historical period (2019-2024), fueled by the increasing adoption of telehealth technologies and a growing focus on reducing the time and cost associated with traditional clinical trials. The market is expected to continue this trajectory, with a Compound Annual Growth Rate (CAGR) of xx% during the forecast period (2025-2033). This growth is driven by several factors, including increasing demand for faster and more efficient clinical research, growing adoption of remote patient monitoring technologies, and the development of new regulatory frameworks that support virtual clinical trials. Technological disruptions, such as the rise of AI-powered data analytics and the increasing use of wearable sensors, are further accelerating market expansion. Consumer behavior shifts, including increased comfort with using technology for healthcare, are also contributing to market growth. Market penetration is currently estimated at xx% in 2025 and is projected to reach xx% by 2033.
Dominant Regions, Countries, or Segments in Virtual Clinical Trials Industry
North America holds the largest market share in the virtual clinical trials industry, driven by factors such as high adoption rates of technology, robust healthcare infrastructure, and supportive regulatory environment. Within North America, the United States is the dominant country. The Interventional study design segment holds the largest market share, followed by Observational studies. Oncology and Cardiovascular Disease are the leading indication types driving market growth, reflecting the high prevalence of these diseases and the need for efficient clinical trials to accelerate drug development.
- North America: High technology adoption, advanced infrastructure, and strong regulatory support.
- Europe: Growing adoption, driven by increased investment in healthcare technology.
- Asia-Pacific: Rapid growth potential, but challenges remain regarding infrastructure and regulatory frameworks.
- Interventional Studies: Largest segment due to the need for efficient and cost-effective drug development.
- Oncology & Cardiovascular Disease: Largest indication types, reflecting high disease prevalence and clinical trial demand.
Virtual Clinical Trials Industry Product Landscape
The virtual clinical trials product landscape encompasses a diverse range of software, hardware, and services designed to support remote patient monitoring, data collection, and data analysis. These include electronic data capture (EDC) systems, telehealth platforms, wearable sensors, and data analytics tools. Key features include secure data storage, real-time data visualization, and robust integration capabilities. Technological advancements, such as the integration of AI and machine learning, are enhancing the efficiency and accuracy of data analysis. Unique selling propositions focus on improved patient engagement, reduced costs, and accelerated drug development timelines.
Key Drivers, Barriers & Challenges in Virtual Clinical Trials Industry
Key Drivers:
- Technological advancements in telehealth, data analytics, and wearable sensors.
- Increasing demand for faster and more cost-effective clinical trials.
- Growing regulatory support for virtual clinical trials.
- Rising prevalence of chronic diseases.
Challenges and Restraints:
- Data security and privacy concerns, potentially impacting xx Million in annual revenue by 2030.
- Ensuring patient engagement and compliance.
- Lack of standardization and harmonization across regulatory frameworks.
- High upfront investment costs for technology and infrastructure.
Emerging Opportunities in Virtual Clinical Trials Industry
- Expansion into emerging markets with significant unmet medical needs.
- Development of new applications for virtual clinical trials, such as decentralized clinical trials (DCTs).
- Integration of virtual reality (VR) and augmented reality (AR) technologies to enhance patient engagement.
- Increased focus on patient-centric designs and personalized medicine.
Growth Accelerators in the Virtual Clinical Trials Industry Industry
Strategic partnerships between technology companies, pharmaceutical firms, and CROs are accelerating market growth. Technological advancements in areas such as AI, machine learning, and blockchain are enhancing data analysis capabilities and security, reducing operational inefficiencies, and minimizing costs. Market expansion into underserved regions, coupled with the development of innovative applications like decentralized trials, is driving industry progress and adoption.
Key Players Shaping the Virtual Clinical Trials Industry Market
- IQVIA Inc
- ICON PLC
- Dassault Systemes SE (Medidata Solutions Inc)
- LEO Innovation Lab
- Medable Inc
- Parexel International Corporation
- Oracle Corporation
- Signant Health
- Clinical Ink Inc
- Medpace Holdings Inc
- Laboratory Corporation of America Holdings (Covance Inc)
Notable Milestones in Virtual Clinical Trials Industry Sector
- 2020: Increased adoption of virtual trials due to the COVID-19 pandemic.
- 2021: Several key regulatory approvals for virtual trial methodologies.
- 2022: Significant investments in AI and machine learning for virtual trial applications.
- 2023: Launch of several new platforms and services focused on patient engagement.
In-Depth Virtual Clinical Trials Industry Market Outlook
The virtual clinical trials market is poised for sustained growth, driven by ongoing technological innovations, increasing regulatory support, and a growing demand for efficient and cost-effective clinical research. Strategic partnerships, focused investments in technology development, and successful penetration into emerging markets will further stimulate market expansion. The market is expected to witness a significant increase in the adoption of decentralized clinical trials (DCTs) and the utilization of AI-powered data analytics, fueling further growth and efficiency improvements across the industry.
Virtual Clinical Trials Industry Segmentation
-
1. Study Design
- 1.1. Observational
- 1.2. Intervensional
- 1.3. Expanded Access
-
2. Indication Type
- 2.1. Cardiovascular Disease
- 2.2. Oncology
- 2.3. Other Indication Types
Virtual Clinical Trials Industry Segmentation By Geography
-
1. North America
- 1.1. United States
- 1.2. Canada
- 1.3. Mexico
-
2. Europe
- 2.1. Germany
- 2.2. United Kingdom
- 2.3. France
- 2.4. Italy
- 2.5. Spain
- 2.6. Rest of Europe
-
3. Asia Pacific
- 3.1. China
- 3.2. Japan
- 3.3. India
- 3.4. Australia
- 3.5. South Korea
- 3.6. Rest of Asia Pacific
-
4. Middle East and Africa
- 4.1. GCC
- 4.2. South Africa
- 4.3. Rest of Middle East and Africa
-
5. South America
- 5.1. Brazil
- 5.2. Argentina
- 5.3. Rest of South America
Virtual Clinical Trials Industry REPORT HIGHLIGHTS
| Aspects | Details |
|---|---|
| Study Period | 2019-2033 |
| Base Year | 2024 |
| Estimated Year | 2025 |
| Forecast Period | 2025-2033 |
| Historical Period | 2019-2024 |
| Growth Rate | CAGR of 9.34% from 2019-2033 |
| Segmentation |
|
Table of Contents
- 1. Introduction
- 1.1. Research Scope
- 1.2. Market Segmentation
- 1.3. Research Methodology
- 1.4. Definitions and Assumptions
- 2. Executive Summary
- 2.1. Introduction
- 3. Market Dynamics
- 3.1. Introduction
- 3.2. Market Drivers
- 3.2.1. Growing Digitization in Healthcare Sector; Technological Advancements in Virtual Clinical Trials; Prevalence of Chronic Disease
- 3.3. Market Restrains
- 3.3.1. Challenges Associated with the Virtual Clinical Trials
- 3.4. Market Trends
- 3.4.1. The Oncology Segment is Expected to Occupy a Significant Share of the Market Over the Forecast Period
- 4. Market Factor Analysis
- 4.1. Porters Five Forces
- 4.2. Supply/Value Chain
- 4.3. PESTEL analysis
- 4.4. Market Entropy
- 4.5. Patent/Trademark Analysis
- 5. Global Virtual Clinical Trials Industry Analysis, Insights and Forecast, 2019-2031
- 5.1. Market Analysis, Insights and Forecast - by Study Design
- 5.1.1. Observational
- 5.1.2. Intervensional
- 5.1.3. Expanded Access
- 5.2. Market Analysis, Insights and Forecast - by Indication Type
- 5.2.1. Cardiovascular Disease
- 5.2.2. Oncology
- 5.2.3. Other Indication Types
- 5.3. Market Analysis, Insights and Forecast - by Region
- 5.3.1. North America
- 5.3.2. Europe
- 5.3.3. Asia Pacific
- 5.3.4. Middle East and Africa
- 5.3.5. South America
- 5.1. Market Analysis, Insights and Forecast - by Study Design
- 6. North America Virtual Clinical Trials Industry Analysis, Insights and Forecast, 2019-2031
- 6.1. Market Analysis, Insights and Forecast - by Study Design
- 6.1.1. Observational
- 6.1.2. Intervensional
- 6.1.3. Expanded Access
- 6.2. Market Analysis, Insights and Forecast - by Indication Type
- 6.2.1. Cardiovascular Disease
- 6.2.2. Oncology
- 6.2.3. Other Indication Types
- 6.1. Market Analysis, Insights and Forecast - by Study Design
- 7. Europe Virtual Clinical Trials Industry Analysis, Insights and Forecast, 2019-2031
- 7.1. Market Analysis, Insights and Forecast - by Study Design
- 7.1.1. Observational
- 7.1.2. Intervensional
- 7.1.3. Expanded Access
- 7.2. Market Analysis, Insights and Forecast - by Indication Type
- 7.2.1. Cardiovascular Disease
- 7.2.2. Oncology
- 7.2.3. Other Indication Types
- 7.1. Market Analysis, Insights and Forecast - by Study Design
- 8. Asia Pacific Virtual Clinical Trials Industry Analysis, Insights and Forecast, 2019-2031
- 8.1. Market Analysis, Insights and Forecast - by Study Design
- 8.1.1. Observational
- 8.1.2. Intervensional
- 8.1.3. Expanded Access
- 8.2. Market Analysis, Insights and Forecast - by Indication Type
- 8.2.1. Cardiovascular Disease
- 8.2.2. Oncology
- 8.2.3. Other Indication Types
- 8.1. Market Analysis, Insights and Forecast - by Study Design
- 9. Middle East and Africa Virtual Clinical Trials Industry Analysis, Insights and Forecast, 2019-2031
- 9.1. Market Analysis, Insights and Forecast - by Study Design
- 9.1.1. Observational
- 9.1.2. Intervensional
- 9.1.3. Expanded Access
- 9.2. Market Analysis, Insights and Forecast - by Indication Type
- 9.2.1. Cardiovascular Disease
- 9.2.2. Oncology
- 9.2.3. Other Indication Types
- 9.1. Market Analysis, Insights and Forecast - by Study Design
- 10. South America Virtual Clinical Trials Industry Analysis, Insights and Forecast, 2019-2031
- 10.1. Market Analysis, Insights and Forecast - by Study Design
- 10.1.1. Observational
- 10.1.2. Intervensional
- 10.1.3. Expanded Access
- 10.2. Market Analysis, Insights and Forecast - by Indication Type
- 10.2.1. Cardiovascular Disease
- 10.2.2. Oncology
- 10.2.3. Other Indication Types
- 10.1. Market Analysis, Insights and Forecast - by Study Design
- 11. North America Virtual Clinical Trials Industry Analysis, Insights and Forecast, 2019-2031
- 11.1. Market Analysis, Insights and Forecast - By Country/Sub-region
- 11.1.1 United States
- 11.1.2 Canada
- 11.1.3 Mexico
- 12. Europe Virtual Clinical Trials Industry Analysis, Insights and Forecast, 2019-2031
- 12.1. Market Analysis, Insights and Forecast - By Country/Sub-region
- 12.1.1 Germany
- 12.1.2 United Kingdom
- 12.1.3 France
- 12.1.4 Italy
- 12.1.5 Spain
- 12.1.6 Rest of Europe
- 13. Asia Pacific Virtual Clinical Trials Industry Analysis, Insights and Forecast, 2019-2031
- 13.1. Market Analysis, Insights and Forecast - By Country/Sub-region
- 13.1.1 China
- 13.1.2 Japan
- 13.1.3 India
- 13.1.4 Australia
- 13.1.5 South Korea
- 13.1.6 Rest of Asia Pacific
- 14. Middle East and Africa Virtual Clinical Trials Industry Analysis, Insights and Forecast, 2019-2031
- 14.1. Market Analysis, Insights and Forecast - By Country/Sub-region
- 14.1.1 GCC
- 14.1.2 South Africa
- 14.1.3 Rest of Middle East and Africa
- 15. South America Virtual Clinical Trials Industry Analysis, Insights and Forecast, 2019-2031
- 15.1. Market Analysis, Insights and Forecast - By Country/Sub-region
- 15.1.1 Brazil
- 15.1.2 Argentina
- 15.1.3 Rest of South America
- 16. Competitive Analysis
- 16.1. Global Market Share Analysis 2024
- 16.2. Company Profiles
- 16.2.1 IQVIA Inc
- 16.2.1.1. Overview
- 16.2.1.2. Products
- 16.2.1.3. SWOT Analysis
- 16.2.1.4. Recent Developments
- 16.2.1.5. Financials (Based on Availability)
- 16.2.2 ICON PLC
- 16.2.2.1. Overview
- 16.2.2.2. Products
- 16.2.2.3. SWOT Analysis
- 16.2.2.4. Recent Developments
- 16.2.2.5. Financials (Based on Availability)
- 16.2.3 Dassault Systemes SE (Medidata Solutions Inc )
- 16.2.3.1. Overview
- 16.2.3.2. Products
- 16.2.3.3. SWOT Analysis
- 16.2.3.4. Recent Developments
- 16.2.3.5. Financials (Based on Availability)
- 16.2.4 LEO Innovation Lab
- 16.2.4.1. Overview
- 16.2.4.2. Products
- 16.2.4.3. SWOT Analysis
- 16.2.4.4. Recent Developments
- 16.2.4.5. Financials (Based on Availability)
- 16.2.5 Medable Inc
- 16.2.5.1. Overview
- 16.2.5.2. Products
- 16.2.5.3. SWOT Analysis
- 16.2.5.4. Recent Developments
- 16.2.5.5. Financials (Based on Availability)
- 16.2.6 Parexel International Corporation
- 16.2.6.1. Overview
- 16.2.6.2. Products
- 16.2.6.3. SWOT Analysis
- 16.2.6.4. Recent Developments
- 16.2.6.5. Financials (Based on Availability)
- 16.2.7 Oracle Corporation
- 16.2.7.1. Overview
- 16.2.7.2. Products
- 16.2.7.3. SWOT Analysis
- 16.2.7.4. Recent Developments
- 16.2.7.5. Financials (Based on Availability)
- 16.2.8 Signant Health
- 16.2.8.1. Overview
- 16.2.8.2. Products
- 16.2.8.3. SWOT Analysis
- 16.2.8.4. Recent Developments
- 16.2.8.5. Financials (Based on Availability)
- 16.2.9 Clinical Ink Inc
- 16.2.9.1. Overview
- 16.2.9.2. Products
- 16.2.9.3. SWOT Analysis
- 16.2.9.4. Recent Developments
- 16.2.9.5. Financials (Based on Availability)
- 16.2.10 Medpace Holdings Inc
- 16.2.10.1. Overview
- 16.2.10.2. Products
- 16.2.10.3. SWOT Analysis
- 16.2.10.4. Recent Developments
- 16.2.10.5. Financials (Based on Availability)
- 16.2.11 Laboratory Corporation of America Holdings (Covance Inc )
- 16.2.11.1. Overview
- 16.2.11.2. Products
- 16.2.11.3. SWOT Analysis
- 16.2.11.4. Recent Developments
- 16.2.11.5. Financials (Based on Availability)
- 16.2.1 IQVIA Inc
List of Figures
- Figure 1: Global Virtual Clinical Trials Industry Revenue Breakdown (Million, %) by Region 2024 & 2032
- Figure 2: North America Virtual Clinical Trials Industry Revenue (Million), by Country 2024 & 2032
- Figure 3: North America Virtual Clinical Trials Industry Revenue Share (%), by Country 2024 & 2032
- Figure 4: Europe Virtual Clinical Trials Industry Revenue (Million), by Country 2024 & 2032
- Figure 5: Europe Virtual Clinical Trials Industry Revenue Share (%), by Country 2024 & 2032
- Figure 6: Asia Pacific Virtual Clinical Trials Industry Revenue (Million), by Country 2024 & 2032
- Figure 7: Asia Pacific Virtual Clinical Trials Industry Revenue Share (%), by Country 2024 & 2032
- Figure 8: Middle East and Africa Virtual Clinical Trials Industry Revenue (Million), by Country 2024 & 2032
- Figure 9: Middle East and Africa Virtual Clinical Trials Industry Revenue Share (%), by Country 2024 & 2032
- Figure 10: South America Virtual Clinical Trials Industry Revenue (Million), by Country 2024 & 2032
- Figure 11: South America Virtual Clinical Trials Industry Revenue Share (%), by Country 2024 & 2032
- Figure 12: North America Virtual Clinical Trials Industry Revenue (Million), by Study Design 2024 & 2032
- Figure 13: North America Virtual Clinical Trials Industry Revenue Share (%), by Study Design 2024 & 2032
- Figure 14: North America Virtual Clinical Trials Industry Revenue (Million), by Indication Type 2024 & 2032
- Figure 15: North America Virtual Clinical Trials Industry Revenue Share (%), by Indication Type 2024 & 2032
- Figure 16: North America Virtual Clinical Trials Industry Revenue (Million), by Country 2024 & 2032
- Figure 17: North America Virtual Clinical Trials Industry Revenue Share (%), by Country 2024 & 2032
- Figure 18: Europe Virtual Clinical Trials Industry Revenue (Million), by Study Design 2024 & 2032
- Figure 19: Europe Virtual Clinical Trials Industry Revenue Share (%), by Study Design 2024 & 2032
- Figure 20: Europe Virtual Clinical Trials Industry Revenue (Million), by Indication Type 2024 & 2032
- Figure 21: Europe Virtual Clinical Trials Industry Revenue Share (%), by Indication Type 2024 & 2032
- Figure 22: Europe Virtual Clinical Trials Industry Revenue (Million), by Country 2024 & 2032
- Figure 23: Europe Virtual Clinical Trials Industry Revenue Share (%), by Country 2024 & 2032
- Figure 24: Asia Pacific Virtual Clinical Trials Industry Revenue (Million), by Study Design 2024 & 2032
- Figure 25: Asia Pacific Virtual Clinical Trials Industry Revenue Share (%), by Study Design 2024 & 2032
- Figure 26: Asia Pacific Virtual Clinical Trials Industry Revenue (Million), by Indication Type 2024 & 2032
- Figure 27: Asia Pacific Virtual Clinical Trials Industry Revenue Share (%), by Indication Type 2024 & 2032
- Figure 28: Asia Pacific Virtual Clinical Trials Industry Revenue (Million), by Country 2024 & 2032
- Figure 29: Asia Pacific Virtual Clinical Trials Industry Revenue Share (%), by Country 2024 & 2032
- Figure 30: Middle East and Africa Virtual Clinical Trials Industry Revenue (Million), by Study Design 2024 & 2032
- Figure 31: Middle East and Africa Virtual Clinical Trials Industry Revenue Share (%), by Study Design 2024 & 2032
- Figure 32: Middle East and Africa Virtual Clinical Trials Industry Revenue (Million), by Indication Type 2024 & 2032
- Figure 33: Middle East and Africa Virtual Clinical Trials Industry Revenue Share (%), by Indication Type 2024 & 2032
- Figure 34: Middle East and Africa Virtual Clinical Trials Industry Revenue (Million), by Country 2024 & 2032
- Figure 35: Middle East and Africa Virtual Clinical Trials Industry Revenue Share (%), by Country 2024 & 2032
- Figure 36: South America Virtual Clinical Trials Industry Revenue (Million), by Study Design 2024 & 2032
- Figure 37: South America Virtual Clinical Trials Industry Revenue Share (%), by Study Design 2024 & 2032
- Figure 38: South America Virtual Clinical Trials Industry Revenue (Million), by Indication Type 2024 & 2032
- Figure 39: South America Virtual Clinical Trials Industry Revenue Share (%), by Indication Type 2024 & 2032
- Figure 40: South America Virtual Clinical Trials Industry Revenue (Million), by Country 2024 & 2032
- Figure 41: South America Virtual Clinical Trials Industry Revenue Share (%), by Country 2024 & 2032
List of Tables
- Table 1: Global Virtual Clinical Trials Industry Revenue Million Forecast, by Region 2019 & 2032
- Table 2: Global Virtual Clinical Trials Industry Revenue Million Forecast, by Study Design 2019 & 2032
- Table 3: Global Virtual Clinical Trials Industry Revenue Million Forecast, by Indication Type 2019 & 2032
- Table 4: Global Virtual Clinical Trials Industry Revenue Million Forecast, by Region 2019 & 2032
- Table 5: Global Virtual Clinical Trials Industry Revenue Million Forecast, by Country 2019 & 2032
- Table 6: United States Virtual Clinical Trials Industry Revenue (Million) Forecast, by Application 2019 & 2032
- Table 7: Canada Virtual Clinical Trials Industry Revenue (Million) Forecast, by Application 2019 & 2032
- Table 8: Mexico Virtual Clinical Trials Industry Revenue (Million) Forecast, by Application 2019 & 2032
- Table 9: Global Virtual Clinical Trials Industry Revenue Million Forecast, by Country 2019 & 2032
- Table 10: Germany Virtual Clinical Trials Industry Revenue (Million) Forecast, by Application 2019 & 2032
- Table 11: United Kingdom Virtual Clinical Trials Industry Revenue (Million) Forecast, by Application 2019 & 2032
- Table 12: France Virtual Clinical Trials Industry Revenue (Million) Forecast, by Application 2019 & 2032
- Table 13: Italy Virtual Clinical Trials Industry Revenue (Million) Forecast, by Application 2019 & 2032
- Table 14: Spain Virtual Clinical Trials Industry Revenue (Million) Forecast, by Application 2019 & 2032
- Table 15: Rest of Europe Virtual Clinical Trials Industry Revenue (Million) Forecast, by Application 2019 & 2032
- Table 16: Global Virtual Clinical Trials Industry Revenue Million Forecast, by Country 2019 & 2032
- Table 17: China Virtual Clinical Trials Industry Revenue (Million) Forecast, by Application 2019 & 2032
- Table 18: Japan Virtual Clinical Trials Industry Revenue (Million) Forecast, by Application 2019 & 2032
- Table 19: India Virtual Clinical Trials Industry Revenue (Million) Forecast, by Application 2019 & 2032
- Table 20: Australia Virtual Clinical Trials Industry Revenue (Million) Forecast, by Application 2019 & 2032
- Table 21: South Korea Virtual Clinical Trials Industry Revenue (Million) Forecast, by Application 2019 & 2032
- Table 22: Rest of Asia Pacific Virtual Clinical Trials Industry Revenue (Million) Forecast, by Application 2019 & 2032
- Table 23: Global Virtual Clinical Trials Industry Revenue Million Forecast, by Country 2019 & 2032
- Table 24: GCC Virtual Clinical Trials Industry Revenue (Million) Forecast, by Application 2019 & 2032
- Table 25: South Africa Virtual Clinical Trials Industry Revenue (Million) Forecast, by Application 2019 & 2032
- Table 26: Rest of Middle East and Africa Virtual Clinical Trials Industry Revenue (Million) Forecast, by Application 2019 & 2032
- Table 27: Global Virtual Clinical Trials Industry Revenue Million Forecast, by Country 2019 & 2032
- Table 28: Brazil Virtual Clinical Trials Industry Revenue (Million) Forecast, by Application 2019 & 2032
- Table 29: Argentina Virtual Clinical Trials Industry Revenue (Million) Forecast, by Application 2019 & 2032
- Table 30: Rest of South America Virtual Clinical Trials Industry Revenue (Million) Forecast, by Application 2019 & 2032
- Table 31: Global Virtual Clinical Trials Industry Revenue Million Forecast, by Study Design 2019 & 2032
- Table 32: Global Virtual Clinical Trials Industry Revenue Million Forecast, by Indication Type 2019 & 2032
- Table 33: Global Virtual Clinical Trials Industry Revenue Million Forecast, by Country 2019 & 2032
- Table 34: United States Virtual Clinical Trials Industry Revenue (Million) Forecast, by Application 2019 & 2032
- Table 35: Canada Virtual Clinical Trials Industry Revenue (Million) Forecast, by Application 2019 & 2032
- Table 36: Mexico Virtual Clinical Trials Industry Revenue (Million) Forecast, by Application 2019 & 2032
- Table 37: Global Virtual Clinical Trials Industry Revenue Million Forecast, by Study Design 2019 & 2032
- Table 38: Global Virtual Clinical Trials Industry Revenue Million Forecast, by Indication Type 2019 & 2032
- Table 39: Global Virtual Clinical Trials Industry Revenue Million Forecast, by Country 2019 & 2032
- Table 40: Germany Virtual Clinical Trials Industry Revenue (Million) Forecast, by Application 2019 & 2032
- Table 41: United Kingdom Virtual Clinical Trials Industry Revenue (Million) Forecast, by Application 2019 & 2032
- Table 42: France Virtual Clinical Trials Industry Revenue (Million) Forecast, by Application 2019 & 2032
- Table 43: Italy Virtual Clinical Trials Industry Revenue (Million) Forecast, by Application 2019 & 2032
- Table 44: Spain Virtual Clinical Trials Industry Revenue (Million) Forecast, by Application 2019 & 2032
- Table 45: Rest of Europe Virtual Clinical Trials Industry Revenue (Million) Forecast, by Application 2019 & 2032
- Table 46: Global Virtual Clinical Trials Industry Revenue Million Forecast, by Study Design 2019 & 2032
- Table 47: Global Virtual Clinical Trials Industry Revenue Million Forecast, by Indication Type 2019 & 2032
- Table 48: Global Virtual Clinical Trials Industry Revenue Million Forecast, by Country 2019 & 2032
- Table 49: China Virtual Clinical Trials Industry Revenue (Million) Forecast, by Application 2019 & 2032
- Table 50: Japan Virtual Clinical Trials Industry Revenue (Million) Forecast, by Application 2019 & 2032
- Table 51: India Virtual Clinical Trials Industry Revenue (Million) Forecast, by Application 2019 & 2032
- Table 52: Australia Virtual Clinical Trials Industry Revenue (Million) Forecast, by Application 2019 & 2032
- Table 53: South Korea Virtual Clinical Trials Industry Revenue (Million) Forecast, by Application 2019 & 2032
- Table 54: Rest of Asia Pacific Virtual Clinical Trials Industry Revenue (Million) Forecast, by Application 2019 & 2032
- Table 55: Global Virtual Clinical Trials Industry Revenue Million Forecast, by Study Design 2019 & 2032
- Table 56: Global Virtual Clinical Trials Industry Revenue Million Forecast, by Indication Type 2019 & 2032
- Table 57: Global Virtual Clinical Trials Industry Revenue Million Forecast, by Country 2019 & 2032
- Table 58: GCC Virtual Clinical Trials Industry Revenue (Million) Forecast, by Application 2019 & 2032
- Table 59: South Africa Virtual Clinical Trials Industry Revenue (Million) Forecast, by Application 2019 & 2032
- Table 60: Rest of Middle East and Africa Virtual Clinical Trials Industry Revenue (Million) Forecast, by Application 2019 & 2032
- Table 61: Global Virtual Clinical Trials Industry Revenue Million Forecast, by Study Design 2019 & 2032
- Table 62: Global Virtual Clinical Trials Industry Revenue Million Forecast, by Indication Type 2019 & 2032
- Table 63: Global Virtual Clinical Trials Industry Revenue Million Forecast, by Country 2019 & 2032
- Table 64: Brazil Virtual Clinical Trials Industry Revenue (Million) Forecast, by Application 2019 & 2032
- Table 65: Argentina Virtual Clinical Trials Industry Revenue (Million) Forecast, by Application 2019 & 2032
- Table 66: Rest of South America Virtual Clinical Trials Industry Revenue (Million) Forecast, by Application 2019 & 2032
Frequently Asked Questions
1. What is the projected Compound Annual Growth Rate (CAGR) of the Virtual Clinical Trials Industry?
The projected CAGR is approximately 9.34%.
2. Which companies are prominent players in the Virtual Clinical Trials Industry?
Key companies in the market include IQVIA Inc, ICON PLC, Dassault Systemes SE (Medidata Solutions Inc ), LEO Innovation Lab, Medable Inc, Parexel International Corporation, Oracle Corporation, Signant Health, Clinical Ink Inc, Medpace Holdings Inc, Laboratory Corporation of America Holdings (Covance Inc ).
3. What are the main segments of the Virtual Clinical Trials Industry?
The market segments include Study Design, Indication Type.
4. Can you provide details about the market size?
The market size is estimated to be USD 9.52 Million as of 2022.
5. What are some drivers contributing to market growth?
Growing Digitization in Healthcare Sector; Technological Advancements in Virtual Clinical Trials; Prevalence of Chronic Disease.
6. What are the notable trends driving market growth?
The Oncology Segment is Expected to Occupy a Significant Share of the Market Over the Forecast Period.
7. Are there any restraints impacting market growth?
Challenges Associated with the Virtual Clinical Trials.
8. Can you provide examples of recent developments in the market?
N/A
9. What pricing options are available for accessing the report?
Pricing options include single-user, multi-user, and enterprise licenses priced at USD 4750, USD 5250, and USD 8750 respectively.
10. Is the market size provided in terms of value or volume?
The market size is provided in terms of value, measured in Million.
11. Are there any specific market keywords associated with the report?
Yes, the market keyword associated with the report is "Virtual Clinical Trials Industry," which aids in identifying and referencing the specific market segment covered.
12. How do I determine which pricing option suits my needs best?
The pricing options vary based on user requirements and access needs. Individual users may opt for single-user licenses, while businesses requiring broader access may choose multi-user or enterprise licenses for cost-effective access to the report.
13. Are there any additional resources or data provided in the Virtual Clinical Trials Industry report?
While the report offers comprehensive insights, it's advisable to review the specific contents or supplementary materials provided to ascertain if additional resources or data are available.
14. How can I stay updated on further developments or reports in the Virtual Clinical Trials Industry?
To stay informed about further developments, trends, and reports in the Virtual Clinical Trials Industry, consider subscribing to industry newsletters, following relevant companies and organizations, or regularly checking reputable industry news sources and publications.
Methodology
Step 1 - Identification of Relevant Samples Size from Population Database


Step 2 - Approaches for Defining Global Market Size (Value, Volume* & Price*)

Note*: In applicable scenarios
Step 3 - Data Sources
Primary Research
- Web Analytics
- Survey Reports
- Research Institute
- Latest Research Reports
- Opinion Leaders
Secondary Research
- Annual Reports
- White Paper
- Latest Press Release
- Industry Association
- Paid Database
- Investor Presentations

Step 4 - Data Triangulation
Involves using different sources of information in order to increase the validity of a study
These sources are likely to be stakeholders in a program - participants, other researchers, program staff, other community members, and so on.
Then we put all data in single framework & apply various statistical tools to find out the dynamic on the market.
During the analysis stage, feedback from the stakeholder groups would be compared to determine areas of agreement as well as areas of divergence
