

Key Insights
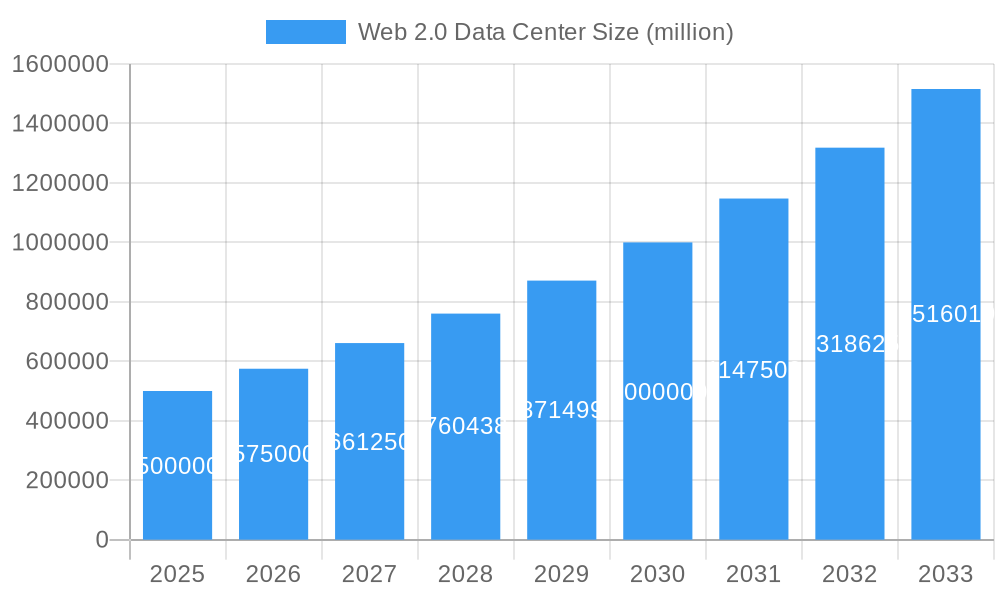
The Web 2.0 Data Center market is projected for substantial growth, driven by the escalating demand for cloud computing, big data analytics, and the Internet of Things (IoT). Key growth drivers include the surge in data-intensive applications, the critical need for robust data security and reliability, and the advancement of edge computing. Businesses are actively investing in data center modernization to manage increasing data volumes and complexity. This fuels the adoption of advanced technologies like Software-Defined Networking (SDN), Network Function Virtualization (NFV), and Artificial Intelligence (AI) for optimized resource management and enhanced operational efficiency. The market size was valued at $22.46 billion in the base year 2023, with a projected Compound Annual Growth Rate (CAGR) of 10.68% through the forecast period. Continued digital transformation and cloud service adoption will sustain this expansion.
Web 2.0 Data Center Market Size (In Billion)
Despite positive growth, market expansion faces limitations. Significant initial investment costs for data center construction and maintenance, data security and privacy concerns, and the complexity of managing advanced IT infrastructures present considerable challenges. Intense competition from established providers such as Dell, IBM, AWS, Huawei, Ericsson, Cisco, NVIDIA, Lenovo, Marvell, and Google Cloud Platform may impact new entrants. However, ongoing technological innovations and the continuous demand for data-centric solutions ensure a promising long-term outlook for the Web 2.0 Data Center market. Market segmentation encompasses hardware, software, and services, each with distinct growth patterns influenced by technological evolution and user requirements. Regional market dynamics will vary, with North America and Europe anticipated to lead, followed by increasing adoption in Asia-Pacific and other emerging markets.
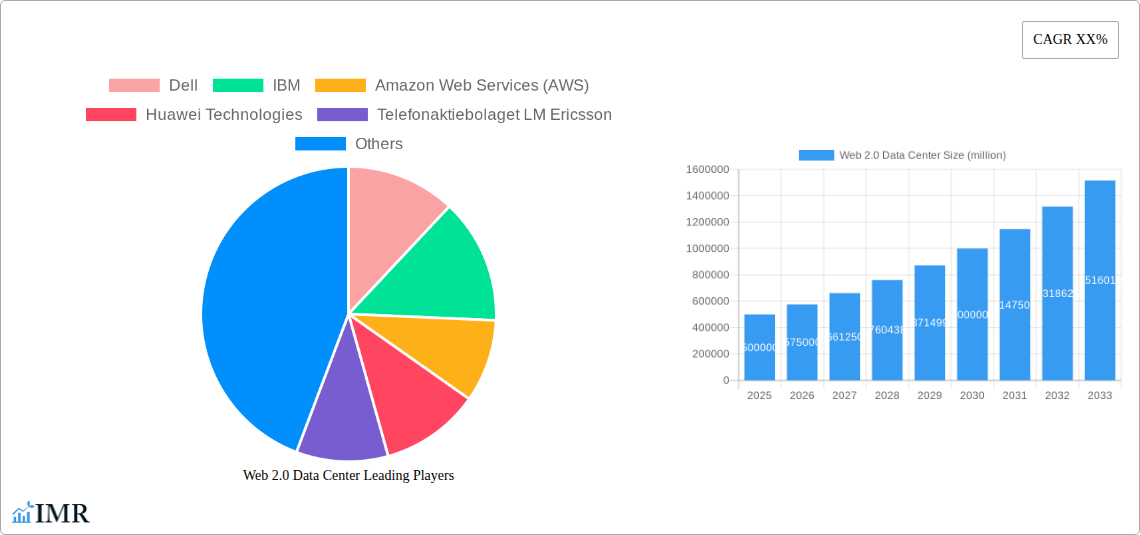
Web 2.0 Data Center Company Market Share
Web 2.0 Data Center Market Report: 2019-2033 Forecast
This comprehensive report provides an in-depth analysis of the Web 2.0 Data Center market, encompassing market dynamics, growth trends, regional analysis, product landscape, key players, and future outlook. The study period covers 2019-2033, with a base year of 2025 and a forecast period of 2025-2033. The report leverages extensive primary and secondary research to deliver actionable insights for industry professionals, investors, and strategic decision-makers. The parent market is the broader data center market, while the child market focuses specifically on infrastructure and services supporting Web 2.0 applications. This report projects a market value of xx million in 2025 and xx million by 2033.
Keywords: Web 2.0 Data Center, Data Center Market, Cloud Computing, Server Market, Network Infrastructure, Data Center Infrastructure, Hyperscale Data Centers, Edge Computing, AI Infrastructure, Dell, IBM, AWS, Huawei, Ericsson, Cisco, NVIDIA, Lenovo, Marvell, Google Cloud Platform, Market Size, Market Share, Market Growth, CAGR, Market Forecast, Industry Trends.
Web 2.0 Data Center Market Dynamics & Structure
The Web 2.0 Data Center market is characterized by high concentration among a few major players, fueled by rapid technological innovation and evolving regulatory frameworks. Competitive pressures are intense, with a constant influx of new technologies creating substitutes for existing solutions. The end-user demographic spans across various industries, from social media giants to e-commerce platforms and streaming services. M&A activity is significant, reflecting the strategic consolidation and expansion efforts of leading companies.
- Market Concentration: The top 5 players hold approximately 60% of the market share in 2025.
- Technological Innovation: Advancements in areas like AI, 5G, and edge computing are key drivers.
- Regulatory Landscape: Data privacy regulations (e.g., GDPR) and cybersecurity standards influence market dynamics.
- Competitive Substitutes: Software-defined networking (SDN) and network function virtualization (NFV) pose competitive threats.
- End-User Demographics: High growth is driven by increased demand from cloud service providers and large enterprises.
- M&A Activity: An estimated 200 M&A deals related to Web 2.0 data center technologies occurred between 2019-2024, valued at approximately xx million.
Web 2.0 Data Center Growth Trends & Insights
The Web 2.0 Data Center market experienced robust growth during the historical period (2019-2024), driven by the explosive growth of cloud computing, big data, and the internet of things (IoT). This trend is projected to continue with a Compound Annual Growth Rate (CAGR) of xx% between 2025 and 2033, reaching a market value of xx million by 2033. Market penetration of Web 2.0 specific data center solutions is increasing steadily, with growing adoption across various industries and regions. Technological disruptions, such as the rise of edge computing and the increasing reliance on AI, are significantly shaping market dynamics and consumer behavior.
Dominant Regions, Countries, or Segments in Web 2.0 Data Center
North America and Asia-Pacific currently dominate the Web 2.0 Data Center market, driven by strong technological infrastructure, high digital adoption rates, and substantial investments in data center infrastructure. Within these regions, the United States and China are the key countries driving market growth. The hyperscale segment, which comprises large-scale data centers of tech giants like Google and Amazon, represents a significant proportion of the market.
- Key Drivers (North America): Strong government support for technological innovation, mature digital economy, large number of hyperscale data centers.
- Key Drivers (Asia-Pacific): Rapid economic growth, increasing internet penetration, growing demand for cloud services.
- Market Share: North America holds approximately 45% of the market share, with Asia-Pacific at 35% in 2025.
Web 2.0 Data Center Product Landscape
The Web 2.0 Data Center product landscape encompasses a broad range of hardware, software, and services, including high-performance computing (HPC) systems, specialized servers, networking equipment, storage solutions, and data center management software. Product innovation focuses on increased efficiency, scalability, and security. Key innovations include advancements in server architecture, network virtualization technologies, and AI-powered data center management tools. This is driving the adoption of more efficient and cost-effective solutions.
Key Drivers, Barriers & Challenges in Web 2.0 Data Center
Key Drivers: The increasing demand for cloud computing, big data analytics, and AI is a primary driver. Growing adoption of 5G and IoT is fueling demand for robust data center infrastructure. Government investments in digital infrastructure further accelerates the market.
Challenges: Supply chain disruptions continue to affect the availability of crucial components. Regulatory hurdles related to data privacy and security pose challenges. Intense competition among vendors leads to price pressures. A shortage of skilled professionals is a significant obstacle to growth.
Emerging Opportunities in Web 2.0 Data Center
Emerging opportunities include the expansion of edge computing, the growing demand for sustainable data centers, and the integration of blockchain technologies for enhanced security and efficiency. Untapped markets in developing economies represent significant growth potential. The adoption of new technologies such as quantum computing also offers significant long-term opportunities.
Growth Accelerators in the Web 2.0 Data Center Industry
Technological breakthroughs in areas such as AI, 5G, and edge computing are key growth catalysts. Strategic partnerships between technology providers and data center operators are driving market consolidation and expansion. Investments in sustainable and energy-efficient data center technologies will play a vital role in future market growth.
Key Players Shaping the Web 2.0 Data Center Market
Notable Milestones in Web 2.0 Data Center Sector
- 2020, Q3: AWS launches its new generation of Graviton processors.
- 2021, Q1: Huawei announces its new data center switch platform.
- 2022, Q4: Dell acquires a key data center technology company, further strengthening its market position.
- 2023, Q2: Google Cloud launches a new edge computing platform.
- 2024, Q1: Significant increase in investments by several major players in sustainable data center solutions.
In-Depth Web 2.0 Data Center Market Outlook
The Web 2.0 Data Center market is poised for continued robust growth, driven by technological advancements, expanding digital adoption, and increasing data generation. The focus on sustainable practices and efficient resource utilization will shape future market dynamics. Strategic partnerships and collaborations will play a crucial role in achieving growth. There are significant opportunities for new entrants to focus on niche segments and innovative technologies to enhance their share in the market.
Web 2.0 Data Center Segmentation
-
1. Application
- 1.1. Large Enterprise
- 1.2. SME
-
2. Types
- 2.1. Enterprise Data Center
- 2.2. Colocation Data Center
- 2.3. Modular Data Center
- 2.4. Other
Web 2.0 Data Center Segmentation By Geography
-
1. North America
- 1.1. United States
- 1.2. Canada
- 1.3. Mexico
-
2. South America
- 2.1. Brazil
- 2.2. Argentina
- 2.3. Rest of South America
-
3. Europe
- 3.1. United Kingdom
- 3.2. Germany
- 3.3. France
- 3.4. Italy
- 3.5. Spain
- 3.6. Russia
- 3.7. Benelux
- 3.8. Nordics
- 3.9. Rest of Europe
-
4. Middle East & Africa
- 4.1. Turkey
- 4.2. Israel
- 4.3. GCC
- 4.4. North Africa
- 4.5. South Africa
- 4.6. Rest of Middle East & Africa
-
5. Asia Pacific
- 5.1. China
- 5.2. India
- 5.3. Japan
- 5.4. South Korea
- 5.5. ASEAN
- 5.6. Oceania
- 5.7. Rest of Asia Pacific
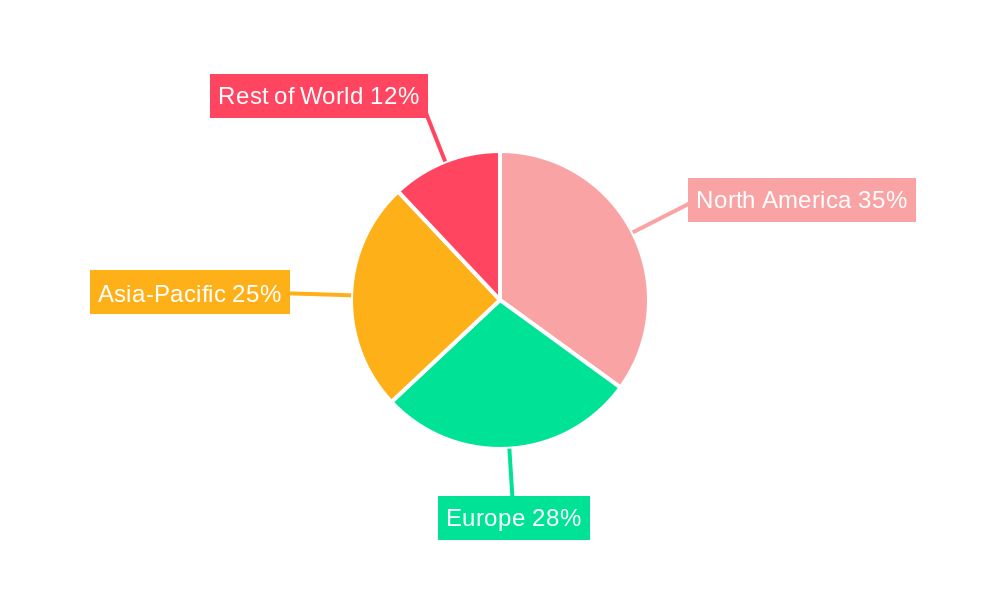
Web 2.0 Data Center Regional Market Share
Geographic Coverage of Web 2.0 Data Center
Web 2.0 Data Center REPORT HIGHLIGHTS
| Aspects | Details |
|---|---|
| Study Period | 2020-2034 |
| Base Year | 2025 |
| Estimated Year | 2026 |
| Forecast Period | 2026-2034 |
| Historical Period | 2020-2025 |
| Growth Rate | CAGR of 10.68% from 2020-2034 |
| Segmentation |
|
Table of Contents
- 1. Introduction
- 1.1. Research Scope
- 1.2. Market Segmentation
- 1.3. Research Methodology
- 1.4. Definitions and Assumptions
- 2. Executive Summary
- 2.1. Introduction
- 3. Market Dynamics
- 3.1. Introduction
- 3.2. Market Drivers
- 3.3. Market Restrains
- 3.4. Market Trends
- 4. Market Factor Analysis
- 4.1. Porters Five Forces
- 4.2. Supply/Value Chain
- 4.3. PESTEL analysis
- 4.4. Market Entropy
- 4.5. Patent/Trademark Analysis
- 5. Global Web 2.0 Data Center Analysis, Insights and Forecast, 2020-2032
- 5.1. Market Analysis, Insights and Forecast - by Application
- 5.1.1. Large Enterprise
- 5.1.2. SME
- 5.2. Market Analysis, Insights and Forecast - by Types
- 5.2.1. Enterprise Data Center
- 5.2.2. Colocation Data Center
- 5.2.3. Modular Data Center
- 5.2.4. Other
- 5.3. Market Analysis, Insights and Forecast - by Region
- 5.3.1. North America
- 5.3.2. South America
- 5.3.3. Europe
- 5.3.4. Middle East & Africa
- 5.3.5. Asia Pacific
- 5.1. Market Analysis, Insights and Forecast - by Application
- 6. North America Web 2.0 Data Center Analysis, Insights and Forecast, 2020-2032
- 6.1. Market Analysis, Insights and Forecast - by Application
- 6.1.1. Large Enterprise
- 6.1.2. SME
- 6.2. Market Analysis, Insights and Forecast - by Types
- 6.2.1. Enterprise Data Center
- 6.2.2. Colocation Data Center
- 6.2.3. Modular Data Center
- 6.2.4. Other
- 6.1. Market Analysis, Insights and Forecast - by Application
- 7. South America Web 2.0 Data Center Analysis, Insights and Forecast, 2020-2032
- 7.1. Market Analysis, Insights and Forecast - by Application
- 7.1.1. Large Enterprise
- 7.1.2. SME
- 7.2. Market Analysis, Insights and Forecast - by Types
- 7.2.1. Enterprise Data Center
- 7.2.2. Colocation Data Center
- 7.2.3. Modular Data Center
- 7.2.4. Other
- 7.1. Market Analysis, Insights and Forecast - by Application
- 8. Europe Web 2.0 Data Center Analysis, Insights and Forecast, 2020-2032
- 8.1. Market Analysis, Insights and Forecast - by Application
- 8.1.1. Large Enterprise
- 8.1.2. SME
- 8.2. Market Analysis, Insights and Forecast - by Types
- 8.2.1. Enterprise Data Center
- 8.2.2. Colocation Data Center
- 8.2.3. Modular Data Center
- 8.2.4. Other
- 8.1. Market Analysis, Insights and Forecast - by Application
- 9. Middle East & Africa Web 2.0 Data Center Analysis, Insights and Forecast, 2020-2032
- 9.1. Market Analysis, Insights and Forecast - by Application
- 9.1.1. Large Enterprise
- 9.1.2. SME
- 9.2. Market Analysis, Insights and Forecast - by Types
- 9.2.1. Enterprise Data Center
- 9.2.2. Colocation Data Center
- 9.2.3. Modular Data Center
- 9.2.4. Other
- 9.1. Market Analysis, Insights and Forecast - by Application
- 10. Asia Pacific Web 2.0 Data Center Analysis, Insights and Forecast, 2020-2032
- 10.1. Market Analysis, Insights and Forecast - by Application
- 10.1.1. Large Enterprise
- 10.1.2. SME
- 10.2. Market Analysis, Insights and Forecast - by Types
- 10.2.1. Enterprise Data Center
- 10.2.2. Colocation Data Center
- 10.2.3. Modular Data Center
- 10.2.4. Other
- 10.1. Market Analysis, Insights and Forecast - by Application
- 11. Competitive Analysis
- 11.1. Global Market Share Analysis 2025
- 11.2. Company Profiles
- 11.2.1 Dell
- 11.2.1.1. Overview
- 11.2.1.2. Products
- 11.2.1.3. SWOT Analysis
- 11.2.1.4. Recent Developments
- 11.2.1.5. Financials (Based on Availability)
- 11.2.2 IBM
- 11.2.2.1. Overview
- 11.2.2.2. Products
- 11.2.2.3. SWOT Analysis
- 11.2.2.4. Recent Developments
- 11.2.2.5. Financials (Based on Availability)
- 11.2.3 Amazon Web Services (AWS)
- 11.2.3.1. Overview
- 11.2.3.2. Products
- 11.2.3.3. SWOT Analysis
- 11.2.3.4. Recent Developments
- 11.2.3.5. Financials (Based on Availability)
- 11.2.4 Huawei Technologies
- 11.2.4.1. Overview
- 11.2.4.2. Products
- 11.2.4.3. SWOT Analysis
- 11.2.4.4. Recent Developments
- 11.2.4.5. Financials (Based on Availability)
- 11.2.5 Telefonaktiebolaget LM Ericsson
- 11.2.5.1. Overview
- 11.2.5.2. Products
- 11.2.5.3. SWOT Analysis
- 11.2.5.4. Recent Developments
- 11.2.5.5. Financials (Based on Availability)
- 11.2.6 Cisco Systems
- 11.2.6.1. Overview
- 11.2.6.2. Products
- 11.2.6.3. SWOT Analysis
- 11.2.6.4. Recent Developments
- 11.2.6.5. Financials (Based on Availability)
- 11.2.7 NVIDIA Corporation
- 11.2.7.1. Overview
- 11.2.7.2. Products
- 11.2.7.3. SWOT Analysis
- 11.2.7.4. Recent Developments
- 11.2.7.5. Financials (Based on Availability)
- 11.2.8 Lenovo
- 11.2.8.1. Overview
- 11.2.8.2. Products
- 11.2.8.3. SWOT Analysis
- 11.2.8.4. Recent Developments
- 11.2.8.5. Financials (Based on Availability)
- 11.2.9 Marvell
- 11.2.9.1. Overview
- 11.2.9.2. Products
- 11.2.9.3. SWOT Analysis
- 11.2.9.4. Recent Developments
- 11.2.9.5. Financials (Based on Availability)
- 11.2.10 Google Cloud Platform
- 11.2.10.1. Overview
- 11.2.10.2. Products
- 11.2.10.3. SWOT Analysis
- 11.2.10.4. Recent Developments
- 11.2.10.5. Financials (Based on Availability)
- 11.2.1 Dell
List of Figures
- Figure 1: Global Web 2.0 Data Center Revenue Breakdown (billion, %) by Region 2025 & 2033
- Figure 2: North America Web 2.0 Data Center Revenue (billion), by Application 2025 & 2033
- Figure 3: North America Web 2.0 Data Center Revenue Share (%), by Application 2025 & 2033
- Figure 4: North America Web 2.0 Data Center Revenue (billion), by Types 2025 & 2033
- Figure 5: North America Web 2.0 Data Center Revenue Share (%), by Types 2025 & 2033
- Figure 6: North America Web 2.0 Data Center Revenue (billion), by Country 2025 & 2033
- Figure 7: North America Web 2.0 Data Center Revenue Share (%), by Country 2025 & 2033
- Figure 8: South America Web 2.0 Data Center Revenue (billion), by Application 2025 & 2033
- Figure 9: South America Web 2.0 Data Center Revenue Share (%), by Application 2025 & 2033
- Figure 10: South America Web 2.0 Data Center Revenue (billion), by Types 2025 & 2033
- Figure 11: South America Web 2.0 Data Center Revenue Share (%), by Types 2025 & 2033
- Figure 12: South America Web 2.0 Data Center Revenue (billion), by Country 2025 & 2033
- Figure 13: South America Web 2.0 Data Center Revenue Share (%), by Country 2025 & 2033
- Figure 14: Europe Web 2.0 Data Center Revenue (billion), by Application 2025 & 2033
- Figure 15: Europe Web 2.0 Data Center Revenue Share (%), by Application 2025 & 2033
- Figure 16: Europe Web 2.0 Data Center Revenue (billion), by Types 2025 & 2033
- Figure 17: Europe Web 2.0 Data Center Revenue Share (%), by Types 2025 & 2033
- Figure 18: Europe Web 2.0 Data Center Revenue (billion), by Country 2025 & 2033
- Figure 19: Europe Web 2.0 Data Center Revenue Share (%), by Country 2025 & 2033
- Figure 20: Middle East & Africa Web 2.0 Data Center Revenue (billion), by Application 2025 & 2033
- Figure 21: Middle East & Africa Web 2.0 Data Center Revenue Share (%), by Application 2025 & 2033
- Figure 22: Middle East & Africa Web 2.0 Data Center Revenue (billion), by Types 2025 & 2033
- Figure 23: Middle East & Africa Web 2.0 Data Center Revenue Share (%), by Types 2025 & 2033
- Figure 24: Middle East & Africa Web 2.0 Data Center Revenue (billion), by Country 2025 & 2033
- Figure 25: Middle East & Africa Web 2.0 Data Center Revenue Share (%), by Country 2025 & 2033
- Figure 26: Asia Pacific Web 2.0 Data Center Revenue (billion), by Application 2025 & 2033
- Figure 27: Asia Pacific Web 2.0 Data Center Revenue Share (%), by Application 2025 & 2033
- Figure 28: Asia Pacific Web 2.0 Data Center Revenue (billion), by Types 2025 & 2033
- Figure 29: Asia Pacific Web 2.0 Data Center Revenue Share (%), by Types 2025 & 2033
- Figure 30: Asia Pacific Web 2.0 Data Center Revenue (billion), by Country 2025 & 2033
- Figure 31: Asia Pacific Web 2.0 Data Center Revenue Share (%), by Country 2025 & 2033
List of Tables
- Table 1: Global Web 2.0 Data Center Revenue billion Forecast, by Application 2020 & 2033
- Table 2: Global Web 2.0 Data Center Revenue billion Forecast, by Types 2020 & 2033
- Table 3: Global Web 2.0 Data Center Revenue billion Forecast, by Region 2020 & 2033
- Table 4: Global Web 2.0 Data Center Revenue billion Forecast, by Application 2020 & 2033
- Table 5: Global Web 2.0 Data Center Revenue billion Forecast, by Types 2020 & 2033
- Table 6: Global Web 2.0 Data Center Revenue billion Forecast, by Country 2020 & 2033
- Table 7: United States Web 2.0 Data Center Revenue (billion) Forecast, by Application 2020 & 2033
- Table 8: Canada Web 2.0 Data Center Revenue (billion) Forecast, by Application 2020 & 2033
- Table 9: Mexico Web 2.0 Data Center Revenue (billion) Forecast, by Application 2020 & 2033
- Table 10: Global Web 2.0 Data Center Revenue billion Forecast, by Application 2020 & 2033
- Table 11: Global Web 2.0 Data Center Revenue billion Forecast, by Types 2020 & 2033
- Table 12: Global Web 2.0 Data Center Revenue billion Forecast, by Country 2020 & 2033
- Table 13: Brazil Web 2.0 Data Center Revenue (billion) Forecast, by Application 2020 & 2033
- Table 14: Argentina Web 2.0 Data Center Revenue (billion) Forecast, by Application 2020 & 2033
- Table 15: Rest of South America Web 2.0 Data Center Revenue (billion) Forecast, by Application 2020 & 2033
- Table 16: Global Web 2.0 Data Center Revenue billion Forecast, by Application 2020 & 2033
- Table 17: Global Web 2.0 Data Center Revenue billion Forecast, by Types 2020 & 2033
- Table 18: Global Web 2.0 Data Center Revenue billion Forecast, by Country 2020 & 2033
- Table 19: United Kingdom Web 2.0 Data Center Revenue (billion) Forecast, by Application 2020 & 2033
- Table 20: Germany Web 2.0 Data Center Revenue (billion) Forecast, by Application 2020 & 2033
- Table 21: France Web 2.0 Data Center Revenue (billion) Forecast, by Application 2020 & 2033
- Table 22: Italy Web 2.0 Data Center Revenue (billion) Forecast, by Application 2020 & 2033
- Table 23: Spain Web 2.0 Data Center Revenue (billion) Forecast, by Application 2020 & 2033
- Table 24: Russia Web 2.0 Data Center Revenue (billion) Forecast, by Application 2020 & 2033
- Table 25: Benelux Web 2.0 Data Center Revenue (billion) Forecast, by Application 2020 & 2033
- Table 26: Nordics Web 2.0 Data Center Revenue (billion) Forecast, by Application 2020 & 2033
- Table 27: Rest of Europe Web 2.0 Data Center Revenue (billion) Forecast, by Application 2020 & 2033
- Table 28: Global Web 2.0 Data Center Revenue billion Forecast, by Application 2020 & 2033
- Table 29: Global Web 2.0 Data Center Revenue billion Forecast, by Types 2020 & 2033
- Table 30: Global Web 2.0 Data Center Revenue billion Forecast, by Country 2020 & 2033
- Table 31: Turkey Web 2.0 Data Center Revenue (billion) Forecast, by Application 2020 & 2033
- Table 32: Israel Web 2.0 Data Center Revenue (billion) Forecast, by Application 2020 & 2033
- Table 33: GCC Web 2.0 Data Center Revenue (billion) Forecast, by Application 2020 & 2033
- Table 34: North Africa Web 2.0 Data Center Revenue (billion) Forecast, by Application 2020 & 2033
- Table 35: South Africa Web 2.0 Data Center Revenue (billion) Forecast, by Application 2020 & 2033
- Table 36: Rest of Middle East & Africa Web 2.0 Data Center Revenue (billion) Forecast, by Application 2020 & 2033
- Table 37: Global Web 2.0 Data Center Revenue billion Forecast, by Application 2020 & 2033
- Table 38: Global Web 2.0 Data Center Revenue billion Forecast, by Types 2020 & 2033
- Table 39: Global Web 2.0 Data Center Revenue billion Forecast, by Country 2020 & 2033
- Table 40: China Web 2.0 Data Center Revenue (billion) Forecast, by Application 2020 & 2033
- Table 41: India Web 2.0 Data Center Revenue (billion) Forecast, by Application 2020 & 2033
- Table 42: Japan Web 2.0 Data Center Revenue (billion) Forecast, by Application 2020 & 2033
- Table 43: South Korea Web 2.0 Data Center Revenue (billion) Forecast, by Application 2020 & 2033
- Table 44: ASEAN Web 2.0 Data Center Revenue (billion) Forecast, by Application 2020 & 2033
- Table 45: Oceania Web 2.0 Data Center Revenue (billion) Forecast, by Application 2020 & 2033
- Table 46: Rest of Asia Pacific Web 2.0 Data Center Revenue (billion) Forecast, by Application 2020 & 2033
Frequently Asked Questions
1. What is the projected Compound Annual Growth Rate (CAGR) of the Web 2.0 Data Center?
The projected CAGR is approximately 10.68%.
2. Which companies are prominent players in the Web 2.0 Data Center?
Key companies in the market include Dell, IBM, Amazon Web Services (AWS), Huawei Technologies, Telefonaktiebolaget LM Ericsson, Cisco Systems, NVIDIA Corporation, Lenovo, Marvell, Google Cloud Platform.
3. What are the main segments of the Web 2.0 Data Center?
The market segments include Application, Types.
4. Can you provide details about the market size?
The market size is estimated to be USD 22.46 billion as of 2022.
5. What are some drivers contributing to market growth?
N/A
6. What are the notable trends driving market growth?
N/A
7. Are there any restraints impacting market growth?
N/A
8. Can you provide examples of recent developments in the market?
N/A
9. What pricing options are available for accessing the report?
Pricing options include single-user, multi-user, and enterprise licenses priced at USD 4900.00, USD 7350.00, and USD 9800.00 respectively.
10. Is the market size provided in terms of value or volume?
The market size is provided in terms of value, measured in billion.
11. Are there any specific market keywords associated with the report?
Yes, the market keyword associated with the report is "Web 2.0 Data Center," which aids in identifying and referencing the specific market segment covered.
12. How do I determine which pricing option suits my needs best?
The pricing options vary based on user requirements and access needs. Individual users may opt for single-user licenses, while businesses requiring broader access may choose multi-user or enterprise licenses for cost-effective access to the report.
13. Are there any additional resources or data provided in the Web 2.0 Data Center report?
While the report offers comprehensive insights, it's advisable to review the specific contents or supplementary materials provided to ascertain if additional resources or data are available.
14. How can I stay updated on further developments or reports in the Web 2.0 Data Center?
To stay informed about further developments, trends, and reports in the Web 2.0 Data Center, consider subscribing to industry newsletters, following relevant companies and organizations, or regularly checking reputable industry news sources and publications.
Methodology
Step 1 - Identification of Relevant Samples Size from Population Database


Step 2 - Approaches for Defining Global Market Size (Value, Volume* & Price*)

Note*: In applicable scenarios
Step 3 - Data Sources
Primary Research
- Web Analytics
- Survey Reports
- Research Institute
- Latest Research Reports
- Opinion Leaders
Secondary Research
- Annual Reports
- White Paper
- Latest Press Release
- Industry Association
- Paid Database
- Investor Presentations

Step 4 - Data Triangulation
Involves using different sources of information in order to increase the validity of a study
These sources are likely to be stakeholders in a program - participants, other researchers, program staff, other community members, and so on.
Then we put all data in single framework & apply various statistical tools to find out the dynamic on the market.
During the analysis stage, feedback from the stakeholder groups would be compared to determine areas of agreement as well as areas of divergence