

Key Insights
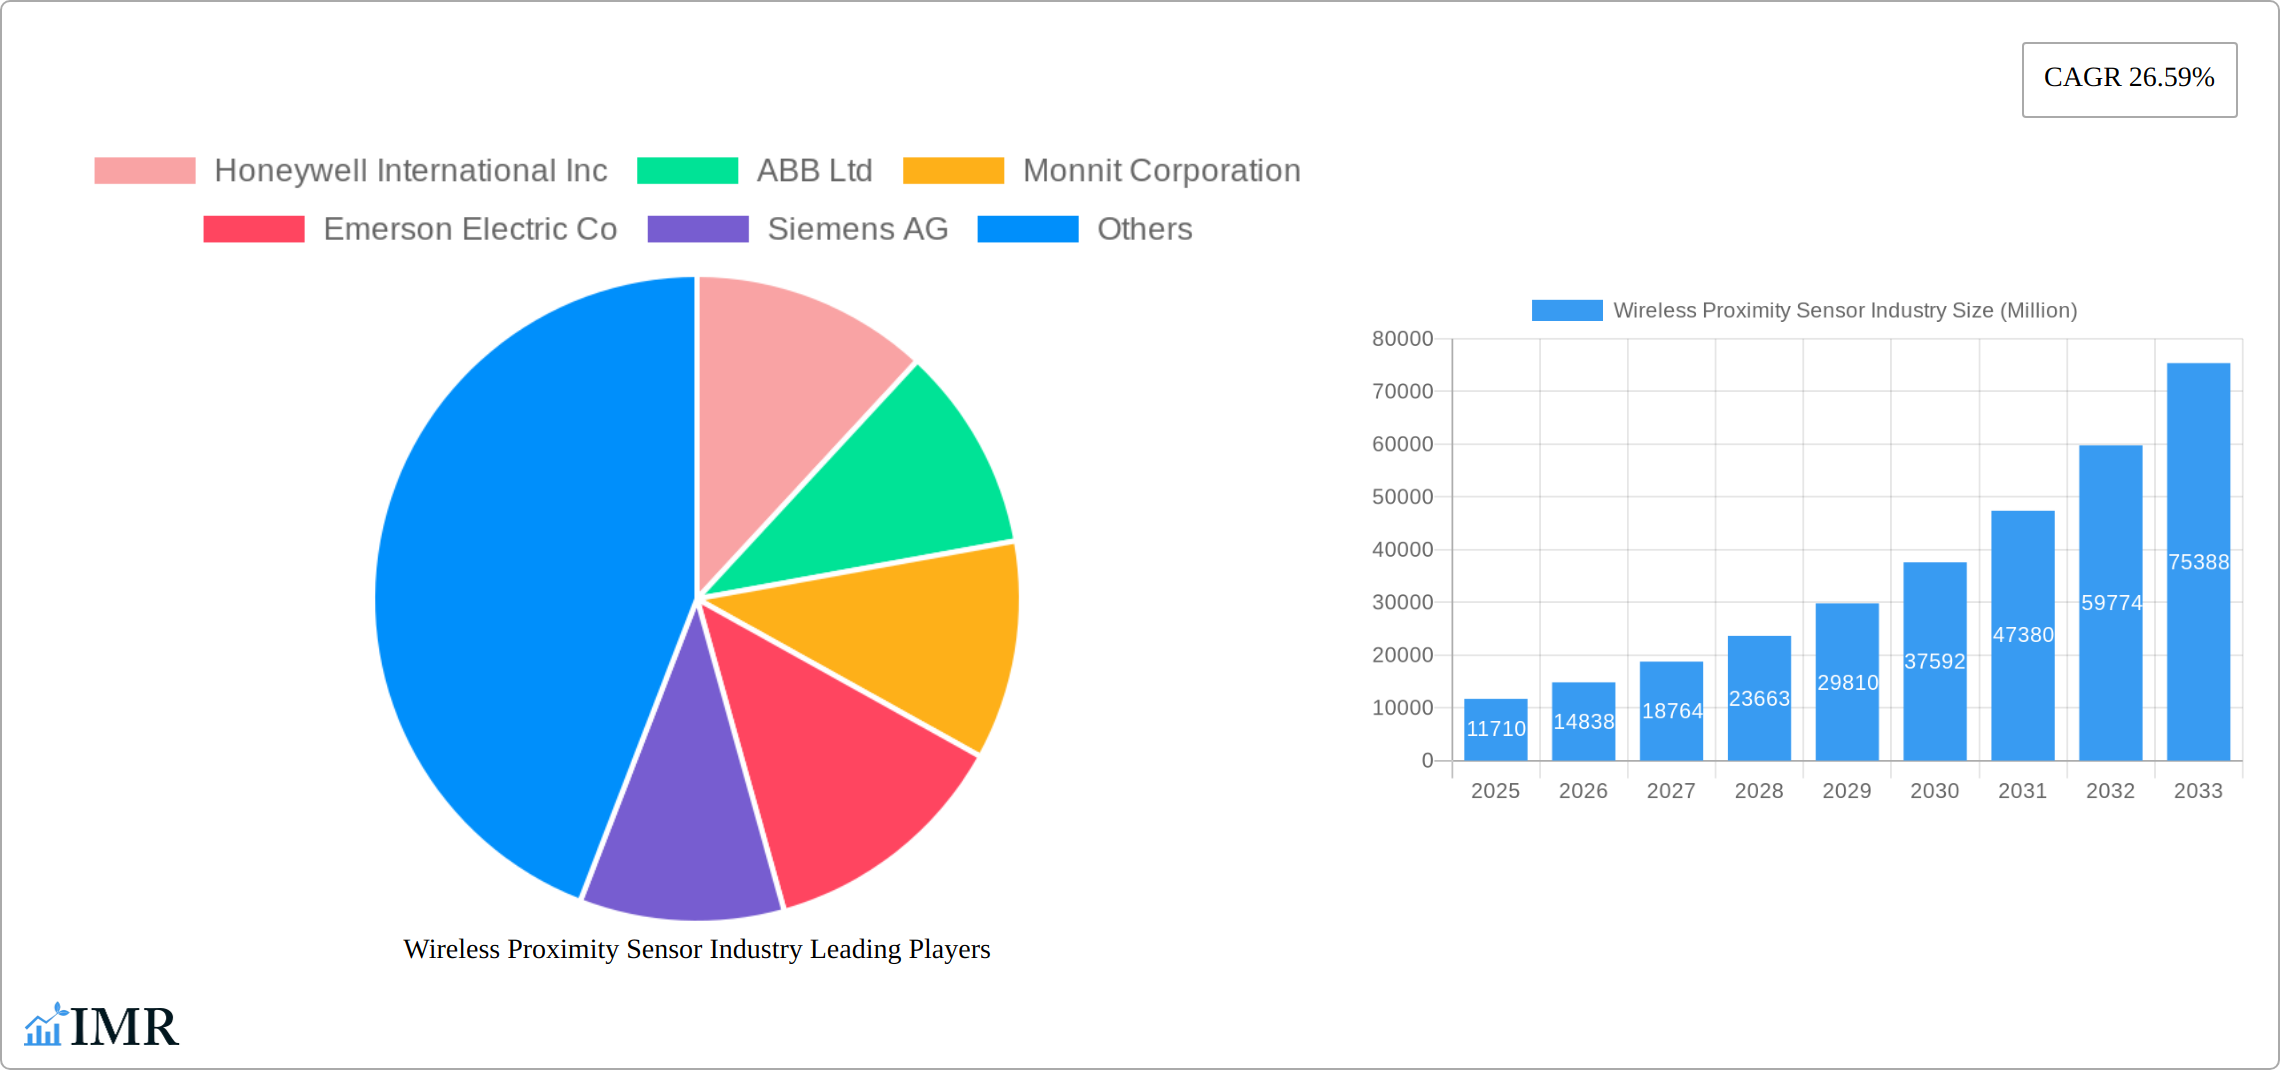
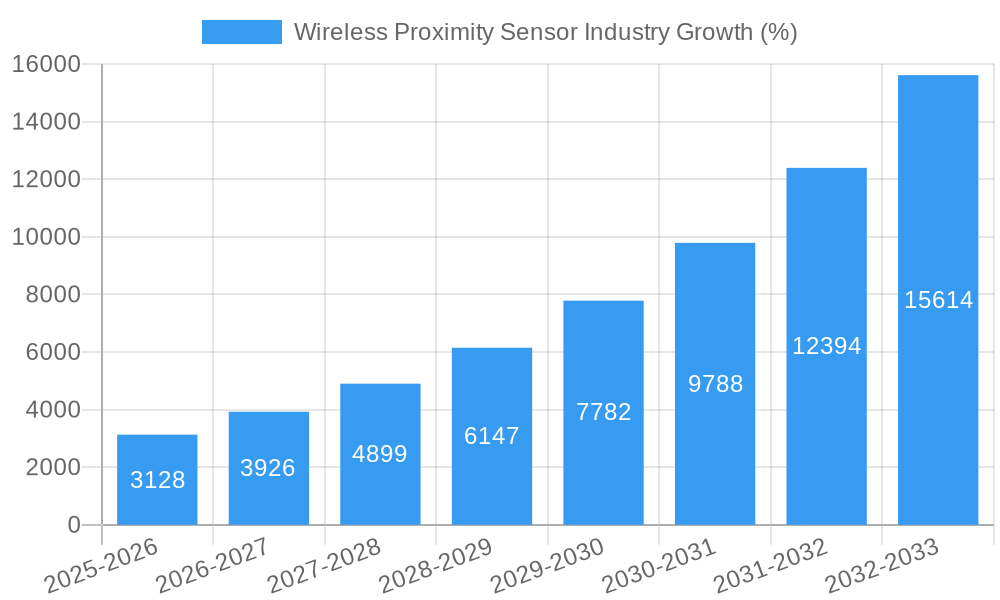
The wireless proximity sensor market, valued at $11.71 billion in 2025, is experiencing robust growth, projected to expand at a compound annual growth rate (CAGR) of 26.59% from 2025 to 2033. This surge is driven by several key factors. Increasing automation across diverse industries, particularly automotive and healthcare, fuels the demand for contactless sensing solutions. The rising adoption of Industry 4.0 principles and the Internet of Things (IoT) further propels market growth, as wireless sensors enable real-time data acquisition and remote monitoring. Advancements in sensor technology, leading to improved accuracy, reliability, and miniaturization, are also significant contributors. Furthermore, the growing need for enhanced safety and efficiency in various applications, including industrial automation, robotics, and access control systems, contributes to the market's expansion. The market segmentation, encompassing various sensor types (pressure, temperature, chemical/gas, position/proximity, and others) and end-user industries, reflects the broad applicability and versatility of wireless proximity sensors.
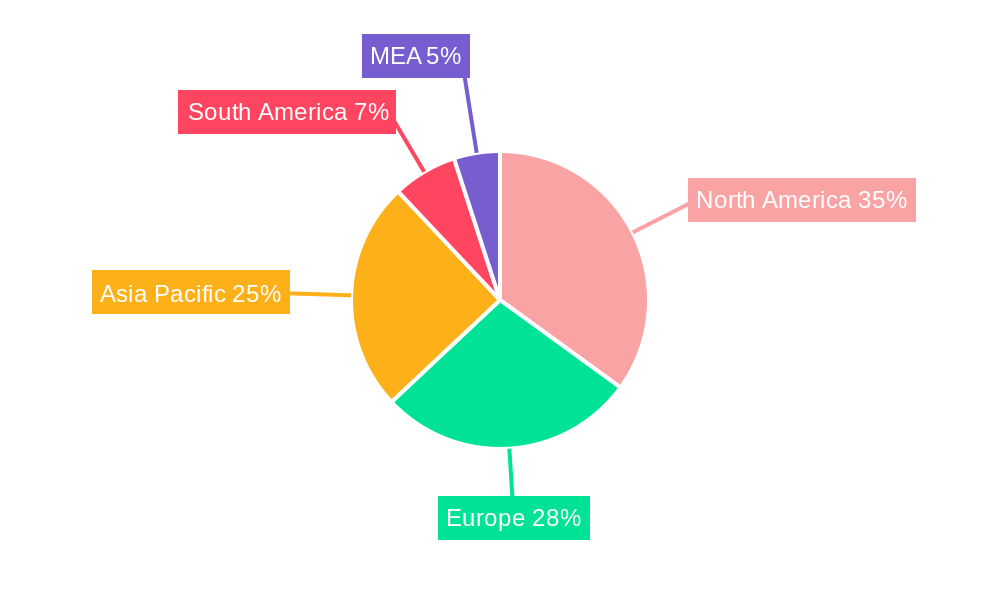
Despite the significant growth potential, certain restraints exist. High initial investment costs associated with implementing wireless sensor networks and concerns regarding data security and system reliability could impede market adoption to some extent. However, ongoing technological advancements, decreasing sensor costs, and the increasing availability of robust security protocols are expected to mitigate these challenges. The competitive landscape is marked by the presence of both established industry players and emerging companies, driving innovation and price competition, ultimately benefiting end-users. Regional variations in market growth are likely, with North America and Asia Pacific expected to dominate owing to high technological adoption rates and substantial industrial automation activities within these regions. The forecast period anticipates continued expansion across all segments, indicating a promising outlook for the wireless proximity sensor market.
Wireless Proximity Sensor Industry Market Report: 2019-2033
This comprehensive report provides a detailed analysis of the Wireless Proximity Sensor industry, encompassing market dynamics, growth trends, regional dominance, product landscape, key players, and future outlook. The study period covers 2019-2033, with 2025 as the base and estimated year. This report is invaluable for industry professionals, investors, and strategists seeking to understand and capitalize on opportunities within this rapidly evolving sector. The market is segmented by type (Pressure Sensors, Temperature Sensors, Chemical and Gas Sensors, Position and Proximity Sensors, Other Types of Sensors) and end-user industry (Automotive, Healthcare, Aerospace and Defense, Energy and Power, Food and Beverage, Other End-user Industries). The global market size is projected to reach xx Million units by 2033.
Wireless Proximity Sensor Industry Market Dynamics & Structure
The wireless proximity sensor market is characterized by moderate concentration, with several key players holding significant market share. However, the market is also witnessing the entry of numerous smaller companies and startups, particularly in specialized sensor technologies. Technological innovation is a primary driver, with ongoing advancements in sensor miniaturization, power efficiency, communication protocols (e.g., Bluetooth, Zigbee, LoRaWAN), and integration with IoT platforms. Regulatory frameworks, particularly concerning safety and data privacy, influence market growth and adoption, especially in sectors like healthcare and industrial automation. The market also sees competitive pressure from wired sensor alternatives, although wireless sensors' flexibility and ease of installation are driving their increasing adoption. Furthermore, mergers and acquisitions (M&A) activity is moderately high, with larger players acquiring smaller companies to expand their product portfolios and technological capabilities. The number of M&A deals between 2019-2024 is estimated at xx.
- Market Concentration: Moderately concentrated, with top 5 players holding approximately xx% market share in 2025.
- Technological Innovation: Focus on miniaturization, low power consumption, improved accuracy, and seamless IoT integration.
- Regulatory Landscape: Stringent safety and data privacy regulations impact adoption in specific sectors.
- Competitive Substitutes: Wired sensors present competition, although wireless solutions are gaining traction due to flexibility.
- M&A Activity: Moderate level of consolidation, driven by expansion of product lines and technological capabilities.
Wireless Proximity Sensor Industry Growth Trends & Insights
The wireless proximity sensor market experienced significant growth between 2019 and 2024, driven by increasing adoption across various end-user industries. The market size grew from xx Million units in 2019 to xx Million units in 2024, exhibiting a CAGR of xx%. This growth is fueled by factors such as the increasing demand for automation in industrial processes, the proliferation of IoT devices, and the growing need for remote monitoring and control systems in various sectors. Technological advancements, such as the development of more sophisticated and cost-effective wireless sensor technologies, are further accelerating market growth. The adoption rate is projected to increase steadily throughout the forecast period, with a market penetration of xx% by 2033. Consumer behavior shifts towards increased preference for wireless and remote monitoring solutions further contribute to the positive growth trajectory. The CAGR from 2025 to 2033 is estimated at xx%.
Dominant Regions, Countries, or Segments in Wireless Proximity Sensor Industry
North America and Europe currently dominate the wireless proximity sensor market, driven by strong technological advancements, well-established industrial infrastructure, and high adoption rates in sectors such as automotive and healthcare. However, Asia Pacific is projected to witness the highest growth rate during the forecast period due to the rapid expansion of industrialization and rising demand for automation in countries like China and India.
By Type:
- Position and Proximity Sensors: This segment holds the largest market share, driven by the high demand for automation in industrial applications.
- Pressure Sensors: Growing adoption in automotive and industrial processes contributes to significant growth.
- Temperature Sensors: Wide applications in healthcare, food and beverage, and industrial monitoring contribute to consistent demand.
By End-user Industry:
- Automotive: High adoption for advanced driver-assistance systems (ADAS) and autonomous driving technologies drives substantial growth.
- Healthcare: Increasing demand for remote patient monitoring and improved healthcare infrastructure fuels significant market expansion.
- Industrial Automation: A major driver of growth, fueled by the need for efficient and reliable monitoring and control systems.
Wireless Proximity Sensor Industry Product Landscape
Wireless proximity sensors have undergone significant innovation, encompassing advancements in sensing technology, communication protocols, and integration capabilities. New products emphasize miniaturization, improved accuracy, enhanced power efficiency, and seamless integration with IoT platforms. Unique selling propositions include long-range sensing capabilities, enhanced durability in harsh environments, and advanced data analytics features. Technological advancements include the integration of artificial intelligence (AI) and machine learning (ML) algorithms for improved data processing and predictive maintenance.
Key Drivers, Barriers & Challenges in Wireless Proximity Sensor Industry
Key Drivers:
- Increased automation in various industries.
- Rising adoption of IoT and Industry 4.0 technologies.
- Growing need for remote monitoring and control.
- Technological advancements in sensor technology and communication protocols.
Challenges & Restraints:
- High initial investment costs for implementing wireless sensor networks.
- Concerns about data security and privacy.
- Interoperability challenges with different wireless protocols.
- Potential for signal interference and network congestion. This impacts approximately xx% of deployments annually.
Emerging Opportunities in Wireless Proximity Sensor Industry
Emerging opportunities exist in the development of specialized sensors for niche applications, such as smart agriculture, environmental monitoring, and wearable healthcare devices. Expansion into untapped markets in developing countries, particularly in Asia Pacific and Africa, presents significant growth potential. The integration of wireless proximity sensors with AI and ML for predictive maintenance and enhanced decision-making offers exciting avenues for innovation.
Growth Accelerators in the Wireless Proximity Sensor Industry
Long-term growth will be accelerated by technological breakthroughs in low-power wide-area networks (LPWANs), enabling broader deployment of wireless sensor networks in remote areas. Strategic partnerships between sensor manufacturers and IoT platform providers will drive market expansion. The development of standardized communication protocols and data formats will enhance interoperability and reduce deployment complexities. Government initiatives promoting the adoption of digital technologies and smart infrastructure will further stimulate market growth.
Key Players Shaping the Wireless Proximity Sensor Industry Market
- Honeywell International Inc
- ABB Ltd
- Monnit Corporation
- Emerson Electric Co
- Siemens AG
- Phoenix Sensors LLC
- Schneider Electric SE
- Texas Instruments Incorporated
- Rockwell Automation Inc
- Pasco Scientific
Notable Milestones in Wireless Proximity Sensor Industry Sector
- August 2022: Emerson announced the opening of a new gas analysis solutions center in Cumbernauld, Scotland, expanding its capacity for developing and manufacturing various sensing technologies. This significantly expands their market reach within the environmental monitoring sector.
- March 2022: Monnit Corporation launched its intrinsically safe ALTA-ISX long-range wireless sensors, enhancing safety in hazardous industrial environments. This directly addresses a key market need for improved safety standards.
In-Depth Wireless Proximity Sensor Industry Market Outlook
The wireless proximity sensor market is poised for sustained growth, driven by ongoing technological innovation, increasing adoption across various industries, and expansion into new applications. Strategic partnerships and investments in research and development will further accelerate market expansion. The development of more robust, cost-effective, and energy-efficient wireless sensor technologies will open new opportunities in remote monitoring and control, contributing to the continued growth of this dynamic market sector.
Wireless Proximity Sensor Industry Segmentation
-
1. Type
- 1.1. Pressure Sensors
- 1.2. Temperature Sensors
- 1.3. Chemical and Gas Sensors
- 1.4. Position and Proximity Sensors
- 1.5. Other Types of Sensors
-
2. End-user Industry
- 2.1. Automotive
- 2.2. Healthcare
- 2.3. Aerospace and Defense
- 2.4. Energy and Power
- 2.5. Food and Beverage
- 2.6. Other End-user Industries
Wireless Proximity Sensor Industry Segmentation By Geography
- 1. North America
- 2. Europe
- 3. Asia
- 4. Australia and New Zealand
Wireless Proximity Sensor Industry REPORT HIGHLIGHTS
| Aspects | Details |
|---|---|
| Study Period | 2019-2033 |
| Base Year | 2024 |
| Estimated Year | 2025 |
| Forecast Period | 2025-2033 |
| Historical Period | 2019-2024 |
| Growth Rate | CAGR of 26.59% from 2019-2033 |
| Segmentation |
|
Table of Contents
- 1. Introduction
- 1.1. Research Scope
- 1.2. Market Segmentation
- 1.3. Research Methodology
- 1.4. Definitions and Assumptions
- 2. Executive Summary
- 2.1. Introduction
- 3. Market Dynamics
- 3.1. Introduction
- 3.2. Market Drivers
- 3.2.1. Increasing Adoption of Wireless Technologies (Especially in Harsh Environments); Emergence of Smart Factory Concepts (Industrial Automation)
- 3.3. Market Restrains
- 3.3.1. Cost Implications In Line With Retrofits; European Macroeconomic and Geopolitical Factors
- 3.4. Market Trends
- 3.4.1. Energy and Power to Hold Significant Market Share
- 4. Market Factor Analysis
- 4.1. Porters Five Forces
- 4.2. Supply/Value Chain
- 4.3. PESTEL analysis
- 4.4. Market Entropy
- 4.5. Patent/Trademark Analysis
- 5. Global Wireless Proximity Sensor Industry Analysis, Insights and Forecast, 2019-2031
- 5.1. Market Analysis, Insights and Forecast - by Type
- 5.1.1. Pressure Sensors
- 5.1.2. Temperature Sensors
- 5.1.3. Chemical and Gas Sensors
- 5.1.4. Position and Proximity Sensors
- 5.1.5. Other Types of Sensors
- 5.2. Market Analysis, Insights and Forecast - by End-user Industry
- 5.2.1. Automotive
- 5.2.2. Healthcare
- 5.2.3. Aerospace and Defense
- 5.2.4. Energy and Power
- 5.2.5. Food and Beverage
- 5.2.6. Other End-user Industries
- 5.3. Market Analysis, Insights and Forecast - by Region
- 5.3.1. North America
- 5.3.2. Europe
- 5.3.3. Asia
- 5.3.4. Australia and New Zealand
- 5.1. Market Analysis, Insights and Forecast - by Type
- 6. North America Wireless Proximity Sensor Industry Analysis, Insights and Forecast, 2019-2031
- 6.1. Market Analysis, Insights and Forecast - by Type
- 6.1.1. Pressure Sensors
- 6.1.2. Temperature Sensors
- 6.1.3. Chemical and Gas Sensors
- 6.1.4. Position and Proximity Sensors
- 6.1.5. Other Types of Sensors
- 6.2. Market Analysis, Insights and Forecast - by End-user Industry
- 6.2.1. Automotive
- 6.2.2. Healthcare
- 6.2.3. Aerospace and Defense
- 6.2.4. Energy and Power
- 6.2.5. Food and Beverage
- 6.2.6. Other End-user Industries
- 6.1. Market Analysis, Insights and Forecast - by Type
- 7. Europe Wireless Proximity Sensor Industry Analysis, Insights and Forecast, 2019-2031
- 7.1. Market Analysis, Insights and Forecast - by Type
- 7.1.1. Pressure Sensors
- 7.1.2. Temperature Sensors
- 7.1.3. Chemical and Gas Sensors
- 7.1.4. Position and Proximity Sensors
- 7.1.5. Other Types of Sensors
- 7.2. Market Analysis, Insights and Forecast - by End-user Industry
- 7.2.1. Automotive
- 7.2.2. Healthcare
- 7.2.3. Aerospace and Defense
- 7.2.4. Energy and Power
- 7.2.5. Food and Beverage
- 7.2.6. Other End-user Industries
- 7.1. Market Analysis, Insights and Forecast - by Type
- 8. Asia Wireless Proximity Sensor Industry Analysis, Insights and Forecast, 2019-2031
- 8.1. Market Analysis, Insights and Forecast - by Type
- 8.1.1. Pressure Sensors
- 8.1.2. Temperature Sensors
- 8.1.3. Chemical and Gas Sensors
- 8.1.4. Position and Proximity Sensors
- 8.1.5. Other Types of Sensors
- 8.2. Market Analysis, Insights and Forecast - by End-user Industry
- 8.2.1. Automotive
- 8.2.2. Healthcare
- 8.2.3. Aerospace and Defense
- 8.2.4. Energy and Power
- 8.2.5. Food and Beverage
- 8.2.6. Other End-user Industries
- 8.1. Market Analysis, Insights and Forecast - by Type
- 9. Australia and New Zealand Wireless Proximity Sensor Industry Analysis, Insights and Forecast, 2019-2031
- 9.1. Market Analysis, Insights and Forecast - by Type
- 9.1.1. Pressure Sensors
- 9.1.2. Temperature Sensors
- 9.1.3. Chemical and Gas Sensors
- 9.1.4. Position and Proximity Sensors
- 9.1.5. Other Types of Sensors
- 9.2. Market Analysis, Insights and Forecast - by End-user Industry
- 9.2.1. Automotive
- 9.2.2. Healthcare
- 9.2.3. Aerospace and Defense
- 9.2.4. Energy and Power
- 9.2.5. Food and Beverage
- 9.2.6. Other End-user Industries
- 9.1. Market Analysis, Insights and Forecast - by Type
- 10. North America Wireless Proximity Sensor Industry Analysis, Insights and Forecast, 2019-2031
- 10.1. Market Analysis, Insights and Forecast - By Country/Sub-region
- 10.1.1 United States
- 10.1.2 Canada
- 10.1.3 Mexico
- 11. Europe Wireless Proximity Sensor Industry Analysis, Insights and Forecast, 2019-2031
- 11.1. Market Analysis, Insights and Forecast - By Country/Sub-region
- 11.1.1 Germany
- 11.1.2 United Kingdom
- 11.1.3 France
- 11.1.4 Spain
- 11.1.5 Italy
- 11.1.6 Spain
- 11.1.7 Belgium
- 11.1.8 Netherland
- 11.1.9 Nordics
- 11.1.10 Rest of Europe
- 12. Asia Pacific Wireless Proximity Sensor Industry Analysis, Insights and Forecast, 2019-2031
- 12.1. Market Analysis, Insights and Forecast - By Country/Sub-region
- 12.1.1 China
- 12.1.2 Japan
- 12.1.3 India
- 12.1.4 South Korea
- 12.1.5 Southeast Asia
- 12.1.6 Australia
- 12.1.7 Indonesia
- 12.1.8 Phillipes
- 12.1.9 Singapore
- 12.1.10 Thailandc
- 12.1.11 Rest of Asia Pacific
- 13. South America Wireless Proximity Sensor Industry Analysis, Insights and Forecast, 2019-2031
- 13.1. Market Analysis, Insights and Forecast - By Country/Sub-region
- 13.1.1 Brazil
- 13.1.2 Argentina
- 13.1.3 Peru
- 13.1.4 Chile
- 13.1.5 Colombia
- 13.1.6 Ecuador
- 13.1.7 Venezuela
- 13.1.8 Rest of South America
- 14. North America Wireless Proximity Sensor Industry Analysis, Insights and Forecast, 2019-2031
- 14.1. Market Analysis, Insights and Forecast - By Country/Sub-region
- 14.1.1 United States
- 14.1.2 Canada
- 14.1.3 Mexico
- 15. MEA Wireless Proximity Sensor Industry Analysis, Insights and Forecast, 2019-2031
- 15.1. Market Analysis, Insights and Forecast - By Country/Sub-region
- 15.1.1 United Arab Emirates
- 15.1.2 Saudi Arabia
- 15.1.3 South Africa
- 15.1.4 Rest of Middle East and Africa
- 16. Competitive Analysis
- 16.1. Global Market Share Analysis 2024
- 16.2. Company Profiles
- 16.2.1 Honeywell International Inc
- 16.2.1.1. Overview
- 16.2.1.2. Products
- 16.2.1.3. SWOT Analysis
- 16.2.1.4. Recent Developments
- 16.2.1.5. Financials (Based on Availability)
- 16.2.2 ABB Ltd
- 16.2.2.1. Overview
- 16.2.2.2. Products
- 16.2.2.3. SWOT Analysis
- 16.2.2.4. Recent Developments
- 16.2.2.5. Financials (Based on Availability)
- 16.2.3 Monnit Corporation
- 16.2.3.1. Overview
- 16.2.3.2. Products
- 16.2.3.3. SWOT Analysis
- 16.2.3.4. Recent Developments
- 16.2.3.5. Financials (Based on Availability)
- 16.2.4 Emerson Electric Co
- 16.2.4.1. Overview
- 16.2.4.2. Products
- 16.2.4.3. SWOT Analysis
- 16.2.4.4. Recent Developments
- 16.2.4.5. Financials (Based on Availability)
- 16.2.5 Siemens AG
- 16.2.5.1. Overview
- 16.2.5.2. Products
- 16.2.5.3. SWOT Analysis
- 16.2.5.4. Recent Developments
- 16.2.5.5. Financials (Based on Availability)
- 16.2.6 Phoenix Sensors LLC*List Not Exhaustive
- 16.2.6.1. Overview
- 16.2.6.2. Products
- 16.2.6.3. SWOT Analysis
- 16.2.6.4. Recent Developments
- 16.2.6.5. Financials (Based on Availability)
- 16.2.7 Schneider Electric SE
- 16.2.7.1. Overview
- 16.2.7.2. Products
- 16.2.7.3. SWOT Analysis
- 16.2.7.4. Recent Developments
- 16.2.7.5. Financials (Based on Availability)
- 16.2.8 Texas Instruments Incorporated
- 16.2.8.1. Overview
- 16.2.8.2. Products
- 16.2.8.3. SWOT Analysis
- 16.2.8.4. Recent Developments
- 16.2.8.5. Financials (Based on Availability)
- 16.2.9 Rockwell Automation Inc
- 16.2.9.1. Overview
- 16.2.9.2. Products
- 16.2.9.3. SWOT Analysis
- 16.2.9.4. Recent Developments
- 16.2.9.5. Financials (Based on Availability)
- 16.2.10 Pasco Scientific
- 16.2.10.1. Overview
- 16.2.10.2. Products
- 16.2.10.3. SWOT Analysis
- 16.2.10.4. Recent Developments
- 16.2.10.5. Financials (Based on Availability)
- 16.2.1 Honeywell International Inc
List of Figures
- Figure 1: Global Wireless Proximity Sensor Industry Revenue Breakdown (Million, %) by Region 2024 & 2032
- Figure 2: North America Wireless Proximity Sensor Industry Revenue (Million), by Country 2024 & 2032
- Figure 3: North America Wireless Proximity Sensor Industry Revenue Share (%), by Country 2024 & 2032
- Figure 4: Europe Wireless Proximity Sensor Industry Revenue (Million), by Country 2024 & 2032
- Figure 5: Europe Wireless Proximity Sensor Industry Revenue Share (%), by Country 2024 & 2032
- Figure 6: Asia Pacific Wireless Proximity Sensor Industry Revenue (Million), by Country 2024 & 2032
- Figure 7: Asia Pacific Wireless Proximity Sensor Industry Revenue Share (%), by Country 2024 & 2032
- Figure 8: South America Wireless Proximity Sensor Industry Revenue (Million), by Country 2024 & 2032
- Figure 9: South America Wireless Proximity Sensor Industry Revenue Share (%), by Country 2024 & 2032
- Figure 10: North America Wireless Proximity Sensor Industry Revenue (Million), by Country 2024 & 2032
- Figure 11: North America Wireless Proximity Sensor Industry Revenue Share (%), by Country 2024 & 2032
- Figure 12: MEA Wireless Proximity Sensor Industry Revenue (Million), by Country 2024 & 2032
- Figure 13: MEA Wireless Proximity Sensor Industry Revenue Share (%), by Country 2024 & 2032
- Figure 14: North America Wireless Proximity Sensor Industry Revenue (Million), by Type 2024 & 2032
- Figure 15: North America Wireless Proximity Sensor Industry Revenue Share (%), by Type 2024 & 2032
- Figure 16: North America Wireless Proximity Sensor Industry Revenue (Million), by End-user Industry 2024 & 2032
- Figure 17: North America Wireless Proximity Sensor Industry Revenue Share (%), by End-user Industry 2024 & 2032
- Figure 18: North America Wireless Proximity Sensor Industry Revenue (Million), by Country 2024 & 2032
- Figure 19: North America Wireless Proximity Sensor Industry Revenue Share (%), by Country 2024 & 2032
- Figure 20: Europe Wireless Proximity Sensor Industry Revenue (Million), by Type 2024 & 2032
- Figure 21: Europe Wireless Proximity Sensor Industry Revenue Share (%), by Type 2024 & 2032
- Figure 22: Europe Wireless Proximity Sensor Industry Revenue (Million), by End-user Industry 2024 & 2032
- Figure 23: Europe Wireless Proximity Sensor Industry Revenue Share (%), by End-user Industry 2024 & 2032
- Figure 24: Europe Wireless Proximity Sensor Industry Revenue (Million), by Country 2024 & 2032
- Figure 25: Europe Wireless Proximity Sensor Industry Revenue Share (%), by Country 2024 & 2032
- Figure 26: Asia Wireless Proximity Sensor Industry Revenue (Million), by Type 2024 & 2032
- Figure 27: Asia Wireless Proximity Sensor Industry Revenue Share (%), by Type 2024 & 2032
- Figure 28: Asia Wireless Proximity Sensor Industry Revenue (Million), by End-user Industry 2024 & 2032
- Figure 29: Asia Wireless Proximity Sensor Industry Revenue Share (%), by End-user Industry 2024 & 2032
- Figure 30: Asia Wireless Proximity Sensor Industry Revenue (Million), by Country 2024 & 2032
- Figure 31: Asia Wireless Proximity Sensor Industry Revenue Share (%), by Country 2024 & 2032
- Figure 32: Australia and New Zealand Wireless Proximity Sensor Industry Revenue (Million), by Type 2024 & 2032
- Figure 33: Australia and New Zealand Wireless Proximity Sensor Industry Revenue Share (%), by Type 2024 & 2032
- Figure 34: Australia and New Zealand Wireless Proximity Sensor Industry Revenue (Million), by End-user Industry 2024 & 2032
- Figure 35: Australia and New Zealand Wireless Proximity Sensor Industry Revenue Share (%), by End-user Industry 2024 & 2032
- Figure 36: Australia and New Zealand Wireless Proximity Sensor Industry Revenue (Million), by Country 2024 & 2032
- Figure 37: Australia and New Zealand Wireless Proximity Sensor Industry Revenue Share (%), by Country 2024 & 2032
List of Tables
- Table 1: Global Wireless Proximity Sensor Industry Revenue Million Forecast, by Region 2019 & 2032
- Table 2: Global Wireless Proximity Sensor Industry Revenue Million Forecast, by Type 2019 & 2032
- Table 3: Global Wireless Proximity Sensor Industry Revenue Million Forecast, by End-user Industry 2019 & 2032
- Table 4: Global Wireless Proximity Sensor Industry Revenue Million Forecast, by Region 2019 & 2032
- Table 5: Global Wireless Proximity Sensor Industry Revenue Million Forecast, by Country 2019 & 2032
- Table 6: United States Wireless Proximity Sensor Industry Revenue (Million) Forecast, by Application 2019 & 2032
- Table 7: Canada Wireless Proximity Sensor Industry Revenue (Million) Forecast, by Application 2019 & 2032
- Table 8: Mexico Wireless Proximity Sensor Industry Revenue (Million) Forecast, by Application 2019 & 2032
- Table 9: Global Wireless Proximity Sensor Industry Revenue Million Forecast, by Country 2019 & 2032
- Table 10: Germany Wireless Proximity Sensor Industry Revenue (Million) Forecast, by Application 2019 & 2032
- Table 11: United Kingdom Wireless Proximity Sensor Industry Revenue (Million) Forecast, by Application 2019 & 2032
- Table 12: France Wireless Proximity Sensor Industry Revenue (Million) Forecast, by Application 2019 & 2032
- Table 13: Spain Wireless Proximity Sensor Industry Revenue (Million) Forecast, by Application 2019 & 2032
- Table 14: Italy Wireless Proximity Sensor Industry Revenue (Million) Forecast, by Application 2019 & 2032
- Table 15: Spain Wireless Proximity Sensor Industry Revenue (Million) Forecast, by Application 2019 & 2032
- Table 16: Belgium Wireless Proximity Sensor Industry Revenue (Million) Forecast, by Application 2019 & 2032
- Table 17: Netherland Wireless Proximity Sensor Industry Revenue (Million) Forecast, by Application 2019 & 2032
- Table 18: Nordics Wireless Proximity Sensor Industry Revenue (Million) Forecast, by Application 2019 & 2032
- Table 19: Rest of Europe Wireless Proximity Sensor Industry Revenue (Million) Forecast, by Application 2019 & 2032
- Table 20: Global Wireless Proximity Sensor Industry Revenue Million Forecast, by Country 2019 & 2032
- Table 21: China Wireless Proximity Sensor Industry Revenue (Million) Forecast, by Application 2019 & 2032
- Table 22: Japan Wireless Proximity Sensor Industry Revenue (Million) Forecast, by Application 2019 & 2032
- Table 23: India Wireless Proximity Sensor Industry Revenue (Million) Forecast, by Application 2019 & 2032
- Table 24: South Korea Wireless Proximity Sensor Industry Revenue (Million) Forecast, by Application 2019 & 2032
- Table 25: Southeast Asia Wireless Proximity Sensor Industry Revenue (Million) Forecast, by Application 2019 & 2032
- Table 26: Australia Wireless Proximity Sensor Industry Revenue (Million) Forecast, by Application 2019 & 2032
- Table 27: Indonesia Wireless Proximity Sensor Industry Revenue (Million) Forecast, by Application 2019 & 2032
- Table 28: Phillipes Wireless Proximity Sensor Industry Revenue (Million) Forecast, by Application 2019 & 2032
- Table 29: Singapore Wireless Proximity Sensor Industry Revenue (Million) Forecast, by Application 2019 & 2032
- Table 30: Thailandc Wireless Proximity Sensor Industry Revenue (Million) Forecast, by Application 2019 & 2032
- Table 31: Rest of Asia Pacific Wireless Proximity Sensor Industry Revenue (Million) Forecast, by Application 2019 & 2032
- Table 32: Global Wireless Proximity Sensor Industry Revenue Million Forecast, by Country 2019 & 2032
- Table 33: Brazil Wireless Proximity Sensor Industry Revenue (Million) Forecast, by Application 2019 & 2032
- Table 34: Argentina Wireless Proximity Sensor Industry Revenue (Million) Forecast, by Application 2019 & 2032
- Table 35: Peru Wireless Proximity Sensor Industry Revenue (Million) Forecast, by Application 2019 & 2032
- Table 36: Chile Wireless Proximity Sensor Industry Revenue (Million) Forecast, by Application 2019 & 2032
- Table 37: Colombia Wireless Proximity Sensor Industry Revenue (Million) Forecast, by Application 2019 & 2032
- Table 38: Ecuador Wireless Proximity Sensor Industry Revenue (Million) Forecast, by Application 2019 & 2032
- Table 39: Venezuela Wireless Proximity Sensor Industry Revenue (Million) Forecast, by Application 2019 & 2032
- Table 40: Rest of South America Wireless Proximity Sensor Industry Revenue (Million) Forecast, by Application 2019 & 2032
- Table 41: Global Wireless Proximity Sensor Industry Revenue Million Forecast, by Country 2019 & 2032
- Table 42: United States Wireless Proximity Sensor Industry Revenue (Million) Forecast, by Application 2019 & 2032
- Table 43: Canada Wireless Proximity Sensor Industry Revenue (Million) Forecast, by Application 2019 & 2032
- Table 44: Mexico Wireless Proximity Sensor Industry Revenue (Million) Forecast, by Application 2019 & 2032
- Table 45: Global Wireless Proximity Sensor Industry Revenue Million Forecast, by Country 2019 & 2032
- Table 46: United Arab Emirates Wireless Proximity Sensor Industry Revenue (Million) Forecast, by Application 2019 & 2032
- Table 47: Saudi Arabia Wireless Proximity Sensor Industry Revenue (Million) Forecast, by Application 2019 & 2032
- Table 48: South Africa Wireless Proximity Sensor Industry Revenue (Million) Forecast, by Application 2019 & 2032
- Table 49: Rest of Middle East and Africa Wireless Proximity Sensor Industry Revenue (Million) Forecast, by Application 2019 & 2032
- Table 50: Global Wireless Proximity Sensor Industry Revenue Million Forecast, by Type 2019 & 2032
- Table 51: Global Wireless Proximity Sensor Industry Revenue Million Forecast, by End-user Industry 2019 & 2032
- Table 52: Global Wireless Proximity Sensor Industry Revenue Million Forecast, by Country 2019 & 2032
- Table 53: Global Wireless Proximity Sensor Industry Revenue Million Forecast, by Type 2019 & 2032
- Table 54: Global Wireless Proximity Sensor Industry Revenue Million Forecast, by End-user Industry 2019 & 2032
- Table 55: Global Wireless Proximity Sensor Industry Revenue Million Forecast, by Country 2019 & 2032
- Table 56: Global Wireless Proximity Sensor Industry Revenue Million Forecast, by Type 2019 & 2032
- Table 57: Global Wireless Proximity Sensor Industry Revenue Million Forecast, by End-user Industry 2019 & 2032
- Table 58: Global Wireless Proximity Sensor Industry Revenue Million Forecast, by Country 2019 & 2032
- Table 59: Global Wireless Proximity Sensor Industry Revenue Million Forecast, by Type 2019 & 2032
- Table 60: Global Wireless Proximity Sensor Industry Revenue Million Forecast, by End-user Industry 2019 & 2032
- Table 61: Global Wireless Proximity Sensor Industry Revenue Million Forecast, by Country 2019 & 2032
Frequently Asked Questions
1. What is the projected Compound Annual Growth Rate (CAGR) of the Wireless Proximity Sensor Industry?
The projected CAGR is approximately 26.59%.
2. Which companies are prominent players in the Wireless Proximity Sensor Industry?
Key companies in the market include Honeywell International Inc, ABB Ltd, Monnit Corporation, Emerson Electric Co, Siemens AG, Phoenix Sensors LLC*List Not Exhaustive, Schneider Electric SE, Texas Instruments Incorporated, Rockwell Automation Inc, Pasco Scientific.
3. What are the main segments of the Wireless Proximity Sensor Industry?
The market segments include Type, End-user Industry.
4. Can you provide details about the market size?
The market size is estimated to be USD 11.71 Million as of 2022.
5. What are some drivers contributing to market growth?
Increasing Adoption of Wireless Technologies (Especially in Harsh Environments); Emergence of Smart Factory Concepts (Industrial Automation).
6. What are the notable trends driving market growth?
Energy and Power to Hold Significant Market Share.
7. Are there any restraints impacting market growth?
Cost Implications In Line With Retrofits; European Macroeconomic and Geopolitical Factors.
8. Can you provide examples of recent developments in the market?
August 2022 - Emerson announced the opening of a Cumbernauld, Scotland facility equipped with engineering, development, and manufacturing resources for sensor, mechanical, electronics, and software design for the company's gas analysis portfolio. Spurred by the demand to reduce the environmental impact of industrial process facilities, the new gas analysis solutions center will produce more than ten different sensing technologies that can measure more than 60 various gas components, delivering on Emerson's commitment to supporting customers' decarbonization efforts.
9. What pricing options are available for accessing the report?
Pricing options include single-user, multi-user, and enterprise licenses priced at USD 4750, USD 5250, and USD 8750 respectively.
10. Is the market size provided in terms of value or volume?
The market size is provided in terms of value, measured in Million.
11. Are there any specific market keywords associated with the report?
Yes, the market keyword associated with the report is "Wireless Proximity Sensor Industry," which aids in identifying and referencing the specific market segment covered.
12. How do I determine which pricing option suits my needs best?
The pricing options vary based on user requirements and access needs. Individual users may opt for single-user licenses, while businesses requiring broader access may choose multi-user or enterprise licenses for cost-effective access to the report.
13. Are there any additional resources or data provided in the Wireless Proximity Sensor Industry report?
While the report offers comprehensive insights, it's advisable to review the specific contents or supplementary materials provided to ascertain if additional resources or data are available.
14. How can I stay updated on further developments or reports in the Wireless Proximity Sensor Industry?
To stay informed about further developments, trends, and reports in the Wireless Proximity Sensor Industry, consider subscribing to industry newsletters, following relevant companies and organizations, or regularly checking reputable industry news sources and publications.
Methodology
Step 1 - Identification of Relevant Samples Size from Population Database


Step 2 - Approaches for Defining Global Market Size (Value, Volume* & Price*)

Note*: In applicable scenarios
Step 3 - Data Sources
Primary Research
- Web Analytics
- Survey Reports
- Research Institute
- Latest Research Reports
- Opinion Leaders
Secondary Research
- Annual Reports
- White Paper
- Latest Press Release
- Industry Association
- Paid Database
- Investor Presentations

Step 4 - Data Triangulation
Involves using different sources of information in order to increase the validity of a study
These sources are likely to be stakeholders in a program - participants, other researchers, program staff, other community members, and so on.
Then we put all data in single framework & apply various statistical tools to find out the dynamic on the market.
During the analysis stage, feedback from the stakeholder groups would be compared to determine areas of agreement as well as areas of divergence
