

Key Insights
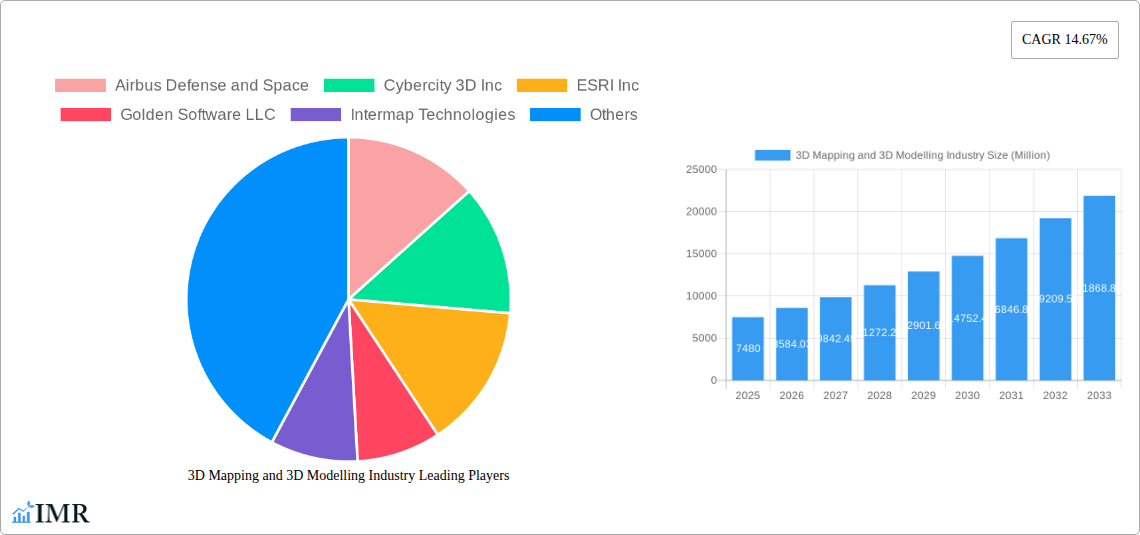
The global 3D mapping and 3D modeling market is experiencing robust expansion, projected to reach USD 7.48 billion with an impressive Compound Annual Growth Rate (CAGR) of 14.67%. This significant growth is fueled by an increasing demand for immersive digital experiences and sophisticated visualization tools across diverse industries. Key drivers include the burgeoning entertainment and media sector, where 3D modeling is essential for creating realistic visual effects, animation, and virtual environments for gaming and film production. The automotive industry is a major contributor, utilizing 3D mapping for advanced driver-assistance systems (ADAS), autonomous vehicle development, and in-car navigation. Furthermore, the healthcare sector is adopting 3D modeling for surgical planning, anatomical visualization, and medical device design, enhancing precision and patient outcomes. Building and construction projects are increasingly leveraging 3D mapping for detailed site analysis, architectural visualization, and project management.
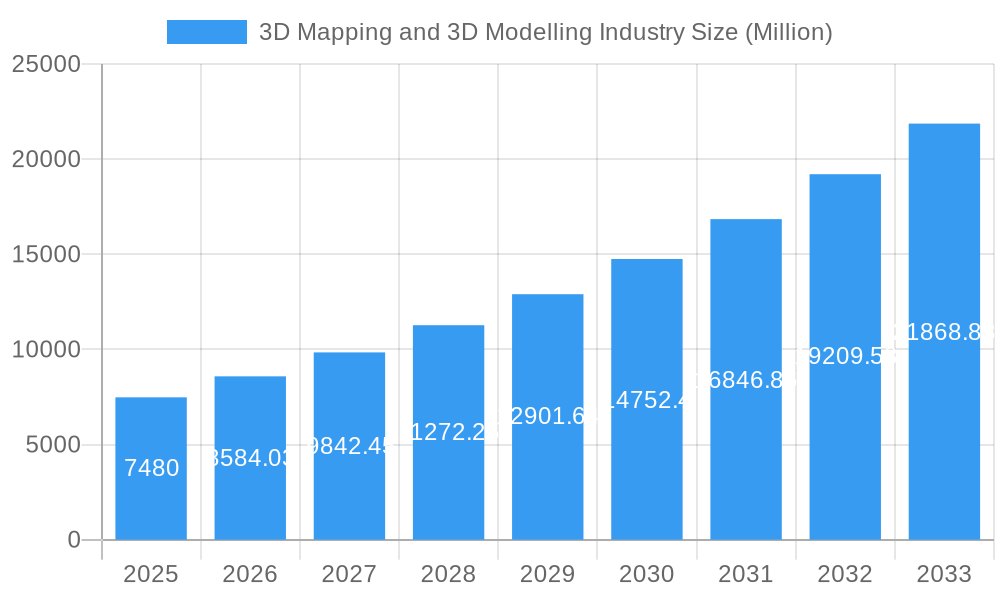
3D Mapping and 3D Modelling Industry Market Size (In Billion)
Emerging trends in the 3D mapping and modeling landscape include the integration of artificial intelligence (AI) and machine learning (ML) for automated data processing and content creation, leading to greater efficiency and accuracy. The rise of augmented reality (AR) and virtual reality (VR) technologies is further propelling demand for high-fidelity 3D content. While the market exhibits strong growth, certain restraints exist, such as the high cost of sophisticated software and hardware, and the requirement for specialized skilled professionals. However, the continuous innovation in photogrammetry, LiDAR, and 3D scanning technologies, coupled with the increasing accessibility of cloud-based 3D platforms, is expected to mitigate these challenges. The market segmentation reveals a diverse application spectrum, from sophisticated projection and texture mapping to critical functions in maps and navigation. The widespread adoption by end-user verticals underscores the pervasive influence and utility of 3D mapping and modeling technologies in shaping modern digital landscapes and operational efficiencies.
3D Mapping and 3D Modelling Industry Company Market Share
Unlocking the Future: Comprehensive 3D Mapping and 3D Modelling Industry Report (2019-2033)
Dive deep into the rapidly evolving world of 3D Mapping and 3D Modelling. This definitive report provides an unparalleled analysis of market dynamics, growth trends, regional dominance, and the competitive landscape. Essential for industry professionals, investors, and strategists seeking to understand and capitalize on the immense opportunities within this transformative sector.
3D Mapping and 3D Modelling Industry Market Dynamics & Structure
The 3D Mapping and 3D Modelling industry is characterized by a moderate market concentration, with a blend of large, established players and agile, innovative startups. Technological innovation is a primary driver, fueled by advancements in lidar, photogrammetry, AI, and cloud computing, enabling higher accuracy, faster processing, and more realistic digital twins. Regulatory frameworks are increasingly taking shape, particularly concerning data privacy, accuracy standards for surveying, and intellectual property rights for digital assets. Competitive product substitutes, while not direct replacements, include traditional 2D mapping and visualization techniques, which are gradually being displaced by the richer insights offered by 3D. End-user demographics are diversifying, with an increasing demand from sectors beyond the traditional AEC (Architecture, Engineering, and Construction) and defense industries, now including entertainment, automotive, and healthcare. Mergers and acquisitions (M&A) trends indicate a consolidation of market share as larger companies acquire specialized technology providers to expand their offerings and market reach.
- Market Concentration: Moderate, with a mix of established leaders and emerging innovators.
- Technological Innovation Drivers: Lidar, photogrammetry, AI, cloud computing, IoT integration.
- Regulatory Landscape: Developing, with a focus on data privacy, accuracy, and IP.
- Competitive Substitutes: Traditional 2D mapping, manual visualization methods.
- End-User Demographics: Expanding beyond AEC and defense to include media, automotive, and healthcare.
- M&A Trends: Strategic acquisitions for technology integration and market expansion.
3D Mapping and 3D Modelling Industry Growth Trends & Insights
The 3D Mapping and 3D Modelling industry is poised for substantial growth, projected to expand from an estimated market size of $15,500 million in the base year of 2025 to $38,200 million by 2033, exhibiting a Compound Annual Growth Rate (CAGR) of approximately 12.5% over the forecast period. This remarkable expansion is underpinned by escalating adoption rates across a multitude of sectors, driven by the inherent value proposition of enhanced visualization, simulation, and data analysis capabilities. Technological disruptions, such as the proliferation of drones, advanced sensors, and sophisticated software algorithms, are continuously lowering entry barriers and improving the precision and efficiency of 3D data acquisition and processing. Consumer behavior shifts are also playing a crucial role, with a growing expectation for immersive and interactive experiences, whether in gaming, virtual tours, or augmented reality applications. The ability to create detailed digital twins of physical assets and environments is revolutionizing industries from urban planning and infrastructure management to product design and medical simulations. Furthermore, the increasing affordability and accessibility of 3D modeling software and hardware are democratizing the technology, enabling smaller businesses and individual creators to leverage its power. The integration of 3D data with AI and machine learning is unlocking new frontiers in data interpretation and predictive analytics, further solidifying the industry's growth trajectory. The transition from niche applications to mainstream adoption signifies a fundamental shift in how the world is perceived, interacted with, and managed.
Dominant Regions, Countries, or Segments in 3D Mapping and 3D Modelling Industry
North America is emerging as a dominant region in the 3D Mapping and 3D Modelling industry, driven by a robust technological ecosystem, significant government investments in infrastructure and defense, and a high rate of adoption across key end-user verticals. The United States, in particular, leads with its concentration of leading technology companies, extensive research and development capabilities, and a strong demand for advanced visualization solutions in sectors like building and construction, transportation, and entertainment. The proliferation of smart city initiatives and the increasing use of 3D mapping for urban planning, infrastructure monitoring, and disaster management further fuel this dominance.
- Dominant Region: North America (led by the United States)
- Key Drivers in North America:
- Technological Advancement: Early adoption and development of cutting-edge 3D technologies.
- Government Investment: Significant funding in defense, infrastructure (e.g., transportation networks, smart cities), and research.
- Industry Adoption: High penetration in building and construction, defense, and the burgeoning entertainment and media sectors.
- Talent Pool: Presence of skilled professionals in software development, data science, and geospatial engineering.
- Market Size & Spending: High disposable income and corporate spending on advanced visualization and digital twin technologies.
Within the Type segment, 3D Mapping holds a significant market share due to its foundational role in creating accurate digital representations of the physical world, essential for navigation, planning, and asset management. Its applications in autonomous vehicles, geospatial analysis, and infrastructure development are vast and growing.
- Dominant Segment (Type): 3D Mapping
- Growth Potential in 3D Mapping: Driven by autonomous systems, smart city development, and large-scale infrastructure projects.
In terms of Application, Maps and Navigation represent a colossal market, with the increasing demand for real-time, immersive, and accurate navigation systems in automotive, logistics, and personal devices. This segment is continuously evolving with the integration of AR and AI.
- Dominant Segment (Application): Maps and Navigation
- Market Drivers for Maps and Navigation:
- Automotive Industry: Integration in advanced driver-assistance systems (ADAS) and autonomous driving.
- Logistics and Supply Chain: Real-time tracking and route optimization.
- Consumer Electronics: Enhanced GPS and AR-enabled mapping applications.
The End-user Vertical showing the most dynamic growth and significant market contribution is Building and Construction. The adoption of Building Information Modeling (BIM) and the creation of digital twins for design, construction, and facility management have made 3D modelling indispensable.
- Dominant Segment (End-user Vertical): Building and Construction
- Impact on Building and Construction:
- Improved design visualization and clash detection.
- Enhanced construction planning and progress monitoring.
- Efficient facility management and maintenance through digital twins.
- Reduced rework and cost overruns.
3D Mapping and 3D Modelling Industry Product Landscape
The product landscape is marked by continuous innovation, offering sophisticated software solutions and hardware integrated with advanced sensors for precise data capture. Key innovations include real-time rendering engines, cloud-based collaborative platforms, and AI-powered automated feature extraction. Applications span from creating photorealistic virtual environments for gaming and film (e.g., The Foundry Visionmongers Ltd's tools) to developing highly accurate digital twins of cities and infrastructure for planning and management (e.g., ESRI Inc, Bentley Systems Inc). Performance metrics are constantly improving, with faster processing speeds, higher geometric accuracy, and reduced data file sizes, making 3D solutions more accessible and practical across various industries.
Key Drivers, Barriers & Challenges in 3D Mapping and 3D Modelling Industry
Key Drivers:
- Technological Advancements: Continuous innovation in sensor technology (lidar, photogrammetry), AI for data processing and analysis, and cloud computing for scalability and accessibility are major catalysts. The demand for higher accuracy and more detailed digital representations is a constant impetus.
- Increasing Demand for Digital Twins: The creation of virtual replicas of physical assets and environments is revolutionizing industries like manufacturing, urban planning, and infrastructure management, driving significant market growth.
- Growth in AR/VR and Metaverse: The burgeoning popularity of augmented reality, virtual reality, and the concept of the metaverse necessitates the creation of immersive 3D content and environments, boosting demand for 3D modelling and mapping.
- Adoption in Emerging Industries: Expansion into sectors like healthcare (surgical planning, anatomical modeling), automotive (autonomous driving simulations), and entertainment (gaming, film production) is broadening the market scope.
Barriers & Challenges:
- High Initial Investment: The cost of advanced 3D scanning hardware, specialized software, and skilled personnel can be a significant barrier for smaller enterprises and certain developing regions.
- Data Processing and Storage Demands: Large-scale 3D datasets require substantial computational power and storage capacity, posing technical and logistical challenges.
- Interoperability and Standardization Issues: Lack of universal standards for 3D data formats can lead to interoperability problems between different software and platforms, hindering seamless workflows.
- Skill Gap: A shortage of skilled professionals capable of operating advanced 3D mapping and modelling tools and interpreting complex data can limit adoption and efficiency.
- Data Accuracy and Quality Control: Ensuring the accuracy and quality of captured 3D data is paramount, and any errors can have significant downstream consequences, especially in critical applications like infrastructure and defense.
Emerging Opportunities in 3D Mapping and 3D Modelling Industry
Emerging opportunities lie in the hyper-personalization of 3D content for individual users and the increasing demand for real-time 3D data integration within the Internet of Things (IoT) ecosystem. The development of AI-driven automated 3D model generation from 2D images and the expansion of 3D mapping into underwater and subterranean environments present untapped markets. Furthermore, the growing need for digital preservation of cultural heritage sites and the use of 3D for personalized medicine are significant growth avenues. The continued evolution of the metaverse will also unlock novel business models and creative applications for 3D mapping and modelling.
Growth Accelerators in the 3D Mapping and 3D Modelling Industry Industry
Long-term growth will be significantly accelerated by the continued advancements in AI and machine learning for automated data processing and predictive analytics, enabling more intelligent and efficient use of 3D data. Strategic partnerships between hardware manufacturers, software developers, and end-user industries will foster innovation and create integrated solutions tailored to specific needs. The global expansion of smart city initiatives, coupled with increased investments in sustainable infrastructure and smart transportation, will continue to drive demand for sophisticated 3D mapping and modelling. Furthermore, the democratization of 3D technologies through more accessible software and cloud-based platforms will broaden market reach and foster a new wave of innovation.
Key Players Shaping the 3D Mapping and 3D Modelling Industry Market
- Airbus Defense and Space
- Cybercity 3D Inc
- ESRI Inc
- Golden Software LLC
- Intermap Technologies
- The Foundry Visionmongers Ltd
- Autodesk Inc
- Topcon Positioning Systems Inc
- Trimble Inc
- Bentley Systems Inc
- Saab AB
Notable Milestones in 3D Mapping and 3D Modelling Industry Sector
- 2019: Increased adoption of drone-based lidar for infrastructure inspection and surveying.
- 2020: Major advancements in real-time 3D rendering for gaming and virtual production.
- 2021: Growth in the use of digital twins for smart city planning and management.
- 2022: Significant investments in AI-powered 3D reconstruction and analysis tools.
- 2023: Expansion of 3D mapping applications in autonomous vehicle development and simulation.
- 2024: Growing interest in metaverse development and its reliance on detailed 3D environments.
In-Depth 3D Mapping and 3D Modelling Industry Market Outlook
The future of the 3D Mapping and 3D Modelling industry is exceptionally bright, characterized by sustained high growth driven by technological convergence and expanding application frontiers. The integration of AI, IoT, and advanced sensor technologies will continue to enhance accuracy, efficiency, and the creation of intelligent digital twins. The metaverse's evolution will act as a significant growth accelerator, demanding ever more sophisticated and immersive 3D environments. Strategic collaborations and a focus on accessible, scalable cloud-based solutions will democratize the technology further, unlocking new opportunities in diverse sectors. The industry is poised to redefine how we interact with, understand, and build our physical and digital worlds.
3D Mapping and 3D Modelling Industry Segmentation
-
1. Type
- 1.1. 3D Mapping
- 1.2. 3D Modeling
-
2. Application
- 2.1. Projection Mapping
- 2.2. Texture Mapping
- 2.3. Maps and Navigation
- 2.4. Other Applications
-
3. End-user Vertical
- 3.1. Entertainment and Media
- 3.2. Automotive
- 3.3. Healthcare
- 3.4. Building and Construction
- 3.5. Defense
- 3.6. Transportation
- 3.7. Other End-user Verticals
3D Mapping and 3D Modelling Industry Segmentation By Geography
- 1. North America
- 2. Europe
- 3. Asia
- 4. Australia and New Zealand
- 5. Latin America
- 6. Middle East and Africa
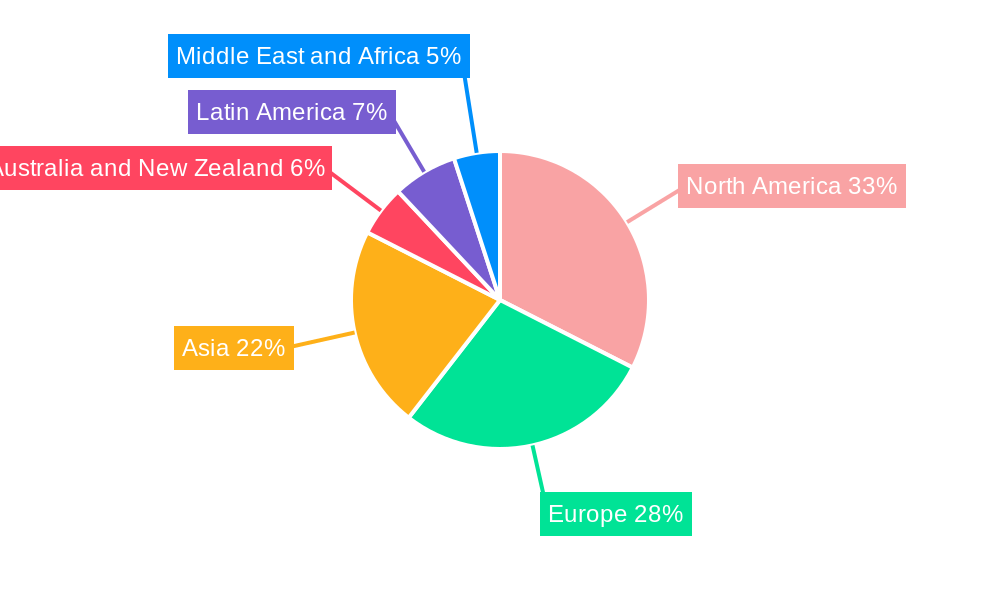
3D Mapping and 3D Modelling Industry Regional Market Share
Geographic Coverage of 3D Mapping and 3D Modelling Industry
3D Mapping and 3D Modelling Industry REPORT HIGHLIGHTS
| Aspects | Details |
|---|---|
| Study Period | 2020-2034 |
| Base Year | 2025 |
| Estimated Year | 2026 |
| Forecast Period | 2026-2034 |
| Historical Period | 2020-2025 |
| Growth Rate | CAGR of 14.67% from 2020-2034 |
| Segmentation |
|
Table of Contents
- 1. Introduction
- 1.1. Research Scope
- 1.2. Market Segmentation
- 1.3. Research Methodology
- 1.4. Definitions and Assumptions
- 2. Executive Summary
- 2.1. Introduction
- 3. Market Dynamics
- 3.1. Introduction
- 3.2. Market Drivers
- 3.2.1 Advent of 3D-enabled Display Devices; Advancement of 3D Scanners
- 3.2.2 3D Sensors
- 3.2.3 and Other Acquisition Devices
- 3.3. Market Restrains
- 3.3.1. High Initial Investments
- 3.4. Market Trends
- 3.4.1. Entertainment and Media Segment would Contribute Significantly to the Market Growth
- 4. Market Factor Analysis
- 4.1. Porters Five Forces
- 4.2. Supply/Value Chain
- 4.3. PESTEL analysis
- 4.4. Market Entropy
- 4.5. Patent/Trademark Analysis
- 5. Global 3D Mapping and 3D Modelling Industry Analysis, Insights and Forecast, 2020-2032
- 5.1. Market Analysis, Insights and Forecast - by Type
- 5.1.1. 3D Mapping
- 5.1.2. 3D Modeling
- 5.2. Market Analysis, Insights and Forecast - by Application
- 5.2.1. Projection Mapping
- 5.2.2. Texture Mapping
- 5.2.3. Maps and Navigation
- 5.2.4. Other Applications
- 5.3. Market Analysis, Insights and Forecast - by End-user Vertical
- 5.3.1. Entertainment and Media
- 5.3.2. Automotive
- 5.3.3. Healthcare
- 5.3.4. Building and Construction
- 5.3.5. Defense
- 5.3.6. Transportation
- 5.3.7. Other End-user Verticals
- 5.4. Market Analysis, Insights and Forecast - by Region
- 5.4.1. North America
- 5.4.2. Europe
- 5.4.3. Asia
- 5.4.4. Australia and New Zealand
- 5.4.5. Latin America
- 5.4.6. Middle East and Africa
- 5.1. Market Analysis, Insights and Forecast - by Type
- 6. North America 3D Mapping and 3D Modelling Industry Analysis, Insights and Forecast, 2020-2032
- 6.1. Market Analysis, Insights and Forecast - by Type
- 6.1.1. 3D Mapping
- 6.1.2. 3D Modeling
- 6.2. Market Analysis, Insights and Forecast - by Application
- 6.2.1. Projection Mapping
- 6.2.2. Texture Mapping
- 6.2.3. Maps and Navigation
- 6.2.4. Other Applications
- 6.3. Market Analysis, Insights and Forecast - by End-user Vertical
- 6.3.1. Entertainment and Media
- 6.3.2. Automotive
- 6.3.3. Healthcare
- 6.3.4. Building and Construction
- 6.3.5. Defense
- 6.3.6. Transportation
- 6.3.7. Other End-user Verticals
- 6.1. Market Analysis, Insights and Forecast - by Type
- 7. Europe 3D Mapping and 3D Modelling Industry Analysis, Insights and Forecast, 2020-2032
- 7.1. Market Analysis, Insights and Forecast - by Type
- 7.1.1. 3D Mapping
- 7.1.2. 3D Modeling
- 7.2. Market Analysis, Insights and Forecast - by Application
- 7.2.1. Projection Mapping
- 7.2.2. Texture Mapping
- 7.2.3. Maps and Navigation
- 7.2.4. Other Applications
- 7.3. Market Analysis, Insights and Forecast - by End-user Vertical
- 7.3.1. Entertainment and Media
- 7.3.2. Automotive
- 7.3.3. Healthcare
- 7.3.4. Building and Construction
- 7.3.5. Defense
- 7.3.6. Transportation
- 7.3.7. Other End-user Verticals
- 7.1. Market Analysis, Insights and Forecast - by Type
- 8. Asia 3D Mapping and 3D Modelling Industry Analysis, Insights and Forecast, 2020-2032
- 8.1. Market Analysis, Insights and Forecast - by Type
- 8.1.1. 3D Mapping
- 8.1.2. 3D Modeling
- 8.2. Market Analysis, Insights and Forecast - by Application
- 8.2.1. Projection Mapping
- 8.2.2. Texture Mapping
- 8.2.3. Maps and Navigation
- 8.2.4. Other Applications
- 8.3. Market Analysis, Insights and Forecast - by End-user Vertical
- 8.3.1. Entertainment and Media
- 8.3.2. Automotive
- 8.3.3. Healthcare
- 8.3.4. Building and Construction
- 8.3.5. Defense
- 8.3.6. Transportation
- 8.3.7. Other End-user Verticals
- 8.1. Market Analysis, Insights and Forecast - by Type
- 9. Australia and New Zealand 3D Mapping and 3D Modelling Industry Analysis, Insights and Forecast, 2020-2032
- 9.1. Market Analysis, Insights and Forecast - by Type
- 9.1.1. 3D Mapping
- 9.1.2. 3D Modeling
- 9.2. Market Analysis, Insights and Forecast - by Application
- 9.2.1. Projection Mapping
- 9.2.2. Texture Mapping
- 9.2.3. Maps and Navigation
- 9.2.4. Other Applications
- 9.3. Market Analysis, Insights and Forecast - by End-user Vertical
- 9.3.1. Entertainment and Media
- 9.3.2. Automotive
- 9.3.3. Healthcare
- 9.3.4. Building and Construction
- 9.3.5. Defense
- 9.3.6. Transportation
- 9.3.7. Other End-user Verticals
- 9.1. Market Analysis, Insights and Forecast - by Type
- 10. Latin America 3D Mapping and 3D Modelling Industry Analysis, Insights and Forecast, 2020-2032
- 10.1. Market Analysis, Insights and Forecast - by Type
- 10.1.1. 3D Mapping
- 10.1.2. 3D Modeling
- 10.2. Market Analysis, Insights and Forecast - by Application
- 10.2.1. Projection Mapping
- 10.2.2. Texture Mapping
- 10.2.3. Maps and Navigation
- 10.2.4. Other Applications
- 10.3. Market Analysis, Insights and Forecast - by End-user Vertical
- 10.3.1. Entertainment and Media
- 10.3.2. Automotive
- 10.3.3. Healthcare
- 10.3.4. Building and Construction
- 10.3.5. Defense
- 10.3.6. Transportation
- 10.3.7. Other End-user Verticals
- 10.1. Market Analysis, Insights and Forecast - by Type
- 11. Middle East and Africa 3D Mapping and 3D Modelling Industry Analysis, Insights and Forecast, 2020-2032
- 11.1. Market Analysis, Insights and Forecast - by Type
- 11.1.1. 3D Mapping
- 11.1.2. 3D Modeling
- 11.2. Market Analysis, Insights and Forecast - by Application
- 11.2.1. Projection Mapping
- 11.2.2. Texture Mapping
- 11.2.3. Maps and Navigation
- 11.2.4. Other Applications
- 11.3. Market Analysis, Insights and Forecast - by End-user Vertical
- 11.3.1. Entertainment and Media
- 11.3.2. Automotive
- 11.3.3. Healthcare
- 11.3.4. Building and Construction
- 11.3.5. Defense
- 11.3.6. Transportation
- 11.3.7. Other End-user Verticals
- 11.1. Market Analysis, Insights and Forecast - by Type
- 12. Competitive Analysis
- 12.1. Global Market Share Analysis 2025
- 12.2. Company Profiles
- 12.2.1 Airbus Defense and Space
- 12.2.1.1. Overview
- 12.2.1.2. Products
- 12.2.1.3. SWOT Analysis
- 12.2.1.4. Recent Developments
- 12.2.1.5. Financials (Based on Availability)
- 12.2.2 Cybercity 3D Inc
- 12.2.2.1. Overview
- 12.2.2.2. Products
- 12.2.2.3. SWOT Analysis
- 12.2.2.4. Recent Developments
- 12.2.2.5. Financials (Based on Availability)
- 12.2.3 ESRI Inc
- 12.2.3.1. Overview
- 12.2.3.2. Products
- 12.2.3.3. SWOT Analysis
- 12.2.3.4. Recent Developments
- 12.2.3.5. Financials (Based on Availability)
- 12.2.4 Golden Software LLC
- 12.2.4.1. Overview
- 12.2.4.2. Products
- 12.2.4.3. SWOT Analysis
- 12.2.4.4. Recent Developments
- 12.2.4.5. Financials (Based on Availability)
- 12.2.5 Intermap Technologies
- 12.2.5.1. Overview
- 12.2.5.2. Products
- 12.2.5.3. SWOT Analysis
- 12.2.5.4. Recent Developments
- 12.2.5.5. Financials (Based on Availability)
- 12.2.6 The Foundry Visionmongers Ltd
- 12.2.6.1. Overview
- 12.2.6.2. Products
- 12.2.6.3. SWOT Analysis
- 12.2.6.4. Recent Developments
- 12.2.6.5. Financials (Based on Availability)
- 12.2.7 Autodesk Inc
- 12.2.7.1. Overview
- 12.2.7.2. Products
- 12.2.7.3. SWOT Analysis
- 12.2.7.4. Recent Developments
- 12.2.7.5. Financials (Based on Availability)
- 12.2.8 Topcon Positioning Systems Inc
- 12.2.8.1. Overview
- 12.2.8.2. Products
- 12.2.8.3. SWOT Analysis
- 12.2.8.4. Recent Developments
- 12.2.8.5. Financials (Based on Availability)
- 12.2.9 Trimble Inc
- 12.2.9.1. Overview
- 12.2.9.2. Products
- 12.2.9.3. SWOT Analysis
- 12.2.9.4. Recent Developments
- 12.2.9.5. Financials (Based on Availability)
- 12.2.10 Bentley Systems Inc
- 12.2.10.1. Overview
- 12.2.10.2. Products
- 12.2.10.3. SWOT Analysis
- 12.2.10.4. Recent Developments
- 12.2.10.5. Financials (Based on Availability)
- 12.2.11 Saab AB
- 12.2.11.1. Overview
- 12.2.11.2. Products
- 12.2.11.3. SWOT Analysis
- 12.2.11.4. Recent Developments
- 12.2.11.5. Financials (Based on Availability)
- 12.2.1 Airbus Defense and Space
List of Figures
- Figure 1: Global 3D Mapping and 3D Modelling Industry Revenue Breakdown (Million, %) by Region 2025 & 2033
- Figure 2: Global 3D Mapping and 3D Modelling Industry Volume Breakdown (K Unit, %) by Region 2025 & 2033
- Figure 3: North America 3D Mapping and 3D Modelling Industry Revenue (Million), by Type 2025 & 2033
- Figure 4: North America 3D Mapping and 3D Modelling Industry Volume (K Unit), by Type 2025 & 2033
- Figure 5: North America 3D Mapping and 3D Modelling Industry Revenue Share (%), by Type 2025 & 2033
- Figure 6: North America 3D Mapping and 3D Modelling Industry Volume Share (%), by Type 2025 & 2033
- Figure 7: North America 3D Mapping and 3D Modelling Industry Revenue (Million), by Application 2025 & 2033
- Figure 8: North America 3D Mapping and 3D Modelling Industry Volume (K Unit), by Application 2025 & 2033
- Figure 9: North America 3D Mapping and 3D Modelling Industry Revenue Share (%), by Application 2025 & 2033
- Figure 10: North America 3D Mapping and 3D Modelling Industry Volume Share (%), by Application 2025 & 2033
- Figure 11: North America 3D Mapping and 3D Modelling Industry Revenue (Million), by End-user Vertical 2025 & 2033
- Figure 12: North America 3D Mapping and 3D Modelling Industry Volume (K Unit), by End-user Vertical 2025 & 2033
- Figure 13: North America 3D Mapping and 3D Modelling Industry Revenue Share (%), by End-user Vertical 2025 & 2033
- Figure 14: North America 3D Mapping and 3D Modelling Industry Volume Share (%), by End-user Vertical 2025 & 2033
- Figure 15: North America 3D Mapping and 3D Modelling Industry Revenue (Million), by Country 2025 & 2033
- Figure 16: North America 3D Mapping and 3D Modelling Industry Volume (K Unit), by Country 2025 & 2033
- Figure 17: North America 3D Mapping and 3D Modelling Industry Revenue Share (%), by Country 2025 & 2033
- Figure 18: North America 3D Mapping and 3D Modelling Industry Volume Share (%), by Country 2025 & 2033
- Figure 19: Europe 3D Mapping and 3D Modelling Industry Revenue (Million), by Type 2025 & 2033
- Figure 20: Europe 3D Mapping and 3D Modelling Industry Volume (K Unit), by Type 2025 & 2033
- Figure 21: Europe 3D Mapping and 3D Modelling Industry Revenue Share (%), by Type 2025 & 2033
- Figure 22: Europe 3D Mapping and 3D Modelling Industry Volume Share (%), by Type 2025 & 2033
- Figure 23: Europe 3D Mapping and 3D Modelling Industry Revenue (Million), by Application 2025 & 2033
- Figure 24: Europe 3D Mapping and 3D Modelling Industry Volume (K Unit), by Application 2025 & 2033
- Figure 25: Europe 3D Mapping and 3D Modelling Industry Revenue Share (%), by Application 2025 & 2033
- Figure 26: Europe 3D Mapping and 3D Modelling Industry Volume Share (%), by Application 2025 & 2033
- Figure 27: Europe 3D Mapping and 3D Modelling Industry Revenue (Million), by End-user Vertical 2025 & 2033
- Figure 28: Europe 3D Mapping and 3D Modelling Industry Volume (K Unit), by End-user Vertical 2025 & 2033
- Figure 29: Europe 3D Mapping and 3D Modelling Industry Revenue Share (%), by End-user Vertical 2025 & 2033
- Figure 30: Europe 3D Mapping and 3D Modelling Industry Volume Share (%), by End-user Vertical 2025 & 2033
- Figure 31: Europe 3D Mapping and 3D Modelling Industry Revenue (Million), by Country 2025 & 2033
- Figure 32: Europe 3D Mapping and 3D Modelling Industry Volume (K Unit), by Country 2025 & 2033
- Figure 33: Europe 3D Mapping and 3D Modelling Industry Revenue Share (%), by Country 2025 & 2033
- Figure 34: Europe 3D Mapping and 3D Modelling Industry Volume Share (%), by Country 2025 & 2033
- Figure 35: Asia 3D Mapping and 3D Modelling Industry Revenue (Million), by Type 2025 & 2033
- Figure 36: Asia 3D Mapping and 3D Modelling Industry Volume (K Unit), by Type 2025 & 2033
- Figure 37: Asia 3D Mapping and 3D Modelling Industry Revenue Share (%), by Type 2025 & 2033
- Figure 38: Asia 3D Mapping and 3D Modelling Industry Volume Share (%), by Type 2025 & 2033
- Figure 39: Asia 3D Mapping and 3D Modelling Industry Revenue (Million), by Application 2025 & 2033
- Figure 40: Asia 3D Mapping and 3D Modelling Industry Volume (K Unit), by Application 2025 & 2033
- Figure 41: Asia 3D Mapping and 3D Modelling Industry Revenue Share (%), by Application 2025 & 2033
- Figure 42: Asia 3D Mapping and 3D Modelling Industry Volume Share (%), by Application 2025 & 2033
- Figure 43: Asia 3D Mapping and 3D Modelling Industry Revenue (Million), by End-user Vertical 2025 & 2033
- Figure 44: Asia 3D Mapping and 3D Modelling Industry Volume (K Unit), by End-user Vertical 2025 & 2033
- Figure 45: Asia 3D Mapping and 3D Modelling Industry Revenue Share (%), by End-user Vertical 2025 & 2033
- Figure 46: Asia 3D Mapping and 3D Modelling Industry Volume Share (%), by End-user Vertical 2025 & 2033
- Figure 47: Asia 3D Mapping and 3D Modelling Industry Revenue (Million), by Country 2025 & 2033
- Figure 48: Asia 3D Mapping and 3D Modelling Industry Volume (K Unit), by Country 2025 & 2033
- Figure 49: Asia 3D Mapping and 3D Modelling Industry Revenue Share (%), by Country 2025 & 2033
- Figure 50: Asia 3D Mapping and 3D Modelling Industry Volume Share (%), by Country 2025 & 2033
- Figure 51: Australia and New Zealand 3D Mapping and 3D Modelling Industry Revenue (Million), by Type 2025 & 2033
- Figure 52: Australia and New Zealand 3D Mapping and 3D Modelling Industry Volume (K Unit), by Type 2025 & 2033
- Figure 53: Australia and New Zealand 3D Mapping and 3D Modelling Industry Revenue Share (%), by Type 2025 & 2033
- Figure 54: Australia and New Zealand 3D Mapping and 3D Modelling Industry Volume Share (%), by Type 2025 & 2033
- Figure 55: Australia and New Zealand 3D Mapping and 3D Modelling Industry Revenue (Million), by Application 2025 & 2033
- Figure 56: Australia and New Zealand 3D Mapping and 3D Modelling Industry Volume (K Unit), by Application 2025 & 2033
- Figure 57: Australia and New Zealand 3D Mapping and 3D Modelling Industry Revenue Share (%), by Application 2025 & 2033
- Figure 58: Australia and New Zealand 3D Mapping and 3D Modelling Industry Volume Share (%), by Application 2025 & 2033
- Figure 59: Australia and New Zealand 3D Mapping and 3D Modelling Industry Revenue (Million), by End-user Vertical 2025 & 2033
- Figure 60: Australia and New Zealand 3D Mapping and 3D Modelling Industry Volume (K Unit), by End-user Vertical 2025 & 2033
- Figure 61: Australia and New Zealand 3D Mapping and 3D Modelling Industry Revenue Share (%), by End-user Vertical 2025 & 2033
- Figure 62: Australia and New Zealand 3D Mapping and 3D Modelling Industry Volume Share (%), by End-user Vertical 2025 & 2033
- Figure 63: Australia and New Zealand 3D Mapping and 3D Modelling Industry Revenue (Million), by Country 2025 & 2033
- Figure 64: Australia and New Zealand 3D Mapping and 3D Modelling Industry Volume (K Unit), by Country 2025 & 2033
- Figure 65: Australia and New Zealand 3D Mapping and 3D Modelling Industry Revenue Share (%), by Country 2025 & 2033
- Figure 66: Australia and New Zealand 3D Mapping and 3D Modelling Industry Volume Share (%), by Country 2025 & 2033
- Figure 67: Latin America 3D Mapping and 3D Modelling Industry Revenue (Million), by Type 2025 & 2033
- Figure 68: Latin America 3D Mapping and 3D Modelling Industry Volume (K Unit), by Type 2025 & 2033
- Figure 69: Latin America 3D Mapping and 3D Modelling Industry Revenue Share (%), by Type 2025 & 2033
- Figure 70: Latin America 3D Mapping and 3D Modelling Industry Volume Share (%), by Type 2025 & 2033
- Figure 71: Latin America 3D Mapping and 3D Modelling Industry Revenue (Million), by Application 2025 & 2033
- Figure 72: Latin America 3D Mapping and 3D Modelling Industry Volume (K Unit), by Application 2025 & 2033
- Figure 73: Latin America 3D Mapping and 3D Modelling Industry Revenue Share (%), by Application 2025 & 2033
- Figure 74: Latin America 3D Mapping and 3D Modelling Industry Volume Share (%), by Application 2025 & 2033
- Figure 75: Latin America 3D Mapping and 3D Modelling Industry Revenue (Million), by End-user Vertical 2025 & 2033
- Figure 76: Latin America 3D Mapping and 3D Modelling Industry Volume (K Unit), by End-user Vertical 2025 & 2033
- Figure 77: Latin America 3D Mapping and 3D Modelling Industry Revenue Share (%), by End-user Vertical 2025 & 2033
- Figure 78: Latin America 3D Mapping and 3D Modelling Industry Volume Share (%), by End-user Vertical 2025 & 2033
- Figure 79: Latin America 3D Mapping and 3D Modelling Industry Revenue (Million), by Country 2025 & 2033
- Figure 80: Latin America 3D Mapping and 3D Modelling Industry Volume (K Unit), by Country 2025 & 2033
- Figure 81: Latin America 3D Mapping and 3D Modelling Industry Revenue Share (%), by Country 2025 & 2033
- Figure 82: Latin America 3D Mapping and 3D Modelling Industry Volume Share (%), by Country 2025 & 2033
- Figure 83: Middle East and Africa 3D Mapping and 3D Modelling Industry Revenue (Million), by Type 2025 & 2033
- Figure 84: Middle East and Africa 3D Mapping and 3D Modelling Industry Volume (K Unit), by Type 2025 & 2033
- Figure 85: Middle East and Africa 3D Mapping and 3D Modelling Industry Revenue Share (%), by Type 2025 & 2033
- Figure 86: Middle East and Africa 3D Mapping and 3D Modelling Industry Volume Share (%), by Type 2025 & 2033
- Figure 87: Middle East and Africa 3D Mapping and 3D Modelling Industry Revenue (Million), by Application 2025 & 2033
- Figure 88: Middle East and Africa 3D Mapping and 3D Modelling Industry Volume (K Unit), by Application 2025 & 2033
- Figure 89: Middle East and Africa 3D Mapping and 3D Modelling Industry Revenue Share (%), by Application 2025 & 2033
- Figure 90: Middle East and Africa 3D Mapping and 3D Modelling Industry Volume Share (%), by Application 2025 & 2033
- Figure 91: Middle East and Africa 3D Mapping and 3D Modelling Industry Revenue (Million), by End-user Vertical 2025 & 2033
- Figure 92: Middle East and Africa 3D Mapping and 3D Modelling Industry Volume (K Unit), by End-user Vertical 2025 & 2033
- Figure 93: Middle East and Africa 3D Mapping and 3D Modelling Industry Revenue Share (%), by End-user Vertical 2025 & 2033
- Figure 94: Middle East and Africa 3D Mapping and 3D Modelling Industry Volume Share (%), by End-user Vertical 2025 & 2033
- Figure 95: Middle East and Africa 3D Mapping and 3D Modelling Industry Revenue (Million), by Country 2025 & 2033
- Figure 96: Middle East and Africa 3D Mapping and 3D Modelling Industry Volume (K Unit), by Country 2025 & 2033
- Figure 97: Middle East and Africa 3D Mapping and 3D Modelling Industry Revenue Share (%), by Country 2025 & 2033
- Figure 98: Middle East and Africa 3D Mapping and 3D Modelling Industry Volume Share (%), by Country 2025 & 2033
List of Tables
- Table 1: Global 3D Mapping and 3D Modelling Industry Revenue Million Forecast, by Type 2020 & 2033
- Table 2: Global 3D Mapping and 3D Modelling Industry Volume K Unit Forecast, by Type 2020 & 2033
- Table 3: Global 3D Mapping and 3D Modelling Industry Revenue Million Forecast, by Application 2020 & 2033
- Table 4: Global 3D Mapping and 3D Modelling Industry Volume K Unit Forecast, by Application 2020 & 2033
- Table 5: Global 3D Mapping and 3D Modelling Industry Revenue Million Forecast, by End-user Vertical 2020 & 2033
- Table 6: Global 3D Mapping and 3D Modelling Industry Volume K Unit Forecast, by End-user Vertical 2020 & 2033
- Table 7: Global 3D Mapping and 3D Modelling Industry Revenue Million Forecast, by Region 2020 & 2033
- Table 8: Global 3D Mapping and 3D Modelling Industry Volume K Unit Forecast, by Region 2020 & 2033
- Table 9: Global 3D Mapping and 3D Modelling Industry Revenue Million Forecast, by Type 2020 & 2033
- Table 10: Global 3D Mapping and 3D Modelling Industry Volume K Unit Forecast, by Type 2020 & 2033
- Table 11: Global 3D Mapping and 3D Modelling Industry Revenue Million Forecast, by Application 2020 & 2033
- Table 12: Global 3D Mapping and 3D Modelling Industry Volume K Unit Forecast, by Application 2020 & 2033
- Table 13: Global 3D Mapping and 3D Modelling Industry Revenue Million Forecast, by End-user Vertical 2020 & 2033
- Table 14: Global 3D Mapping and 3D Modelling Industry Volume K Unit Forecast, by End-user Vertical 2020 & 2033
- Table 15: Global 3D Mapping and 3D Modelling Industry Revenue Million Forecast, by Country 2020 & 2033
- Table 16: Global 3D Mapping and 3D Modelling Industry Volume K Unit Forecast, by Country 2020 & 2033
- Table 17: Global 3D Mapping and 3D Modelling Industry Revenue Million Forecast, by Type 2020 & 2033
- Table 18: Global 3D Mapping and 3D Modelling Industry Volume K Unit Forecast, by Type 2020 & 2033
- Table 19: Global 3D Mapping and 3D Modelling Industry Revenue Million Forecast, by Application 2020 & 2033
- Table 20: Global 3D Mapping and 3D Modelling Industry Volume K Unit Forecast, by Application 2020 & 2033
- Table 21: Global 3D Mapping and 3D Modelling Industry Revenue Million Forecast, by End-user Vertical 2020 & 2033
- Table 22: Global 3D Mapping and 3D Modelling Industry Volume K Unit Forecast, by End-user Vertical 2020 & 2033
- Table 23: Global 3D Mapping and 3D Modelling Industry Revenue Million Forecast, by Country 2020 & 2033
- Table 24: Global 3D Mapping and 3D Modelling Industry Volume K Unit Forecast, by Country 2020 & 2033
- Table 25: Global 3D Mapping and 3D Modelling Industry Revenue Million Forecast, by Type 2020 & 2033
- Table 26: Global 3D Mapping and 3D Modelling Industry Volume K Unit Forecast, by Type 2020 & 2033
- Table 27: Global 3D Mapping and 3D Modelling Industry Revenue Million Forecast, by Application 2020 & 2033
- Table 28: Global 3D Mapping and 3D Modelling Industry Volume K Unit Forecast, by Application 2020 & 2033
- Table 29: Global 3D Mapping and 3D Modelling Industry Revenue Million Forecast, by End-user Vertical 2020 & 2033
- Table 30: Global 3D Mapping and 3D Modelling Industry Volume K Unit Forecast, by End-user Vertical 2020 & 2033
- Table 31: Global 3D Mapping and 3D Modelling Industry Revenue Million Forecast, by Country 2020 & 2033
- Table 32: Global 3D Mapping and 3D Modelling Industry Volume K Unit Forecast, by Country 2020 & 2033
- Table 33: Global 3D Mapping and 3D Modelling Industry Revenue Million Forecast, by Type 2020 & 2033
- Table 34: Global 3D Mapping and 3D Modelling Industry Volume K Unit Forecast, by Type 2020 & 2033
- Table 35: Global 3D Mapping and 3D Modelling Industry Revenue Million Forecast, by Application 2020 & 2033
- Table 36: Global 3D Mapping and 3D Modelling Industry Volume K Unit Forecast, by Application 2020 & 2033
- Table 37: Global 3D Mapping and 3D Modelling Industry Revenue Million Forecast, by End-user Vertical 2020 & 2033
- Table 38: Global 3D Mapping and 3D Modelling Industry Volume K Unit Forecast, by End-user Vertical 2020 & 2033
- Table 39: Global 3D Mapping and 3D Modelling Industry Revenue Million Forecast, by Country 2020 & 2033
- Table 40: Global 3D Mapping and 3D Modelling Industry Volume K Unit Forecast, by Country 2020 & 2033
- Table 41: Global 3D Mapping and 3D Modelling Industry Revenue Million Forecast, by Type 2020 & 2033
- Table 42: Global 3D Mapping and 3D Modelling Industry Volume K Unit Forecast, by Type 2020 & 2033
- Table 43: Global 3D Mapping and 3D Modelling Industry Revenue Million Forecast, by Application 2020 & 2033
- Table 44: Global 3D Mapping and 3D Modelling Industry Volume K Unit Forecast, by Application 2020 & 2033
- Table 45: Global 3D Mapping and 3D Modelling Industry Revenue Million Forecast, by End-user Vertical 2020 & 2033
- Table 46: Global 3D Mapping and 3D Modelling Industry Volume K Unit Forecast, by End-user Vertical 2020 & 2033
- Table 47: Global 3D Mapping and 3D Modelling Industry Revenue Million Forecast, by Country 2020 & 2033
- Table 48: Global 3D Mapping and 3D Modelling Industry Volume K Unit Forecast, by Country 2020 & 2033
- Table 49: Global 3D Mapping and 3D Modelling Industry Revenue Million Forecast, by Type 2020 & 2033
- Table 50: Global 3D Mapping and 3D Modelling Industry Volume K Unit Forecast, by Type 2020 & 2033
- Table 51: Global 3D Mapping and 3D Modelling Industry Revenue Million Forecast, by Application 2020 & 2033
- Table 52: Global 3D Mapping and 3D Modelling Industry Volume K Unit Forecast, by Application 2020 & 2033
- Table 53: Global 3D Mapping and 3D Modelling Industry Revenue Million Forecast, by End-user Vertical 2020 & 2033
- Table 54: Global 3D Mapping and 3D Modelling Industry Volume K Unit Forecast, by End-user Vertical 2020 & 2033
- Table 55: Global 3D Mapping and 3D Modelling Industry Revenue Million Forecast, by Country 2020 & 2033
- Table 56: Global 3D Mapping and 3D Modelling Industry Volume K Unit Forecast, by Country 2020 & 2033
Frequently Asked Questions
1. What is the projected Compound Annual Growth Rate (CAGR) of the 3D Mapping and 3D Modelling Industry?
The projected CAGR is approximately 14.67%.
2. Which companies are prominent players in the 3D Mapping and 3D Modelling Industry?
Key companies in the market include Airbus Defense and Space, Cybercity 3D Inc, ESRI Inc , Golden Software LLC, Intermap Technologies, The Foundry Visionmongers Ltd, Autodesk Inc, Topcon Positioning Systems Inc, Trimble Inc, Bentley Systems Inc, Saab AB.
3. What are the main segments of the 3D Mapping and 3D Modelling Industry?
The market segments include Type, Application, End-user Vertical.
4. Can you provide details about the market size?
The market size is estimated to be USD 7.48 Million as of 2022.
5. What are some drivers contributing to market growth?
Advent of 3D-enabled Display Devices; Advancement of 3D Scanners. 3D Sensors. and Other Acquisition Devices.
6. What are the notable trends driving market growth?
Entertainment and Media Segment would Contribute Significantly to the Market Growth.
7. Are there any restraints impacting market growth?
High Initial Investments.
8. Can you provide examples of recent developments in the market?
N/A
9. What pricing options are available for accessing the report?
Pricing options include single-user, multi-user, and enterprise licenses priced at USD 4750, USD 5250, and USD 8750 respectively.
10. Is the market size provided in terms of value or volume?
The market size is provided in terms of value, measured in Million and volume, measured in K Unit.
11. Are there any specific market keywords associated with the report?
Yes, the market keyword associated with the report is "3D Mapping and 3D Modelling Industry," which aids in identifying and referencing the specific market segment covered.
12. How do I determine which pricing option suits my needs best?
The pricing options vary based on user requirements and access needs. Individual users may opt for single-user licenses, while businesses requiring broader access may choose multi-user or enterprise licenses for cost-effective access to the report.
13. Are there any additional resources or data provided in the 3D Mapping and 3D Modelling Industry report?
While the report offers comprehensive insights, it's advisable to review the specific contents or supplementary materials provided to ascertain if additional resources or data are available.
14. How can I stay updated on further developments or reports in the 3D Mapping and 3D Modelling Industry?
To stay informed about further developments, trends, and reports in the 3D Mapping and 3D Modelling Industry, consider subscribing to industry newsletters, following relevant companies and organizations, or regularly checking reputable industry news sources and publications.
Methodology
Step 1 - Identification of Relevant Samples Size from Population Database


Step 2 - Approaches for Defining Global Market Size (Value, Volume* & Price*)

Note*: In applicable scenarios
Step 3 - Data Sources
Primary Research
- Web Analytics
- Survey Reports
- Research Institute
- Latest Research Reports
- Opinion Leaders
Secondary Research
- Annual Reports
- White Paper
- Latest Press Release
- Industry Association
- Paid Database
- Investor Presentations

Step 4 - Data Triangulation
Involves using different sources of information in order to increase the validity of a study
These sources are likely to be stakeholders in a program - participants, other researchers, program staff, other community members, and so on.
Then we put all data in single framework & apply various statistical tools to find out the dynamic on the market.
During the analysis stage, feedback from the stakeholder groups would be compared to determine areas of agreement as well as areas of divergence