

Key Insights
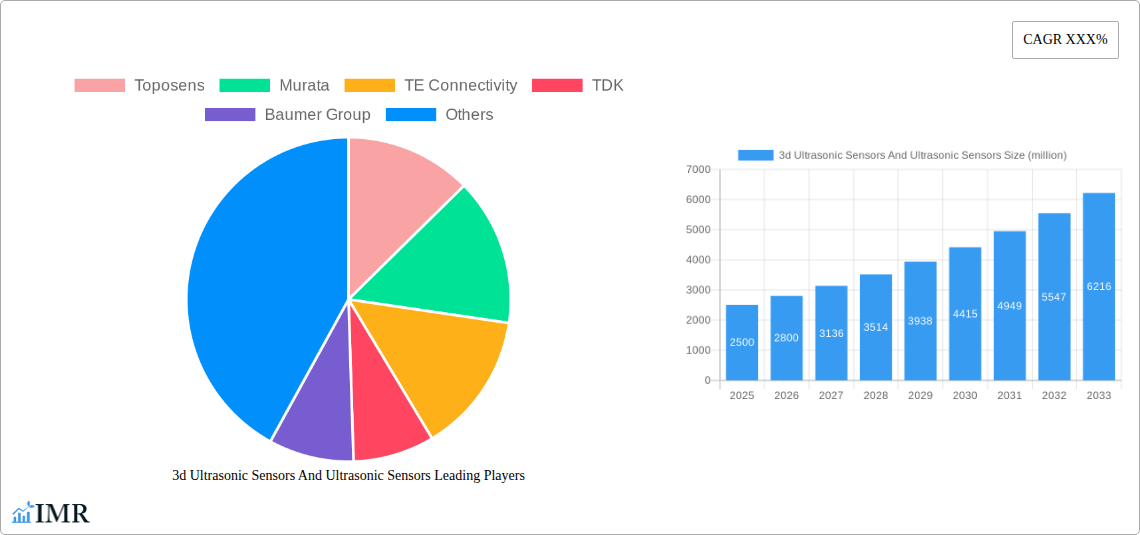
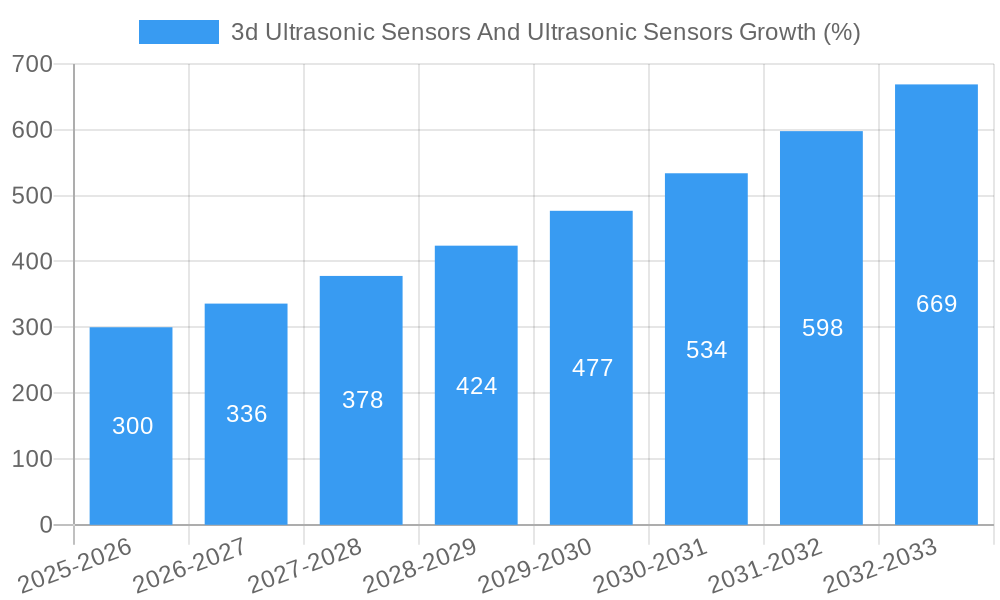
The global 3D ultrasonic sensor and ultrasonic sensor market is experiencing robust growth, driven by increasing automation across various industries and the rising demand for non-contact sensing solutions. The market, estimated at $2.5 billion in 2025, is projected to exhibit a Compound Annual Growth Rate (CAGR) of 12% from 2025 to 2033, reaching approximately $6.5 billion by 2033. This expansion is fueled by several key factors, including the increasing adoption of advanced driver-assistance systems (ADAS) in the automotive sector, the growth of robotics in manufacturing and logistics, and the rising demand for precise object detection and distance measurement in industrial automation. Furthermore, ongoing technological advancements resulting in improved sensor accuracy, miniaturization, and lower costs are contributing to market expansion. Key market segments include automotive, industrial automation, consumer electronics, and healthcare. Companies such as Toposens, Murata, TE Connectivity, and others are actively shaping the market landscape through innovation and strategic partnerships.
The market growth is primarily constrained by factors such as the relatively high cost of advanced 3D ultrasonic sensors compared to other sensing technologies, and the susceptibility of ultrasonic sensors to environmental factors like temperature and humidity. However, ongoing research and development focused on improving sensor performance and reducing production costs are mitigating these limitations. The trend towards increased integration of ultrasonic sensors with other sensor technologies, such as vision systems and lidar, is also contributing to growth, offering more comprehensive and reliable solutions for various applications. The geographical distribution of the market shows strong growth across North America, Europe, and Asia Pacific, driven by varying levels of technological adoption and industrial development in these regions. Future market growth will heavily depend on continued technological innovation and the expansion of applications across emerging sectors.
3D Ultrasonic Sensors and Ultrasonic Sensors Market Report: 2019-2033
This comprehensive report provides an in-depth analysis of the 3D ultrasonic sensors and ultrasonic sensors market, encompassing market dynamics, growth trends, regional dominance, product landscape, key challenges, emerging opportunities, and key players. The study period covers 2019-2033, with a base year of 2025 and a forecast period of 2025-2033. The report utilizes data from the historical period (2019-2024) to project future market trends. The total market size is predicted to reach xx million units by 2033.
3D Ultrasonic Sensors And Ultrasonic Sensors Market Dynamics & Structure
This section analyzes the market structure, examining concentration levels, technological innovation, regulatory influences, competitive substitutes, end-user demographics, and merger & acquisition (M&A) activity. The market is characterized by a moderately fragmented landscape with several key players and numerous niche players.
- Market Concentration: The global market shows a moderately consolidated structure, with the top 5 players holding approximately xx% market share in 2025.
- Technological Innovation: Continuous advancements in sensor technology, such as improved accuracy, range, and miniaturization, are driving market growth. Innovation in signal processing and AI-driven data analysis are also significant factors.
- Regulatory Frameworks: Government regulations regarding safety and emissions in various industries (automotive, industrial automation) influence the adoption of ultrasonic sensors. Compliance costs can affect market growth.
- Competitive Product Substitutes: 3D cameras, LiDAR, and radar systems pose competition, but ultrasonic sensors maintain advantages in certain applications due to cost-effectiveness and robustness.
- End-User Demographics: The automotive, industrial automation, and consumer electronics sectors are major end-users, driving significant market demand. Growth in these sectors directly impacts market expansion.
- M&A Trends: The past five years have witnessed xx M&A deals in the ultrasonic sensor industry, primarily focused on expanding technological capabilities and market reach. Consolidation is anticipated to continue.
3D Ultrasonic Sensors And Ultrasonic Sensors Growth Trends & Insights
The global 3D ultrasonic sensors and ultrasonic sensors market has witnessed significant growth in recent years, driven by increasing demand across various industries. The market size was valued at xx million units in 2025 and is projected to expand at a Compound Annual Growth Rate (CAGR) of xx% during the forecast period (2025-2033), reaching xx million units by 2033. This growth is fueled by several key factors, including the rising adoption of automation technologies across industries, increasing demand for advanced sensor solutions in autonomous vehicles and robotics, and the growing need for improved safety and efficiency in various applications. Furthermore, technological advancements, such as miniaturization of sensors and improved signal processing techniques, are also contributing to market growth. Consumer behavior trends towards smart homes and smart devices further contribute to demand. Market penetration in emerging economies is also contributing significantly to this growth trajectory.
Dominant Regions, Countries, or Segments in 3D Ultrasonic Sensors And Ultrasonic Sensors
North America currently holds the largest market share in the 3D ultrasonic sensors and ultrasonic sensors market, followed by Europe and Asia-Pacific. However, Asia-Pacific is expected to witness the highest growth rate during the forecast period due to rapid industrialization, increasing investments in automation, and the expanding consumer electronics market.
- North America: Strong automotive industry, advanced manufacturing, and high adoption rates of automation contribute to the region's dominance.
- Europe: Focus on automation in manufacturing and automotive industries drives consistent growth, although at a slower pace than Asia-Pacific.
- Asia-Pacific: Rapid industrialization, particularly in China and India, coupled with supportive government policies, fuels significant growth potential.
3D Ultrasonic Sensors And Ultrasonic Sensors Product Landscape
The market offers a wide range of ultrasonic sensors, varying in technology (e.g., piezoelectric, capacitive), operating frequency, and functionality (e.g., distance measurement, object detection, proximity sensing). 3D ultrasonic sensors are increasingly incorporating advanced features like improved accuracy, wider field of view, and enhanced signal processing capabilities. These advancements lead to improved performance in applications like autonomous navigation and robotic manipulation. Unique selling propositions include rugged design, improved noise immunity, and long-range detection.
Key Drivers, Barriers & Challenges in 3D Ultrasonic Sensors And Ultrasonic Sensors
Key Drivers:
- Increasing demand for automation in various industries.
- Growing adoption of advanced driver-assistance systems (ADAS) in the automotive sector.
- Rising demand for robotics and industrial automation solutions.
- Technological advancements in sensor technology, improving accuracy and performance.
Key Challenges:
- Competition from alternative sensing technologies (e.g., LiDAR, radar).
- The cost of advanced 3D ultrasonic sensors can limit adoption in price-sensitive markets.
- The impact of global supply chain disruptions can cause shortages and price fluctuations.
Emerging Opportunities in 3D Ultrasonic Sensors And Ultrasonic Sensors
- Untapped markets in developing economies present substantial growth potential.
- Increasing demand for non-contact measurement and sensing in healthcare and medical devices.
- Integration of ultrasonic sensors with AI and IoT technologies opens up new applications.
Growth Accelerators in the 3D Ultrasonic Sensors And Ultrasonic Sensors Industry
Strategic partnerships between sensor manufacturers and system integrators are creating innovative solutions. The continuous development of more energy-efficient and cost-effective sensors is a significant growth accelerator. Expansion into new application areas, such as smart agriculture and smart cities, contributes to market expansion.
Key Players Shaping the 3D Ultrasonic Sensors And Ultrasonic Sensors Market
- Toposens
- Murata
- TE Connectivity
- TDK
- Baumer Group
- Barksdale Inc.
- CeramTec
- Sensors & Controls
- Massa
- Microsonic
- SensoPart
- SONOTEC
Notable Milestones in 3D Ultrasonic Sensors And Ultrasonic Sensors Sector
- 2021-Q4: Toposens launched its 3D ultrasonic sensor with enhanced accuracy and range.
- 2022-Q2: Murata acquired a smaller sensor company, expanding its product portfolio.
- 2023-Q1: Significant investment in R&D in miniaturization and power efficiency by TDK. (Specific details on these events may need to be sourced and updated for accuracy).
In-Depth 3D Ultrasonic Sensors And Ultrasonic Sensors Market Outlook
The market is poised for continued growth, driven by technological advancements, increased automation adoption, and expansion into new application areas. Strategic partnerships and innovative product development will further propel market expansion. The focus on energy efficiency and cost reduction will make ultrasonic sensors more competitive, driving wider market penetration.
3d Ultrasonic Sensors And Ultrasonic Sensors Segmentation
-
1. Application
- 1.1. Driverless Car
- 1.2. Robot
- 1.3. Industrial Automation
- 1.4. Others
-
2. Type
- 2.1. Ultrasonic Sensors
- 2.2. 3D Ultrasonic Sensors
3d Ultrasonic Sensors And Ultrasonic Sensors Segmentation By Geography
-
1. North America
- 1.1. United States
- 1.2. Canada
- 1.3. Mexico
-
2. South America
- 2.1. Brazil
- 2.2. Argentina
- 2.3. Rest of South America
-
3. Europe
- 3.1. United Kingdom
- 3.2. Germany
- 3.3. France
- 3.4. Italy
- 3.5. Spain
- 3.6. Russia
- 3.7. Benelux
- 3.8. Nordics
- 3.9. Rest of Europe
-
4. Middle East & Africa
- 4.1. Turkey
- 4.2. Israel
- 4.3. GCC
- 4.4. North Africa
- 4.5. South Africa
- 4.6. Rest of Middle East & Africa
-
5. Asia Pacific
- 5.1. China
- 5.2. India
- 5.3. Japan
- 5.4. South Korea
- 5.5. ASEAN
- 5.6. Oceania
- 5.7. Rest of Asia Pacific

3d Ultrasonic Sensors And Ultrasonic Sensors REPORT HIGHLIGHTS
| Aspects | Details |
|---|---|
| Study Period | 2019-2033 |
| Base Year | 2024 |
| Estimated Year | 2025 |
| Forecast Period | 2025-2033 |
| Historical Period | 2019-2024 |
| Growth Rate | CAGR of XXX% from 2019-2033 |
| Segmentation |
|
Table of Contents
- 1. Introduction
- 1.1. Research Scope
- 1.2. Market Segmentation
- 1.3. Research Methodology
- 1.4. Definitions and Assumptions
- 2. Executive Summary
- 2.1. Introduction
- 3. Market Dynamics
- 3.1. Introduction
- 3.2. Market Drivers
- 3.3. Market Restrains
- 3.4. Market Trends
- 4. Market Factor Analysis
- 4.1. Porters Five Forces
- 4.2. Supply/Value Chain
- 4.3. PESTEL analysis
- 4.4. Market Entropy
- 4.5. Patent/Trademark Analysis
- 5. Global 3d Ultrasonic Sensors And Ultrasonic Sensors Analysis, Insights and Forecast, 2019-2031
- 5.1. Market Analysis, Insights and Forecast - by Application
- 5.1.1. Driverless Car
- 5.1.2. Robot
- 5.1.3. Industrial Automation
- 5.1.4. Others
- 5.2. Market Analysis, Insights and Forecast - by Type
- 5.2.1. Ultrasonic Sensors
- 5.2.2. 3D Ultrasonic Sensors
- 5.3. Market Analysis, Insights and Forecast - by Region
- 5.3.1. North America
- 5.3.2. South America
- 5.3.3. Europe
- 5.3.4. Middle East & Africa
- 5.3.5. Asia Pacific
- 5.1. Market Analysis, Insights and Forecast - by Application
- 6. North America 3d Ultrasonic Sensors And Ultrasonic Sensors Analysis, Insights and Forecast, 2019-2031
- 6.1. Market Analysis, Insights and Forecast - by Application
- 6.1.1. Driverless Car
- 6.1.2. Robot
- 6.1.3. Industrial Automation
- 6.1.4. Others
- 6.2. Market Analysis, Insights and Forecast - by Type
- 6.2.1. Ultrasonic Sensors
- 6.2.2. 3D Ultrasonic Sensors
- 6.1. Market Analysis, Insights and Forecast - by Application
- 7. South America 3d Ultrasonic Sensors And Ultrasonic Sensors Analysis, Insights and Forecast, 2019-2031
- 7.1. Market Analysis, Insights and Forecast - by Application
- 7.1.1. Driverless Car
- 7.1.2. Robot
- 7.1.3. Industrial Automation
- 7.1.4. Others
- 7.2. Market Analysis, Insights and Forecast - by Type
- 7.2.1. Ultrasonic Sensors
- 7.2.2. 3D Ultrasonic Sensors
- 7.1. Market Analysis, Insights and Forecast - by Application
- 8. Europe 3d Ultrasonic Sensors And Ultrasonic Sensors Analysis, Insights and Forecast, 2019-2031
- 8.1. Market Analysis, Insights and Forecast - by Application
- 8.1.1. Driverless Car
- 8.1.2. Robot
- 8.1.3. Industrial Automation
- 8.1.4. Others
- 8.2. Market Analysis, Insights and Forecast - by Type
- 8.2.1. Ultrasonic Sensors
- 8.2.2. 3D Ultrasonic Sensors
- 8.1. Market Analysis, Insights and Forecast - by Application
- 9. Middle East & Africa 3d Ultrasonic Sensors And Ultrasonic Sensors Analysis, Insights and Forecast, 2019-2031
- 9.1. Market Analysis, Insights and Forecast - by Application
- 9.1.1. Driverless Car
- 9.1.2. Robot
- 9.1.3. Industrial Automation
- 9.1.4. Others
- 9.2. Market Analysis, Insights and Forecast - by Type
- 9.2.1. Ultrasonic Sensors
- 9.2.2. 3D Ultrasonic Sensors
- 9.1. Market Analysis, Insights and Forecast - by Application
- 10. Asia Pacific 3d Ultrasonic Sensors And Ultrasonic Sensors Analysis, Insights and Forecast, 2019-2031
- 10.1. Market Analysis, Insights and Forecast - by Application
- 10.1.1. Driverless Car
- 10.1.2. Robot
- 10.1.3. Industrial Automation
- 10.1.4. Others
- 10.2. Market Analysis, Insights and Forecast - by Type
- 10.2.1. Ultrasonic Sensors
- 10.2.2. 3D Ultrasonic Sensors
- 10.1. Market Analysis, Insights and Forecast - by Application
- 11. Competitive Analysis
- 11.1. Global Market Share Analysis 2024
- 11.2. Company Profiles
- 11.2.1 Toposens
- 11.2.1.1. Overview
- 11.2.1.2. Products
- 11.2.1.3. SWOT Analysis
- 11.2.1.4. Recent Developments
- 11.2.1.5. Financials (Based on Availability)
- 11.2.2 Murata
- 11.2.2.1. Overview
- 11.2.2.2. Products
- 11.2.2.3. SWOT Analysis
- 11.2.2.4. Recent Developments
- 11.2.2.5. Financials (Based on Availability)
- 11.2.3 TE Connectivity
- 11.2.3.1. Overview
- 11.2.3.2. Products
- 11.2.3.3. SWOT Analysis
- 11.2.3.4. Recent Developments
- 11.2.3.5. Financials (Based on Availability)
- 11.2.4 TDK
- 11.2.4.1. Overview
- 11.2.4.2. Products
- 11.2.4.3. SWOT Analysis
- 11.2.4.4. Recent Developments
- 11.2.4.5. Financials (Based on Availability)
- 11.2.5 Baumer Group
- 11.2.5.1. Overview
- 11.2.5.2. Products
- 11.2.5.3. SWOT Analysis
- 11.2.5.4. Recent Developments
- 11.2.5.5. Financials (Based on Availability)
- 11.2.6 Barksdale Inc.
- 11.2.6.1. Overview
- 11.2.6.2. Products
- 11.2.6.3. SWOT Analysis
- 11.2.6.4. Recent Developments
- 11.2.6.5. Financials (Based on Availability)
- 11.2.7 CeramTec
- 11.2.7.1. Overview
- 11.2.7.2. Products
- 11.2.7.3. SWOT Analysis
- 11.2.7.4. Recent Developments
- 11.2.7.5. Financials (Based on Availability)
- 11.2.8 Sensors & Controls
- 11.2.8.1. Overview
- 11.2.8.2. Products
- 11.2.8.3. SWOT Analysis
- 11.2.8.4. Recent Developments
- 11.2.8.5. Financials (Based on Availability)
- 11.2.9 Massa
- 11.2.9.1. Overview
- 11.2.9.2. Products
- 11.2.9.3. SWOT Analysis
- 11.2.9.4. Recent Developments
- 11.2.9.5. Financials (Based on Availability)
- 11.2.10 Microsonic
- 11.2.10.1. Overview
- 11.2.10.2. Products
- 11.2.10.3. SWOT Analysis
- 11.2.10.4. Recent Developments
- 11.2.10.5. Financials (Based on Availability)
- 11.2.11 SensoPart
- 11.2.11.1. Overview
- 11.2.11.2. Products
- 11.2.11.3. SWOT Analysis
- 11.2.11.4. Recent Developments
- 11.2.11.5. Financials (Based on Availability)
- 11.2.12 SONOTEC
- 11.2.12.1. Overview
- 11.2.12.2. Products
- 11.2.12.3. SWOT Analysis
- 11.2.12.4. Recent Developments
- 11.2.12.5. Financials (Based on Availability)
- 11.2.1 Toposens
List of Figures
- Figure 1: Global 3d Ultrasonic Sensors And Ultrasonic Sensors Revenue Breakdown (million, %) by Region 2024 & 2032
- Figure 2: North America 3d Ultrasonic Sensors And Ultrasonic Sensors Revenue (million), by Application 2024 & 2032
- Figure 3: North America 3d Ultrasonic Sensors And Ultrasonic Sensors Revenue Share (%), by Application 2024 & 2032
- Figure 4: North America 3d Ultrasonic Sensors And Ultrasonic Sensors Revenue (million), by Type 2024 & 2032
- Figure 5: North America 3d Ultrasonic Sensors And Ultrasonic Sensors Revenue Share (%), by Type 2024 & 2032
- Figure 6: North America 3d Ultrasonic Sensors And Ultrasonic Sensors Revenue (million), by Country 2024 & 2032
- Figure 7: North America 3d Ultrasonic Sensors And Ultrasonic Sensors Revenue Share (%), by Country 2024 & 2032
- Figure 8: South America 3d Ultrasonic Sensors And Ultrasonic Sensors Revenue (million), by Application 2024 & 2032
- Figure 9: South America 3d Ultrasonic Sensors And Ultrasonic Sensors Revenue Share (%), by Application 2024 & 2032
- Figure 10: South America 3d Ultrasonic Sensors And Ultrasonic Sensors Revenue (million), by Type 2024 & 2032
- Figure 11: South America 3d Ultrasonic Sensors And Ultrasonic Sensors Revenue Share (%), by Type 2024 & 2032
- Figure 12: South America 3d Ultrasonic Sensors And Ultrasonic Sensors Revenue (million), by Country 2024 & 2032
- Figure 13: South America 3d Ultrasonic Sensors And Ultrasonic Sensors Revenue Share (%), by Country 2024 & 2032
- Figure 14: Europe 3d Ultrasonic Sensors And Ultrasonic Sensors Revenue (million), by Application 2024 & 2032
- Figure 15: Europe 3d Ultrasonic Sensors And Ultrasonic Sensors Revenue Share (%), by Application 2024 & 2032
- Figure 16: Europe 3d Ultrasonic Sensors And Ultrasonic Sensors Revenue (million), by Type 2024 & 2032
- Figure 17: Europe 3d Ultrasonic Sensors And Ultrasonic Sensors Revenue Share (%), by Type 2024 & 2032
- Figure 18: Europe 3d Ultrasonic Sensors And Ultrasonic Sensors Revenue (million), by Country 2024 & 2032
- Figure 19: Europe 3d Ultrasonic Sensors And Ultrasonic Sensors Revenue Share (%), by Country 2024 & 2032
- Figure 20: Middle East & Africa 3d Ultrasonic Sensors And Ultrasonic Sensors Revenue (million), by Application 2024 & 2032
- Figure 21: Middle East & Africa 3d Ultrasonic Sensors And Ultrasonic Sensors Revenue Share (%), by Application 2024 & 2032
- Figure 22: Middle East & Africa 3d Ultrasonic Sensors And Ultrasonic Sensors Revenue (million), by Type 2024 & 2032
- Figure 23: Middle East & Africa 3d Ultrasonic Sensors And Ultrasonic Sensors Revenue Share (%), by Type 2024 & 2032
- Figure 24: Middle East & Africa 3d Ultrasonic Sensors And Ultrasonic Sensors Revenue (million), by Country 2024 & 2032
- Figure 25: Middle East & Africa 3d Ultrasonic Sensors And Ultrasonic Sensors Revenue Share (%), by Country 2024 & 2032
- Figure 26: Asia Pacific 3d Ultrasonic Sensors And Ultrasonic Sensors Revenue (million), by Application 2024 & 2032
- Figure 27: Asia Pacific 3d Ultrasonic Sensors And Ultrasonic Sensors Revenue Share (%), by Application 2024 & 2032
- Figure 28: Asia Pacific 3d Ultrasonic Sensors And Ultrasonic Sensors Revenue (million), by Type 2024 & 2032
- Figure 29: Asia Pacific 3d Ultrasonic Sensors And Ultrasonic Sensors Revenue Share (%), by Type 2024 & 2032
- Figure 30: Asia Pacific 3d Ultrasonic Sensors And Ultrasonic Sensors Revenue (million), by Country 2024 & 2032
- Figure 31: Asia Pacific 3d Ultrasonic Sensors And Ultrasonic Sensors Revenue Share (%), by Country 2024 & 2032
List of Tables
- Table 1: Global 3d Ultrasonic Sensors And Ultrasonic Sensors Revenue million Forecast, by Region 2019 & 2032
- Table 2: Global 3d Ultrasonic Sensors And Ultrasonic Sensors Revenue million Forecast, by Application 2019 & 2032
- Table 3: Global 3d Ultrasonic Sensors And Ultrasonic Sensors Revenue million Forecast, by Type 2019 & 2032
- Table 4: Global 3d Ultrasonic Sensors And Ultrasonic Sensors Revenue million Forecast, by Region 2019 & 2032
- Table 5: Global 3d Ultrasonic Sensors And Ultrasonic Sensors Revenue million Forecast, by Application 2019 & 2032
- Table 6: Global 3d Ultrasonic Sensors And Ultrasonic Sensors Revenue million Forecast, by Type 2019 & 2032
- Table 7: Global 3d Ultrasonic Sensors And Ultrasonic Sensors Revenue million Forecast, by Country 2019 & 2032
- Table 8: United States 3d Ultrasonic Sensors And Ultrasonic Sensors Revenue (million) Forecast, by Application 2019 & 2032
- Table 9: Canada 3d Ultrasonic Sensors And Ultrasonic Sensors Revenue (million) Forecast, by Application 2019 & 2032
- Table 10: Mexico 3d Ultrasonic Sensors And Ultrasonic Sensors Revenue (million) Forecast, by Application 2019 & 2032
- Table 11: Global 3d Ultrasonic Sensors And Ultrasonic Sensors Revenue million Forecast, by Application 2019 & 2032
- Table 12: Global 3d Ultrasonic Sensors And Ultrasonic Sensors Revenue million Forecast, by Type 2019 & 2032
- Table 13: Global 3d Ultrasonic Sensors And Ultrasonic Sensors Revenue million Forecast, by Country 2019 & 2032
- Table 14: Brazil 3d Ultrasonic Sensors And Ultrasonic Sensors Revenue (million) Forecast, by Application 2019 & 2032
- Table 15: Argentina 3d Ultrasonic Sensors And Ultrasonic Sensors Revenue (million) Forecast, by Application 2019 & 2032
- Table 16: Rest of South America 3d Ultrasonic Sensors And Ultrasonic Sensors Revenue (million) Forecast, by Application 2019 & 2032
- Table 17: Global 3d Ultrasonic Sensors And Ultrasonic Sensors Revenue million Forecast, by Application 2019 & 2032
- Table 18: Global 3d Ultrasonic Sensors And Ultrasonic Sensors Revenue million Forecast, by Type 2019 & 2032
- Table 19: Global 3d Ultrasonic Sensors And Ultrasonic Sensors Revenue million Forecast, by Country 2019 & 2032
- Table 20: United Kingdom 3d Ultrasonic Sensors And Ultrasonic Sensors Revenue (million) Forecast, by Application 2019 & 2032
- Table 21: Germany 3d Ultrasonic Sensors And Ultrasonic Sensors Revenue (million) Forecast, by Application 2019 & 2032
- Table 22: France 3d Ultrasonic Sensors And Ultrasonic Sensors Revenue (million) Forecast, by Application 2019 & 2032
- Table 23: Italy 3d Ultrasonic Sensors And Ultrasonic Sensors Revenue (million) Forecast, by Application 2019 & 2032
- Table 24: Spain 3d Ultrasonic Sensors And Ultrasonic Sensors Revenue (million) Forecast, by Application 2019 & 2032
- Table 25: Russia 3d Ultrasonic Sensors And Ultrasonic Sensors Revenue (million) Forecast, by Application 2019 & 2032
- Table 26: Benelux 3d Ultrasonic Sensors And Ultrasonic Sensors Revenue (million) Forecast, by Application 2019 & 2032
- Table 27: Nordics 3d Ultrasonic Sensors And Ultrasonic Sensors Revenue (million) Forecast, by Application 2019 & 2032
- Table 28: Rest of Europe 3d Ultrasonic Sensors And Ultrasonic Sensors Revenue (million) Forecast, by Application 2019 & 2032
- Table 29: Global 3d Ultrasonic Sensors And Ultrasonic Sensors Revenue million Forecast, by Application 2019 & 2032
- Table 30: Global 3d Ultrasonic Sensors And Ultrasonic Sensors Revenue million Forecast, by Type 2019 & 2032
- Table 31: Global 3d Ultrasonic Sensors And Ultrasonic Sensors Revenue million Forecast, by Country 2019 & 2032
- Table 32: Turkey 3d Ultrasonic Sensors And Ultrasonic Sensors Revenue (million) Forecast, by Application 2019 & 2032
- Table 33: Israel 3d Ultrasonic Sensors And Ultrasonic Sensors Revenue (million) Forecast, by Application 2019 & 2032
- Table 34: GCC 3d Ultrasonic Sensors And Ultrasonic Sensors Revenue (million) Forecast, by Application 2019 & 2032
- Table 35: North Africa 3d Ultrasonic Sensors And Ultrasonic Sensors Revenue (million) Forecast, by Application 2019 & 2032
- Table 36: South Africa 3d Ultrasonic Sensors And Ultrasonic Sensors Revenue (million) Forecast, by Application 2019 & 2032
- Table 37: Rest of Middle East & Africa 3d Ultrasonic Sensors And Ultrasonic Sensors Revenue (million) Forecast, by Application 2019 & 2032
- Table 38: Global 3d Ultrasonic Sensors And Ultrasonic Sensors Revenue million Forecast, by Application 2019 & 2032
- Table 39: Global 3d Ultrasonic Sensors And Ultrasonic Sensors Revenue million Forecast, by Type 2019 & 2032
- Table 40: Global 3d Ultrasonic Sensors And Ultrasonic Sensors Revenue million Forecast, by Country 2019 & 2032
- Table 41: China 3d Ultrasonic Sensors And Ultrasonic Sensors Revenue (million) Forecast, by Application 2019 & 2032
- Table 42: India 3d Ultrasonic Sensors And Ultrasonic Sensors Revenue (million) Forecast, by Application 2019 & 2032
- Table 43: Japan 3d Ultrasonic Sensors And Ultrasonic Sensors Revenue (million) Forecast, by Application 2019 & 2032
- Table 44: South Korea 3d Ultrasonic Sensors And Ultrasonic Sensors Revenue (million) Forecast, by Application 2019 & 2032
- Table 45: ASEAN 3d Ultrasonic Sensors And Ultrasonic Sensors Revenue (million) Forecast, by Application 2019 & 2032
- Table 46: Oceania 3d Ultrasonic Sensors And Ultrasonic Sensors Revenue (million) Forecast, by Application 2019 & 2032
- Table 47: Rest of Asia Pacific 3d Ultrasonic Sensors And Ultrasonic Sensors Revenue (million) Forecast, by Application 2019 & 2032
Frequently Asked Questions
1. What is the projected Compound Annual Growth Rate (CAGR) of the 3d Ultrasonic Sensors And Ultrasonic Sensors?
The projected CAGR is approximately XXX%.
2. Which companies are prominent players in the 3d Ultrasonic Sensors And Ultrasonic Sensors?
Key companies in the market include Toposens, Murata, TE Connectivity, TDK, Baumer Group, Barksdale Inc., CeramTec, Sensors & Controls, Massa, Microsonic, SensoPart, SONOTEC.
3. What are the main segments of the 3d Ultrasonic Sensors And Ultrasonic Sensors?
The market segments include Application, Type.
4. Can you provide details about the market size?
The market size is estimated to be USD XXX million as of 2022.
5. What are some drivers contributing to market growth?
N/A
6. What are the notable trends driving market growth?
N/A
7. Are there any restraints impacting market growth?
N/A
8. Can you provide examples of recent developments in the market?
N/A
9. What pricing options are available for accessing the report?
Pricing options include single-user, multi-user, and enterprise licenses priced at USD 2900.00, USD 4350.00, and USD 5800.00 respectively.
10. Is the market size provided in terms of value or volume?
The market size is provided in terms of value, measured in million.
11. Are there any specific market keywords associated with the report?
Yes, the market keyword associated with the report is "3d Ultrasonic Sensors And Ultrasonic Sensors," which aids in identifying and referencing the specific market segment covered.
12. How do I determine which pricing option suits my needs best?
The pricing options vary based on user requirements and access needs. Individual users may opt for single-user licenses, while businesses requiring broader access may choose multi-user or enterprise licenses for cost-effective access to the report.
13. Are there any additional resources or data provided in the 3d Ultrasonic Sensors And Ultrasonic Sensors report?
While the report offers comprehensive insights, it's advisable to review the specific contents or supplementary materials provided to ascertain if additional resources or data are available.
14. How can I stay updated on further developments or reports in the 3d Ultrasonic Sensors And Ultrasonic Sensors?
To stay informed about further developments, trends, and reports in the 3d Ultrasonic Sensors And Ultrasonic Sensors, consider subscribing to industry newsletters, following relevant companies and organizations, or regularly checking reputable industry news sources and publications.
Methodology
Step 1 - Identification of Relevant Samples Size from Population Database


Step 2 - Approaches for Defining Global Market Size (Value, Volume* & Price*)

Note*: In applicable scenarios
Step 3 - Data Sources
Primary Research
- Web Analytics
- Survey Reports
- Research Institute
- Latest Research Reports
- Opinion Leaders
Secondary Research
- Annual Reports
- White Paper
- Latest Press Release
- Industry Association
- Paid Database
- Investor Presentations

Step 4 - Data Triangulation
Involves using different sources of information in order to increase the validity of a study
These sources are likely to be stakeholders in a program - participants, other researchers, program staff, other community members, and so on.
Then we put all data in single framework & apply various statistical tools to find out the dynamic on the market.
During the analysis stage, feedback from the stakeholder groups would be compared to determine areas of agreement as well as areas of divergence
