

Key Insights
The United States digital payment market is demonstrating significant expansion, propelled by heightened smartphone adoption, the burgeoning e-commerce sector, and a discernible move towards cashless transactions. The market's Compound Annual Growth Rate (CAGR) of 16.2%, projected from 2025 to 2033, underscores its robust trajectory. Key growth drivers include the widespread availability of mobile payment solutions, enhanced security protocols bolstering consumer trust, and the continuous evolution of e-commerce platforms, complemented by innovative Buy Now Pay Later services. Increased internet and smartphone penetration across diverse demographics further facilitates broad market acceptance. Primary contributors to market expansion are the retail, entertainment, and healthcare industries, with notable growth potential emerging in hospitality and other nascent sectors. Despite challenges like data security concerns, the market outlook remains overwhelmingly positive. Segmentation by payment method (Point of Sale vs. Online) and end-user industry reveals diverse avenues for growth.
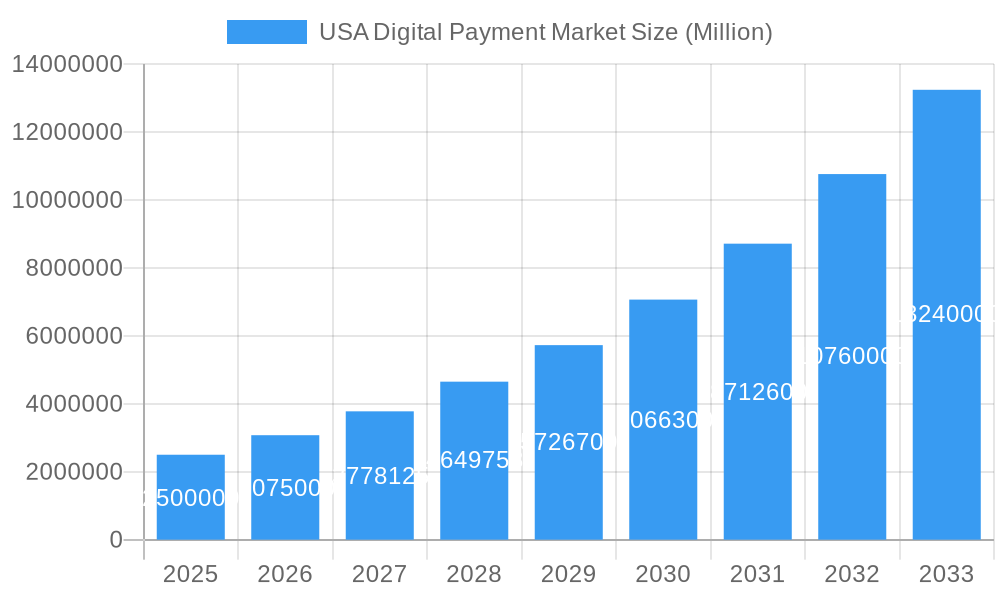
USA Digital Payment Market Market Size (In Billion)
The forecast period (2025-2033) anticipates sustained market growth. The US digital payment market is estimated to reach $136.88 billion by 2025, reflecting substantial historical expansion and ongoing adoption trends. Geographic distribution across the United States will likely align with population densities and e-commerce penetration. Emerging technologies such as biometric authentication and blockchain are poised to redefine future market dynamics. Intensified competition among established players and emerging fintech innovators will drive continued advancements. Regulatory shifts and evolving consumer preferences will critically influence the market's future direction.
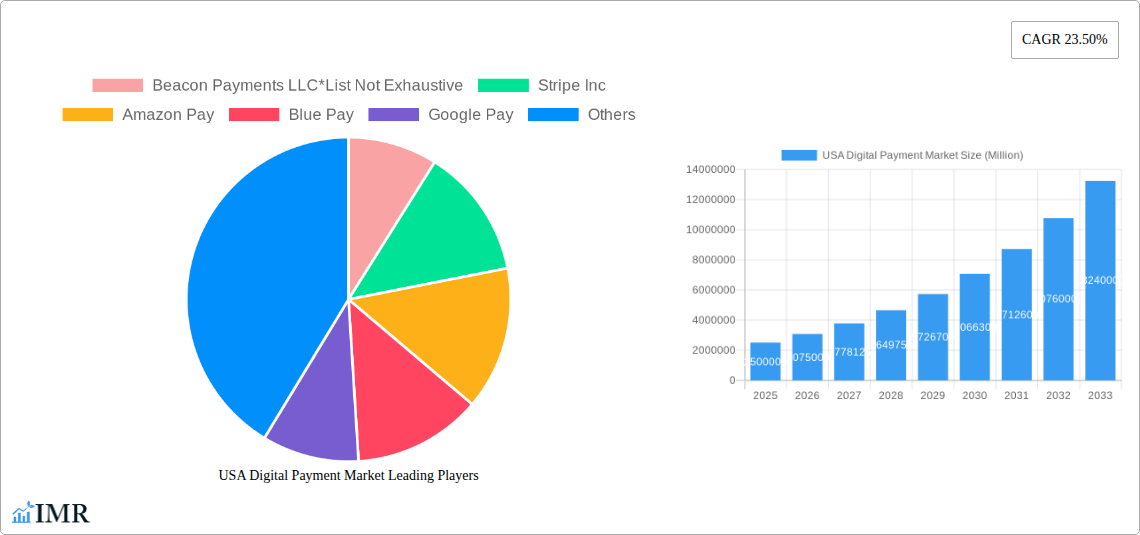
USA Digital Payment Market Company Market Share
USA Digital Payment Market: A Comprehensive Report (2019-2033)
This in-depth report provides a comprehensive analysis of the USA digital payment market, encompassing market dynamics, growth trends, regional performance, competitive landscape, and future outlook. With a study period spanning 2019-2033, a base year of 2025, and a forecast period of 2025-2033, this report is an essential resource for industry professionals, investors, and strategic decision-makers. The report segments the market by mode of payment (Point of Sale, Online Sale) and end-user industry (Retail, Entertainment, Healthcare, Hospitality, Other End-user Industries), offering granular insights into market behavior and growth potential. The estimated market size in 2025 is xx Million.
USA Digital Payment Market Market Dynamics & Structure
The USA digital payment market is characterized by high competition, rapid technological innovation, and evolving regulatory frameworks. Market concentration is moderate, with several major players holding significant market share, but also a considerable number of smaller niche players. The market exhibits strong growth driven by factors such as increasing smartphone penetration, rising e-commerce adoption, and the growing preference for contactless payments. However, challenges like security concerns, data privacy regulations, and the need for robust infrastructure continue to influence market dynamics. Mergers and acquisitions (M&A) activity is significant, reflecting the industry's dynamic nature and strategic consolidation efforts.
- Market Concentration: Moderate, with top 5 players holding approximately xx% of market share in 2025.
- Technological Drivers: Mobile wallets, biometric authentication, AI-powered fraud detection.
- Regulatory Framework: PCI DSS compliance, data privacy regulations (e.g., CCPA, GDPR implications).
- Competitive Substitutes: Cash, checks, traditional credit/debit card transactions.
- End-User Demographics: High adoption among millennials and Gen Z, growing penetration across all age groups.
- M&A Trends: High volume of M&A activity, driven by expansion into new markets and technologies (e.g., Global Payments Inc. acquisition of MineralTree). Estimated xx M&A deals in the period 2019-2024.
USA Digital Payment Market Growth Trends & Insights
The USA digital payment market has witnessed substantial growth over the past few years, driven by the factors outlined above. The market size has expanded from xx Million in 2019 to an estimated xx Million in 2025, exhibiting a Compound Annual Growth Rate (CAGR) of xx% during the historical period. This growth trajectory is expected to continue, with a forecasted CAGR of xx% from 2025 to 2033. Increased consumer preference for digital channels, technological advancements in payment processing, and supportive government initiatives have fueled adoption rates. Disruptive technologies, such as blockchain and decentralized finance (DeFi), present both opportunities and challenges for market players. Consumer behavior shifts towards contactless payments and mobile wallets indicate ongoing digital transformation.
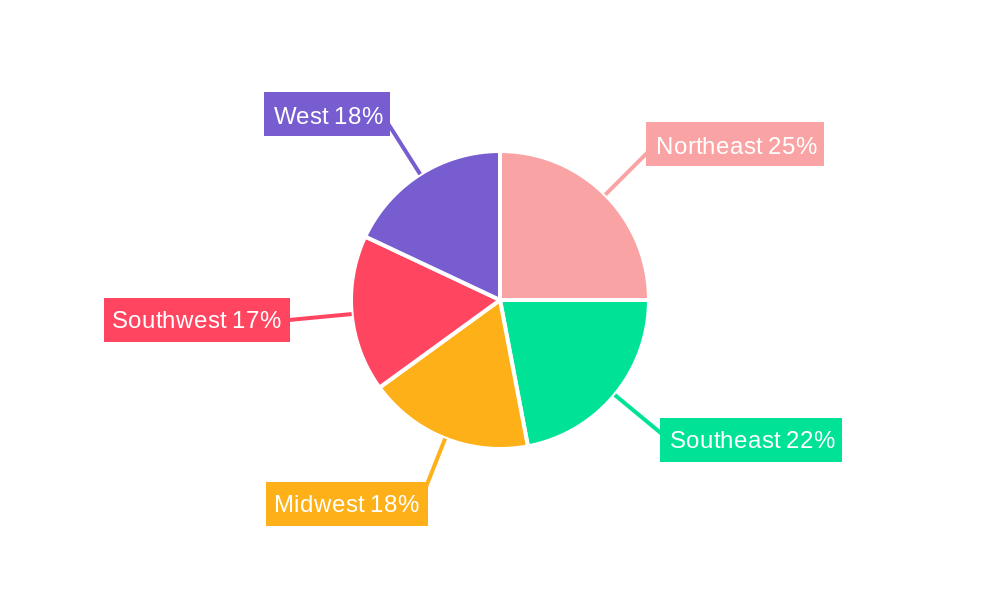
Dominant Regions, Countries, or Segments in USA Digital Payment Market
The Retail and Online Sale segments are currently the dominant forces within the USA digital payment market. The Retail segment benefits from the widespread adoption of POS systems across various retail formats, while Online Sale's dominance reflects the explosive growth of e-commerce. California, New York, and Texas are among the leading states in terms of digital payment adoption, driven by high population density, robust digital infrastructure, and a thriving tech sector.
- Key Drivers (Retail Segment): Increased POS system deployment, omnichannel integration, consumer preference for contactless payments.
- Key Drivers (Online Sale Segment): Growth of e-commerce, mobile commerce, improved online payment security.
- Dominance Factors: High transaction volumes, favorable regulatory environments, strong consumer adoption.
- Growth Potential: Continued expansion of e-commerce, rising smartphone penetration, increasing consumer trust in digital payments.
USA Digital Payment Market Product Landscape
The USA digital payment market showcases a diverse product landscape encompassing mobile wallets (Apple Pay, Google Pay), online payment gateways (PayPal, Stripe), POS systems, and other specialized solutions. These solutions offer a range of features, including contactless payments, fraud prevention, and robust security protocols. Innovative products are constantly emerging, with a focus on enhancing user experience, security, and integration with other financial services. Key advancements include the use of biometric authentication and artificial intelligence for fraud detection.
Key Drivers, Barriers & Challenges in USA Digital Payment Market
Key Drivers:
- Increasing smartphone penetration and internet access.
- Growing preference for contactless and cashless transactions.
- Expansion of e-commerce and mobile commerce.
- Government initiatives promoting digital financial inclusion.
Challenges and Restraints:
- Data security and privacy concerns.
- Regulatory hurdles and compliance requirements.
- Interoperability issues between different payment systems.
- Competition from established and emerging players.
- The potential impact of fraud and cyber threats on consumer confidence (estimated xx% increase in fraud attempts from 2024 to 2025).
Emerging Opportunities in USA Digital Payment Market
- Growing adoption of Buy Now, Pay Later (BNPL) services.
- Increasing demand for embedded finance solutions.
- Expansion of digital payment solutions into underserved markets.
- Integration of blockchain technology and cryptocurrencies.
- Development of innovative payment solutions for the metaverse and Web3.
Growth Accelerators in the USA Digital Payment Market Industry
The USA digital payment market is poised for sustained growth, driven by several key factors. Technological advancements, particularly in areas such as Artificial Intelligence (AI) for fraud prevention and the development of innovative payment methods, continue to improve the efficiency and security of digital transactions. Strategic partnerships between financial institutions, technology providers, and retailers are fostering seamless integration of digital payment solutions into various industries. Furthermore, government initiatives promoting digital financial inclusion are expanding market access and adoption.
Key Players Shaping the USA Digital Payment Market Market
- Beacon Payments LLC
- Stripe Inc
- Amazon Pay
- Blue Pay
- Google Pay
- Tsys (Global Payments Inc)
- PayPal
- Chase Paymentech
- Dwolla
- Ingenico
Notable Milestones in USA Digital Payment Market Sector
- September 2021: Global Payments Inc. acquired MineralTree, expanding its B2B payment solutions portfolio.
- April 2022: Dwolla launched Virtual Account Numbers (VANs), enhancing payment workflow management.
In-Depth USA Digital Payment Market Market Outlook
The USA digital payment market is projected to maintain a strong growth trajectory throughout the forecast period, driven by the continued adoption of digital technologies, expanding e-commerce activity, and the increasing demand for secure and convenient payment solutions. Strategic opportunities exist for companies focused on innovation, particularly in areas such as embedded finance, BNPL solutions, and the integration of blockchain technology. The market's expansion into underserved communities and the development of solutions tailored to specific industry needs present further growth prospects. The long-term outlook remains positive, indicating a significant potential for expansion and market consolidation.
USA Digital Payment Market Segmentation
-
1. Mode of Payment
-
1.1. Point of Sale
- 1.1.1. Card Pay
- 1.1.2. Digital Wallet (includes Mobile Wallets)
- 1.1.3. Cash
- 1.1.4. Others
-
1.2. Online Sale
- 1.2.1. Others (
-
1.1. Point of Sale
-
2. End-user Industry
- 2.1. Retail
- 2.2. Entertainment
- 2.3. Healthcare
- 2.4. Hospitality
- 2.5. Other End-user Industries
USA Digital Payment Market Segmentation By Geography
-
1. North America
- 1.1. United States
- 1.2. Canada
- 1.3. Mexico
-
2. South America
- 2.1. Brazil
- 2.2. Argentina
- 2.3. Rest of South America
-
3. Europe
- 3.1. United Kingdom
- 3.2. Germany
- 3.3. France
- 3.4. Italy
- 3.5. Spain
- 3.6. Russia
- 3.7. Benelux
- 3.8. Nordics
- 3.9. Rest of Europe
-
4. Middle East & Africa
- 4.1. Turkey
- 4.2. Israel
- 4.3. GCC
- 4.4. North Africa
- 4.5. South Africa
- 4.6. Rest of Middle East & Africa
-
5. Asia Pacific
- 5.1. China
- 5.2. India
- 5.3. Japan
- 5.4. South Korea
- 5.5. ASEAN
- 5.6. Oceania
- 5.7. Rest of Asia Pacific
USA Digital Payment Market Regional Market Share
Geographic Coverage of USA Digital Payment Market
USA Digital Payment Market REPORT HIGHLIGHTS
| Aspects | Details |
|---|---|
| Study Period | 2020-2034 |
| Base Year | 2025 |
| Estimated Year | 2026 |
| Forecast Period | 2026-2034 |
| Historical Period | 2020-2025 |
| Growth Rate | CAGR of 16.2% from 2020-2034 |
| Segmentation |
|
Table of Contents
- 1. Introduction
- 1.1. Research Scope
- 1.2. Market Segmentation
- 1.3. Research Objective
- 1.4. Definitions and Assumptions
- 2. Executive Summary
- 2.1. Market Snapshot
- 3. Market Dynamics
- 3.1. Market Drivers
- 3.2. Market Restrains
- 3.3. Market Trends
- 3.4. Market Opportunities
- 4. Market Factor Analysis
- 4.1. Porters Five Forces
- 4.1.1. Bargaining Power of Suppliers
- 4.1.2. Bargaining Power of Buyers
- 4.1.3. Threat of New Entrants
- 4.1.4. Threat of Substitutes
- 4.1.5. Competitive Rivalry
- 4.2. PESTEL analysis
- 4.3. BCG Analysis
- 4.3.1. Stars (High Growth, High Market Share)
- 4.3.2. Cash Cows (Low Growth, High Market Share)
- 4.3.3. Question Mark (High Growth, Low Market Share)
- 4.3.4. Dogs (Low Growth, Low Market Share)
- 4.4. Ansoff Matrix Analysis
- 4.5. Supply Chain Analysis
- 4.6. Regulatory Landscape
- 4.7. Current Market Potential and Opportunity Assessment (TAM–SAM–SOM Framework)
- 4.8. IMR Analyst Note
- 4.1. Porters Five Forces
- 5. Market Analysis, Insights and Forecast 2021-2033
- 5.1. Market Analysis, Insights and Forecast - by Mode of Payment
- 5.1.1. Point of Sale
- 5.1.1.1. Card Pay
- 5.1.1.2. Digital Wallet (includes Mobile Wallets)
- 5.1.1.3. Cash
- 5.1.1.4. Others
- 5.1.2. Online Sale
- 5.1.2.1. Others (
- 5.1.1. Point of Sale
- 5.2. Market Analysis, Insights and Forecast - by End-user Industry
- 5.2.1. Retail
- 5.2.2. Entertainment
- 5.2.3. Healthcare
- 5.2.4. Hospitality
- 5.2.5. Other End-user Industries
- 5.3. Market Analysis, Insights and Forecast - by Region
- 5.3.1. North America
- 5.3.2. South America
- 5.3.3. Europe
- 5.3.4. Middle East & Africa
- 5.3.5. Asia Pacific
- 5.1. Market Analysis, Insights and Forecast - by Mode of Payment
- 6. Global USA Digital Payment Market Analysis, Insights and Forecast, 2021-2033
- 6.1. Market Analysis, Insights and Forecast - by Mode of Payment
- 6.1.1. Point of Sale
- 6.1.1.1. Card Pay
- 6.1.1.2. Digital Wallet (includes Mobile Wallets)
- 6.1.1.3. Cash
- 6.1.1.4. Others
- 6.1.2. Online Sale
- 6.1.2.1. Others (
- 6.1.1. Point of Sale
- 6.2. Market Analysis, Insights and Forecast - by End-user Industry
- 6.2.1. Retail
- 6.2.2. Entertainment
- 6.2.3. Healthcare
- 6.2.4. Hospitality
- 6.2.5. Other End-user Industries
- 6.1. Market Analysis, Insights and Forecast - by Mode of Payment
- 7. North America USA Digital Payment Market Analysis, Insights and Forecast, 2020-2032
- 7.1. Market Analysis, Insights and Forecast - by Mode of Payment
- 7.1.1. Point of Sale
- 7.1.1.1. Card Pay
- 7.1.1.2. Digital Wallet (includes Mobile Wallets)
- 7.1.1.3. Cash
- 7.1.1.4. Others
- 7.1.2. Online Sale
- 7.1.2.1. Others (
- 7.1.1. Point of Sale
- 7.2. Market Analysis, Insights and Forecast - by End-user Industry
- 7.2.1. Retail
- 7.2.2. Entertainment
- 7.2.3. Healthcare
- 7.2.4. Hospitality
- 7.2.5. Other End-user Industries
- 7.1. Market Analysis, Insights and Forecast - by Mode of Payment
- 8. South America USA Digital Payment Market Analysis, Insights and Forecast, 2020-2032
- 8.1. Market Analysis, Insights and Forecast - by Mode of Payment
- 8.1.1. Point of Sale
- 8.1.1.1. Card Pay
- 8.1.1.2. Digital Wallet (includes Mobile Wallets)
- 8.1.1.3. Cash
- 8.1.1.4. Others
- 8.1.2. Online Sale
- 8.1.2.1. Others (
- 8.1.1. Point of Sale
- 8.2. Market Analysis, Insights and Forecast - by End-user Industry
- 8.2.1. Retail
- 8.2.2. Entertainment
- 8.2.3. Healthcare
- 8.2.4. Hospitality
- 8.2.5. Other End-user Industries
- 8.1. Market Analysis, Insights and Forecast - by Mode of Payment
- 9. Europe USA Digital Payment Market Analysis, Insights and Forecast, 2020-2032
- 9.1. Market Analysis, Insights and Forecast - by Mode of Payment
- 9.1.1. Point of Sale
- 9.1.1.1. Card Pay
- 9.1.1.2. Digital Wallet (includes Mobile Wallets)
- 9.1.1.3. Cash
- 9.1.1.4. Others
- 9.1.2. Online Sale
- 9.1.2.1. Others (
- 9.1.1. Point of Sale
- 9.2. Market Analysis, Insights and Forecast - by End-user Industry
- 9.2.1. Retail
- 9.2.2. Entertainment
- 9.2.3. Healthcare
- 9.2.4. Hospitality
- 9.2.5. Other End-user Industries
- 9.1. Market Analysis, Insights and Forecast - by Mode of Payment
- 10. Middle East & Africa USA Digital Payment Market Analysis, Insights and Forecast, 2020-2032
- 10.1. Market Analysis, Insights and Forecast - by Mode of Payment
- 10.1.1. Point of Sale
- 10.1.1.1. Card Pay
- 10.1.1.2. Digital Wallet (includes Mobile Wallets)
- 10.1.1.3. Cash
- 10.1.1.4. Others
- 10.1.2. Online Sale
- 10.1.2.1. Others (
- 10.1.1. Point of Sale
- 10.2. Market Analysis, Insights and Forecast - by End-user Industry
- 10.2.1. Retail
- 10.2.2. Entertainment
- 10.2.3. Healthcare
- 10.2.4. Hospitality
- 10.2.5. Other End-user Industries
- 10.1. Market Analysis, Insights and Forecast - by Mode of Payment
- 11. Asia Pacific USA Digital Payment Market Analysis, Insights and Forecast, 2020-2032
- 11.1. Market Analysis, Insights and Forecast - by Mode of Payment
- 11.1.1. Point of Sale
- 11.1.1.1. Card Pay
- 11.1.1.2. Digital Wallet (includes Mobile Wallets)
- 11.1.1.3. Cash
- 11.1.1.4. Others
- 11.1.2. Online Sale
- 11.1.2.1. Others (
- 11.1.1. Point of Sale
- 11.2. Market Analysis, Insights and Forecast - by End-user Industry
- 11.2.1. Retail
- 11.2.2. Entertainment
- 11.2.3. Healthcare
- 11.2.4. Hospitality
- 11.2.5. Other End-user Industries
- 11.1. Market Analysis, Insights and Forecast - by Mode of Payment
- 12. Competitive Analysis
- 12.1. Company Profiles
- 12.1.1 Beacon Payments LLC*List Not Exhaustive
- 12.1.1.1. Company Overview
- 12.1.1.2. Products
- 12.1.1.3. Company Financials
- 12.1.1.4. SWOT Analysis
- 12.1.2 Stripe Inc
- 12.1.2.1. Company Overview
- 12.1.2.2. Products
- 12.1.2.3. Company Financials
- 12.1.2.4. SWOT Analysis
- 12.1.3 Amazon Pay
- 12.1.3.1. Company Overview
- 12.1.3.2. Products
- 12.1.3.3. Company Financials
- 12.1.3.4. SWOT Analysis
- 12.1.4 Blue Pay
- 12.1.4.1. Company Overview
- 12.1.4.2. Products
- 12.1.4.3. Company Financials
- 12.1.4.4. SWOT Analysis
- 12.1.5 Google Pay
- 12.1.5.1. Company Overview
- 12.1.5.2. Products
- 12.1.5.3. Company Financials
- 12.1.5.4. SWOT Analysis
- 12.1.6 Tsys (Global Payments Inc )
- 12.1.6.1. Company Overview
- 12.1.6.2. Products
- 12.1.6.3. Company Financials
- 12.1.6.4. SWOT Analysis
- 12.1.7 PayPal
- 12.1.7.1. Company Overview
- 12.1.7.2. Products
- 12.1.7.3. Company Financials
- 12.1.7.4. SWOT Analysis
- 12.1.8 Chase Paymentech
- 12.1.8.1. Company Overview
- 12.1.8.2. Products
- 12.1.8.3. Company Financials
- 12.1.8.4. SWOT Analysis
- 12.1.9 Dwolla
- 12.1.9.1. Company Overview
- 12.1.9.2. Products
- 12.1.9.3. Company Financials
- 12.1.9.4. SWOT Analysis
- 12.1.10 Ingenico
- 12.1.10.1. Company Overview
- 12.1.10.2. Products
- 12.1.10.3. Company Financials
- 12.1.10.4. SWOT Analysis
- 12.1.1 Beacon Payments LLC*List Not Exhaustive
- 12.2. Market Entropy
- 12.2.1 Company's Key Areas Served
- 12.2.2 Recent Developments
- 12.3. Company Market Share Analysis 2025
- 12.3.1 Top 5 Companies Market Share Analysis
- 12.3.2 Top 3 Companies Market Share Analysis
- 12.4. List of Potential Customers
- 13. Research Methodology
List of Figures
- Figure 1: Global USA Digital Payment Market Revenue Breakdown (billion, %) by Region 2025 & 2033
- Figure 2: North America USA Digital Payment Market Revenue (billion), by Mode of Payment 2025 & 2033
- Figure 3: North America USA Digital Payment Market Revenue Share (%), by Mode of Payment 2025 & 2033
- Figure 4: North America USA Digital Payment Market Revenue (billion), by End-user Industry 2025 & 2033
- Figure 5: North America USA Digital Payment Market Revenue Share (%), by End-user Industry 2025 & 2033
- Figure 6: North America USA Digital Payment Market Revenue (billion), by Country 2025 & 2033
- Figure 7: North America USA Digital Payment Market Revenue Share (%), by Country 2025 & 2033
- Figure 8: South America USA Digital Payment Market Revenue (billion), by Mode of Payment 2025 & 2033
- Figure 9: South America USA Digital Payment Market Revenue Share (%), by Mode of Payment 2025 & 2033
- Figure 10: South America USA Digital Payment Market Revenue (billion), by End-user Industry 2025 & 2033
- Figure 11: South America USA Digital Payment Market Revenue Share (%), by End-user Industry 2025 & 2033
- Figure 12: South America USA Digital Payment Market Revenue (billion), by Country 2025 & 2033
- Figure 13: South America USA Digital Payment Market Revenue Share (%), by Country 2025 & 2033
- Figure 14: Europe USA Digital Payment Market Revenue (billion), by Mode of Payment 2025 & 2033
- Figure 15: Europe USA Digital Payment Market Revenue Share (%), by Mode of Payment 2025 & 2033
- Figure 16: Europe USA Digital Payment Market Revenue (billion), by End-user Industry 2025 & 2033
- Figure 17: Europe USA Digital Payment Market Revenue Share (%), by End-user Industry 2025 & 2033
- Figure 18: Europe USA Digital Payment Market Revenue (billion), by Country 2025 & 2033
- Figure 19: Europe USA Digital Payment Market Revenue Share (%), by Country 2025 & 2033
- Figure 20: Middle East & Africa USA Digital Payment Market Revenue (billion), by Mode of Payment 2025 & 2033
- Figure 21: Middle East & Africa USA Digital Payment Market Revenue Share (%), by Mode of Payment 2025 & 2033
- Figure 22: Middle East & Africa USA Digital Payment Market Revenue (billion), by End-user Industry 2025 & 2033
- Figure 23: Middle East & Africa USA Digital Payment Market Revenue Share (%), by End-user Industry 2025 & 2033
- Figure 24: Middle East & Africa USA Digital Payment Market Revenue (billion), by Country 2025 & 2033
- Figure 25: Middle East & Africa USA Digital Payment Market Revenue Share (%), by Country 2025 & 2033
- Figure 26: Asia Pacific USA Digital Payment Market Revenue (billion), by Mode of Payment 2025 & 2033
- Figure 27: Asia Pacific USA Digital Payment Market Revenue Share (%), by Mode of Payment 2025 & 2033
- Figure 28: Asia Pacific USA Digital Payment Market Revenue (billion), by End-user Industry 2025 & 2033
- Figure 29: Asia Pacific USA Digital Payment Market Revenue Share (%), by End-user Industry 2025 & 2033
- Figure 30: Asia Pacific USA Digital Payment Market Revenue (billion), by Country 2025 & 2033
- Figure 31: Asia Pacific USA Digital Payment Market Revenue Share (%), by Country 2025 & 2033
List of Tables
- Table 1: Global USA Digital Payment Market Revenue billion Forecast, by Mode of Payment 2020 & 2033
- Table 2: Global USA Digital Payment Market Revenue billion Forecast, by End-user Industry 2020 & 2033
- Table 3: Global USA Digital Payment Market Revenue billion Forecast, by Region 2020 & 2033
- Table 4: Global USA Digital Payment Market Revenue billion Forecast, by Mode of Payment 2020 & 2033
- Table 5: Global USA Digital Payment Market Revenue billion Forecast, by End-user Industry 2020 & 2033
- Table 6: Global USA Digital Payment Market Revenue billion Forecast, by Country 2020 & 2033
- Table 7: United States USA Digital Payment Market Revenue (billion) Forecast, by Application 2020 & 2033
- Table 8: Canada USA Digital Payment Market Revenue (billion) Forecast, by Application 2020 & 2033
- Table 9: Mexico USA Digital Payment Market Revenue (billion) Forecast, by Application 2020 & 2033
- Table 10: Global USA Digital Payment Market Revenue billion Forecast, by Mode of Payment 2020 & 2033
- Table 11: Global USA Digital Payment Market Revenue billion Forecast, by End-user Industry 2020 & 2033
- Table 12: Global USA Digital Payment Market Revenue billion Forecast, by Country 2020 & 2033
- Table 13: Brazil USA Digital Payment Market Revenue (billion) Forecast, by Application 2020 & 2033
- Table 14: Argentina USA Digital Payment Market Revenue (billion) Forecast, by Application 2020 & 2033
- Table 15: Rest of South America USA Digital Payment Market Revenue (billion) Forecast, by Application 2020 & 2033
- Table 16: Global USA Digital Payment Market Revenue billion Forecast, by Mode of Payment 2020 & 2033
- Table 17: Global USA Digital Payment Market Revenue billion Forecast, by End-user Industry 2020 & 2033
- Table 18: Global USA Digital Payment Market Revenue billion Forecast, by Country 2020 & 2033
- Table 19: United Kingdom USA Digital Payment Market Revenue (billion) Forecast, by Application 2020 & 2033
- Table 20: Germany USA Digital Payment Market Revenue (billion) Forecast, by Application 2020 & 2033
- Table 21: France USA Digital Payment Market Revenue (billion) Forecast, by Application 2020 & 2033
- Table 22: Italy USA Digital Payment Market Revenue (billion) Forecast, by Application 2020 & 2033
- Table 23: Spain USA Digital Payment Market Revenue (billion) Forecast, by Application 2020 & 2033
- Table 24: Russia USA Digital Payment Market Revenue (billion) Forecast, by Application 2020 & 2033
- Table 25: Benelux USA Digital Payment Market Revenue (billion) Forecast, by Application 2020 & 2033
- Table 26: Nordics USA Digital Payment Market Revenue (billion) Forecast, by Application 2020 & 2033
- Table 27: Rest of Europe USA Digital Payment Market Revenue (billion) Forecast, by Application 2020 & 2033
- Table 28: Global USA Digital Payment Market Revenue billion Forecast, by Mode of Payment 2020 & 2033
- Table 29: Global USA Digital Payment Market Revenue billion Forecast, by End-user Industry 2020 & 2033
- Table 30: Global USA Digital Payment Market Revenue billion Forecast, by Country 2020 & 2033
- Table 31: Turkey USA Digital Payment Market Revenue (billion) Forecast, by Application 2020 & 2033
- Table 32: Israel USA Digital Payment Market Revenue (billion) Forecast, by Application 2020 & 2033
- Table 33: GCC USA Digital Payment Market Revenue (billion) Forecast, by Application 2020 & 2033
- Table 34: North Africa USA Digital Payment Market Revenue (billion) Forecast, by Application 2020 & 2033
- Table 35: South Africa USA Digital Payment Market Revenue (billion) Forecast, by Application 2020 & 2033
- Table 36: Rest of Middle East & Africa USA Digital Payment Market Revenue (billion) Forecast, by Application 2020 & 2033
- Table 37: Global USA Digital Payment Market Revenue billion Forecast, by Mode of Payment 2020 & 2033
- Table 38: Global USA Digital Payment Market Revenue billion Forecast, by End-user Industry 2020 & 2033
- Table 39: Global USA Digital Payment Market Revenue billion Forecast, by Country 2020 & 2033
- Table 40: China USA Digital Payment Market Revenue (billion) Forecast, by Application 2020 & 2033
- Table 41: India USA Digital Payment Market Revenue (billion) Forecast, by Application 2020 & 2033
- Table 42: Japan USA Digital Payment Market Revenue (billion) Forecast, by Application 2020 & 2033
- Table 43: South Korea USA Digital Payment Market Revenue (billion) Forecast, by Application 2020 & 2033
- Table 44: ASEAN USA Digital Payment Market Revenue (billion) Forecast, by Application 2020 & 2033
- Table 45: Oceania USA Digital Payment Market Revenue (billion) Forecast, by Application 2020 & 2033
- Table 46: Rest of Asia Pacific USA Digital Payment Market Revenue (billion) Forecast, by Application 2020 & 2033
Frequently Asked Questions
1. What is the projected Compound Annual Growth Rate (CAGR) of the USA Digital Payment Market?
The projected CAGR is approximately 16.2%.
2. Which companies are prominent players in the USA Digital Payment Market?
Key companies in the market include Beacon Payments LLC*List Not Exhaustive, Stripe Inc, Amazon Pay, Blue Pay, Google Pay, Tsys (Global Payments Inc ), PayPal, Chase Paymentech, Dwolla, Ingenico.
3. What are the main segments of the USA Digital Payment Market?
The market segments include Mode of Payment, End-user Industry.
4. Can you provide details about the market size?
The market size is estimated to be USD 136.88 billion as of 2022.
5. What are some drivers contributing to market growth?
High proliferation of smartphones and e-commerce driving the market.
6. What are the notable trends driving market growth?
Retail businesses gaining more significant payment solutions.
7. Are there any restraints impacting market growth?
; Stringent Regulations in the Payments Industry.
8. Can you provide examples of recent developments in the market?
September 2021 - Global Payments Inc. announced an agreement to acquire MineralTree, a provider of accounts payable automation and B-2-B payments solutions. MineralTree's cloud-native solutions significantly expand the Global Payments target market and offer significant growth opportunities in the compelling technology markets.
9. What pricing options are available for accessing the report?
Pricing options include single-user, multi-user, and enterprise licenses priced at USD 3800, USD 4500, and USD 5800 respectively.
10. Is the market size provided in terms of value or volume?
The market size is provided in terms of value, measured in billion.
11. Are there any specific market keywords associated with the report?
Yes, the market keyword associated with the report is "USA Digital Payment Market," which aids in identifying and referencing the specific market segment covered.
12. How do I determine which pricing option suits my needs best?
The pricing options vary based on user requirements and access needs. Individual users may opt for single-user licenses, while businesses requiring broader access may choose multi-user or enterprise licenses for cost-effective access to the report.
13. Are there any additional resources or data provided in the USA Digital Payment Market report?
While the report offers comprehensive insights, it's advisable to review the specific contents or supplementary materials provided to ascertain if additional resources or data are available.
14. How can I stay updated on further developments or reports in the USA Digital Payment Market?
To stay informed about further developments, trends, and reports in the USA Digital Payment Market, consider subscribing to industry newsletters, following relevant companies and organizations, or regularly checking reputable industry news sources and publications.
Methodology
Step 1 - Identification of Relevant Samples Size from Population Database


Step 2 - Approaches for Defining Global Market Size (Value, Volume* & Price*)

Note*: In applicable scenarios
Step 3 - Data Sources
Primary Research
- Web Analytics
- Survey Reports
- Research Institute
- Latest Research Reports
- Opinion Leaders
Secondary Research
- Annual Reports
- White Paper
- Latest Press Release
- Industry Association
- Paid Database
- Investor Presentations

Step 4 - Data Triangulation
Involves using different sources of information in order to increase the validity of a study
These sources are likely to be stakeholders in a program - participants, other researchers, program staff, other community members, and so on.
Then we put all data in single framework & apply various statistical tools to find out the dynamic on the market.
During the analysis stage, feedback from the stakeholder groups would be compared to determine areas of agreement as well as areas of divergence